| Param | Original file | Final file |
|---|---|---|
| Filename | modeM0/AS1A05_056T01_9000002604_17592cztM0_level2.evt | modeM0/AS1A05_056T01_9000002604_17592cztM0_level2_quad_clean.evt |
| Size (bytes) | 551,229,120 | 103,239,360 |
| Size | 525.7 MB | 98.5 MB |
| Events in quadrant A | 4,262,773 | 662,943 |
| Events in quadrant B | 3,694,888 | 666,833 |
| Events in quadrant C | 4,445,000 | 631,815 |
| Events in quadrant D | 3,769,548 | 630,200 |
| Mode M9 | |||
|---|---|---|---|
| Quadrant | BADHDUFLAG | Total packets | Discarded packets |
| A | 0 | 7 | 0 |
| B | 0 | 7 | 0 |
| C | 0 | 7 | 0 |
| D | 0 | 7 | 0 |
| Mode M0 | |||
|---|---|---|---|
| Quadrant | BADHDUFLAG | Total packets | Discarded packets |
| A | 0 | 17970 | 3 |
| B | 0 | 16070 | 3 |
| C | 0 | 18120 | 3 |
| D | 0 | 16622 | 3 |
| Mode SS | |||
|---|---|---|---|
| Quadrant | BADHDUFLAG | Total packets | Discarded packets |
| A | 0 | 160 | 0 |
| B | 0 | 160 | 0 |
| C | 0 | 160 | 0 |
| D | 0 | 159 | 0 |
| Quadrant | Total seconds | Saturated seconds | Saturation percentage |
|---|---|---|---|
| A | 7687 | 252 | 3.278262% |
| B | 7687 | 133 | 1.730194% |
| C | 7688 | 173 | 2.250260% |
| D | 7688 | 169 | 2.198231% |
Noise dominated data is calculated using 1-second bins in cleaned event files. If a bin has >2000 counts, and if more than 50% of those come from <1% of pixels, then it is considered to be noise-dominated and hence unusable.
| Quadrant | # 1 sec bins | Bins with >0 counts | Bins with >2000 counts | High rate bins dominated by noise | Noise dominated (total time) | Noise dominated (detector-on time) | Marked lightcurve |
|---|---|---|---|---|---|---|---|
| A | 8382 | 7690 | 86 | 86 | 1.03% | 1.12% | 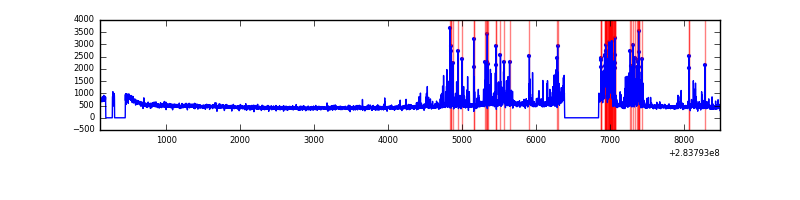 |
| B | 8382 | 7690 | 7 | 7 | 0.08% | 0.09% | 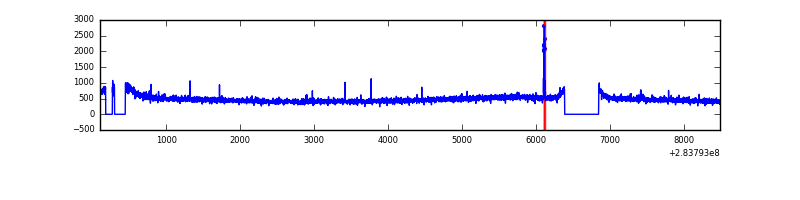 |
| C | 8383 | 7691 | 0 | 0 | 0.00% | 0.00% | 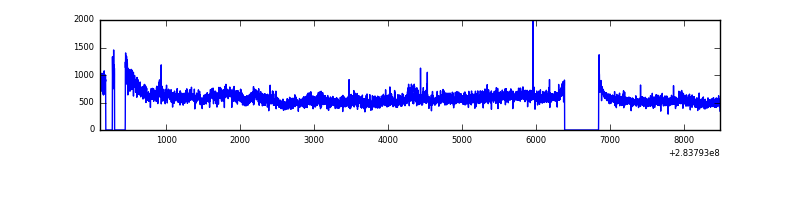 |
| D | 8383 | 7691 | 95 | 95 | 1.13% | 1.24% | 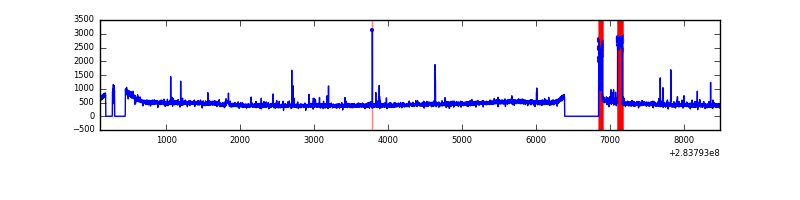 |
Top three noisy pixels from each quadrant. If the there are fewer than three noisy pixels in the level2.evt file, extra rows are filled as -1
| Pixel properties | Quadrant properties | ||||||
|---|---|---|---|---|---|---|---|
| Quadrant | DetID | PixID | Counts | Sigma | Mean | Median | Sigma |
| A | 14 | 237 | 664326 | 3463.57 | 933 | 912 | 191.5 |
| A | 0 | 13 | 11040 | 52.88 | 933 | 912 | 191.5 |
| A | 0 | 226 | 8110 | 37.58 | 933 | 912 | 191.5 |
| B | 0 | 189 | 33237 | 179.24 | 933 | 909 | 180.4 |
| B | 12 | 111 | 22697 | 120.8 | 933 | 909 | 180.4 |
| B | 11 | 111 | 19330 | 102.13 | 933 | 909 | 180.4 |
| C | 3 | 233 | 754565 | 3580.06 | 888 | 894 | 210.5 |
| C | 14 | 238 | 136120 | 642.34 | 888 | 894 | 210.5 |
| C | 5 | 218 | 71474 | 335.27 | 888 | 894 | 210.5 |
| D | 1 | 52 | 280826 | 1275.84 | 899 | 872 | 219.4 |
| D | 13 | 189 | 50412 | 225.77 | 899 | 872 | 219.4 |
| D | 10 | 172 | 32152 | 142.55 | 899 | 872 | 219.4 |
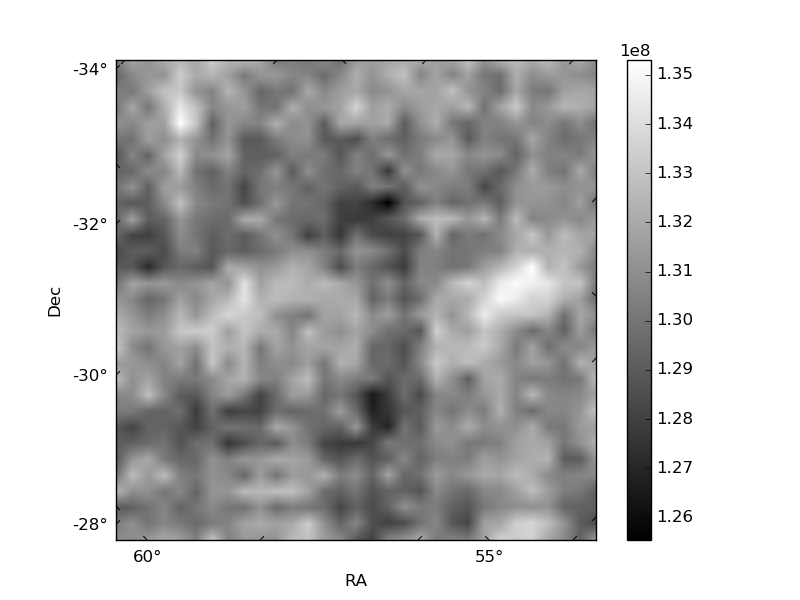
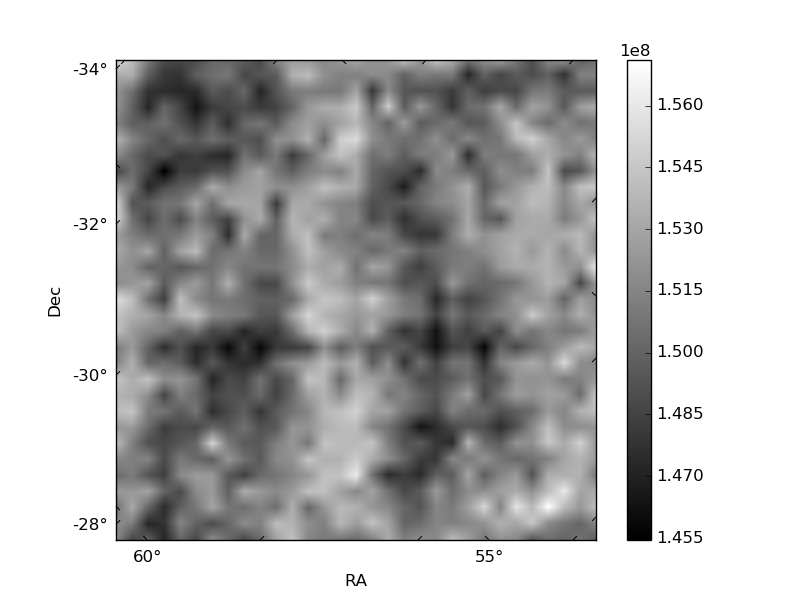
Histogram calculated using DETX and DETY for each event in the final _common_clean file
| Quadrant A |  |
 |
Quadrant B |
|---|---|---|---|
| Quadrant D |  |
 |
Quadrant C |
| Plot type | Count rate plots | Images |
|---|---|---|
| Comparison with Poisson distribution Blue bars denote a histogram of data divided into 1 sec bins. Red curve is a Poisson curve with rate = median count rate of data. |
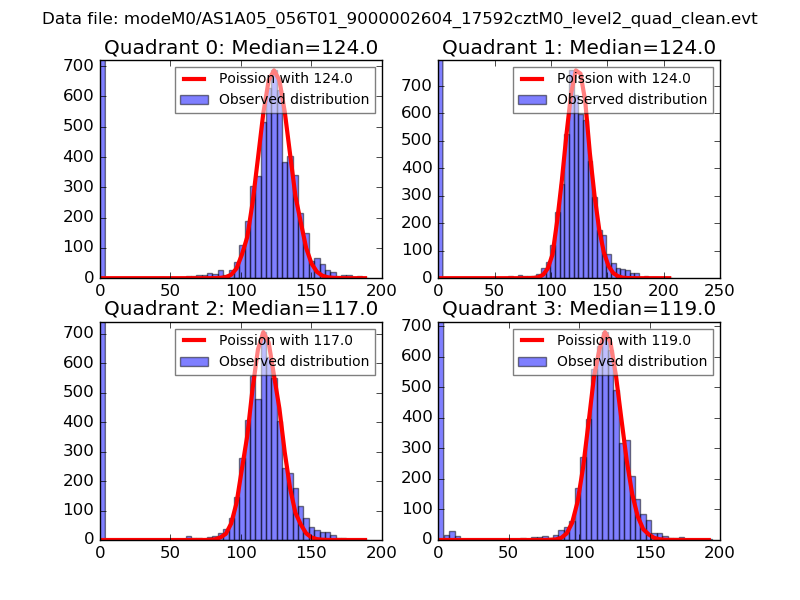 |
 |
| Quadrant-wise count rates Data is divided into 100 sec bins |
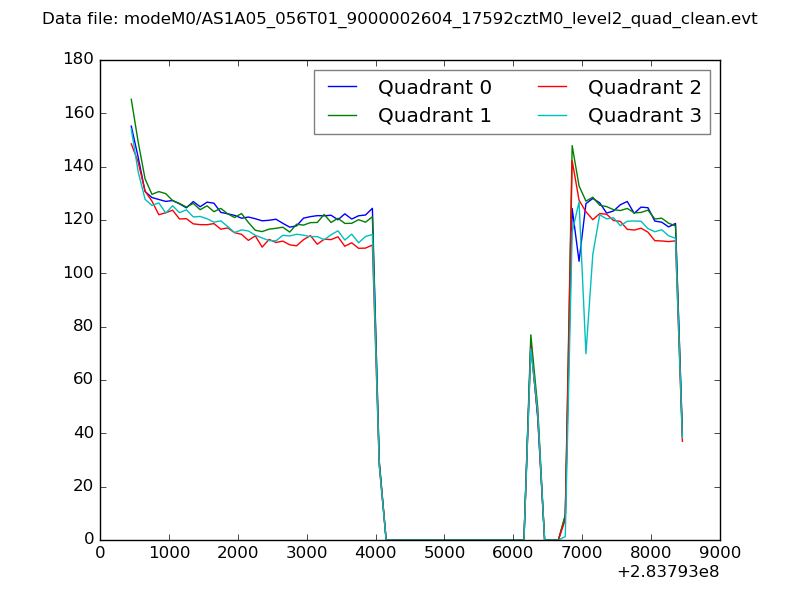 |
|
| Module-wise count rates for Quadrant A Data is divided into 100 sec bins |
 |
 |
| Module-wise count rates for Quadrant B Data is divided into 100 sec bins |
 |
 |
| Module-wise count rates for Quadrant C Data is divided into 100 sec bins |
 |
 |
| Module-wise count rates for Quadrant D Data is divided into 100 sec bins |
 |
 |
| Parameter | Plot |
|---|---|
| CZT HV Monitor |  |
| D_VDD | 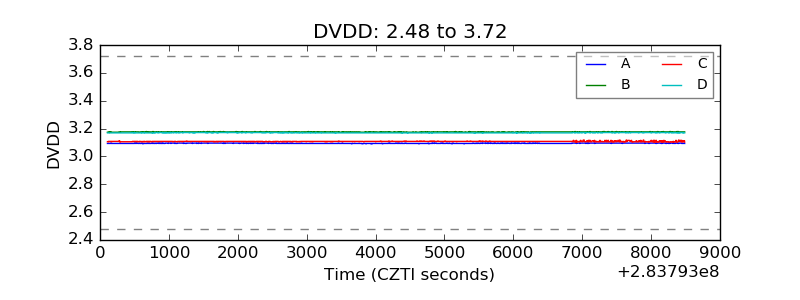 |
| Temperature 1 |  |
| Veto HV Monitor |  |
| Veto LLD |  |
| Alpha Counter |  |
| _CPM_Rate | 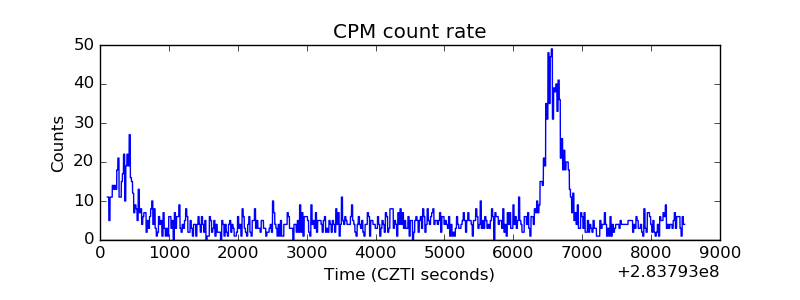 |
| CZT Counter |  |
| +2.5 Volts monitor |  |
| +5 Volts monitor |  |
| _ROLL_ROT |  |
| _Roll_DEC |  |
| _Roll_RA |  |
| Veto Counter |  |