| Param | Original file | Final file |
|---|---|---|
| Filename | modeM0/AS1A05_056T01_9000002604_17594cztM0_level2.evt | modeM0/AS1A05_056T01_9000002604_17594cztM0_level2_quad_clean.evt |
| Size (bytes) | 610,128,000 | 112,288,320 |
| Size | 581.9 MB | 107.1 MB |
| Events in quadrant A | 5,436,267 | 715,572 |
| Events in quadrant B | 3,766,313 | 731,926 |
| Events in quadrant C | 4,777,609 | 691,934 |
| Events in quadrant D | 3,940,267 | 689,789 |
| Mode M9 | |||
|---|---|---|---|
| Quadrant | BADHDUFLAG | Total packets | Discarded packets |
| A | 0 | 6 | 0 |
| B | 0 | 7 | 0 |
| C | 0 | 7 | 0 |
| D | 0 | 7 | 0 |
| Mode M0 | |||
|---|---|---|---|
| Quadrant | BADHDUFLAG | Total packets | Discarded packets |
| A | 0 | 21858 | 2 |
| B | 0 | 16806 | 2 |
| C | 0 | 19860 | 2 |
| D | 0 | 17787 | 2 |
| Mode SS | |||
|---|---|---|---|
| Quadrant | BADHDUFLAG | Total packets | Discarded packets |
| A | 0 | 166 | 0 |
| B | 0 | 166 | 0 |
| C | 0 | 166 | 0 |
| D | 0 | 166 | 0 |
| Quadrant | Total seconds | Saturated seconds | Saturation percentage |
|---|---|---|---|
| A | 8216 | 407 | 4.953749% |
| B | 8216 | 43 | 0.523369% |
| C | 8216 | 79 | 0.961538% |
| D | 8216 | 159 | 1.935248% |
Noise dominated data is calculated using 1-second bins in cleaned event files. If a bin has >2000 counts, and if more than 50% of those come from <1% of pixels, then it is considered to be noise-dominated and hence unusable.
| Quadrant | # 1 sec bins | Bins with >0 counts | Bins with >2000 counts | High rate bins dominated by noise | Noise dominated (total time) | Noise dominated (detector-on time) | Marked lightcurve |
|---|---|---|---|---|---|---|---|
| A | 8786 | 8217 | 252 | 252 | 2.87% | 3.07% | 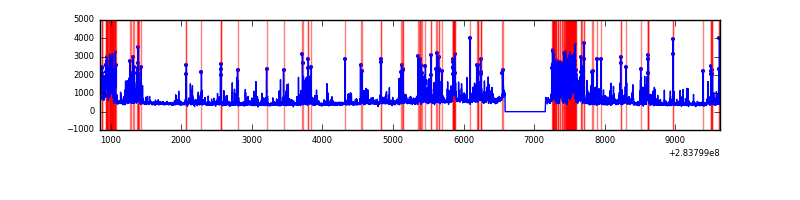 |
| B | 8786 | 8217 | 0 | 0 | 0.00% | 0.00% | 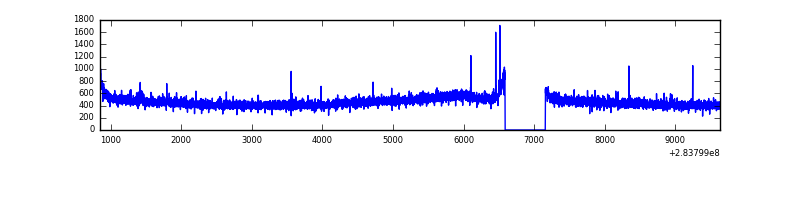 |
| C | 8786 | 8217 | 0 | 0 | 0.00% | 0.00% | 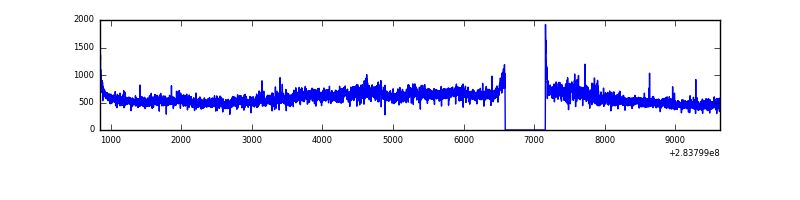 |
| D | 8786 | 8217 | 120 | 120 | 1.37% | 1.46% | 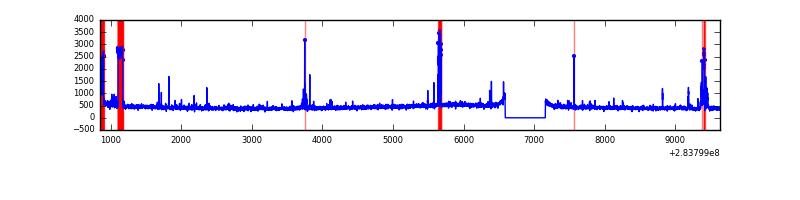 |
Top three noisy pixels from each quadrant. If the there are fewer than three noisy pixels in the level2.evt file, extra rows are filled as -1
| Pixel properties | Quadrant properties | ||||||
|---|---|---|---|---|---|---|---|
| Quadrant | DetID | PixID | Counts | Sigma | Mean | Median | Sigma |
| A | 14 | 237 | 1779365 | 9261.33 | 949 | 930 | 192.0 |
| A | 0 | 13 | 10321 | 48.9 | 949 | 930 | 192.0 |
| A | 0 | 226 | 8254 | 38.14 | 949 | 930 | 192.0 |
| B | 12 | 111 | 22845 | 119.06 | 959 | 937 | 184.0 |
| B | 11 | 111 | 19584 | 101.34 | 959 | 937 | 184.0 |
| B | 14 | 111 | 16838 | 86.42 | 959 | 937 | 184.0 |
| C | 3 | 233 | 986288 | 4566.6 | 912 | 916 | 215.8 |
| C | 14 | 238 | 139791 | 643.6 | 912 | 916 | 215.8 |
| C | 5 | 218 | 67581 | 308.95 | 912 | 916 | 215.8 |
| D | 1 | 52 | 271703 | 1201.29 | 918 | 890 | 225.4 |
| D | 13 | 189 | 125653 | 553.43 | 918 | 890 | 225.4 |
| D | 2 | 120 | 62875 | 274.96 | 918 | 890 | 225.4 |
Histogram calculated using DETX and DETY for each event in the final _common_clean file
| Quadrant A | 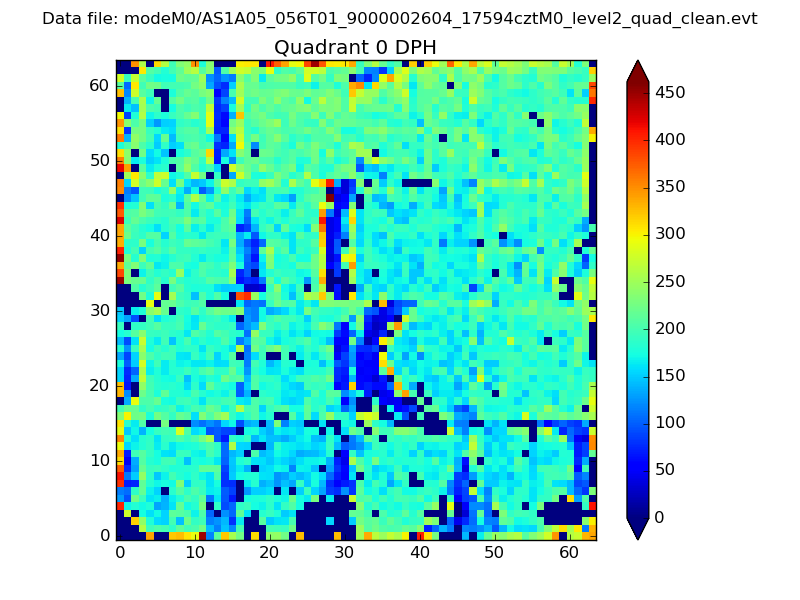 |
 |
Quadrant B |
|---|---|---|---|
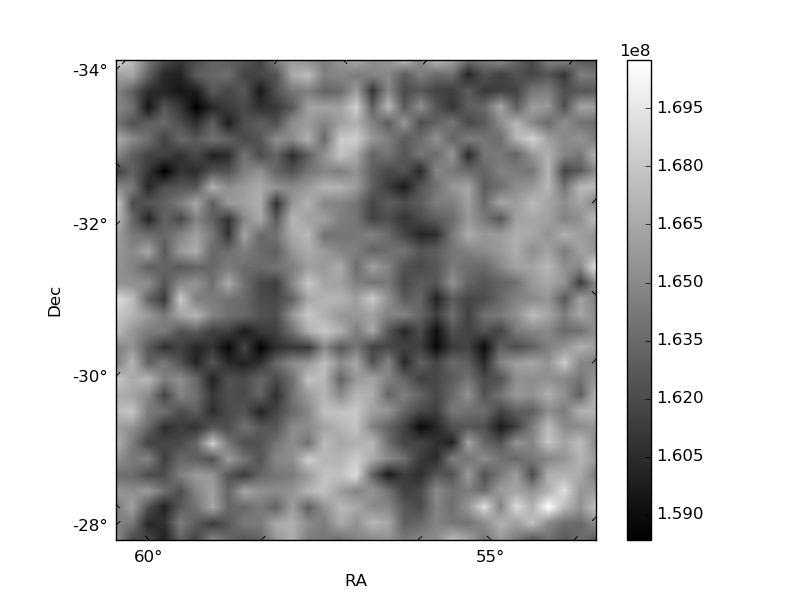
| Quadrant D | 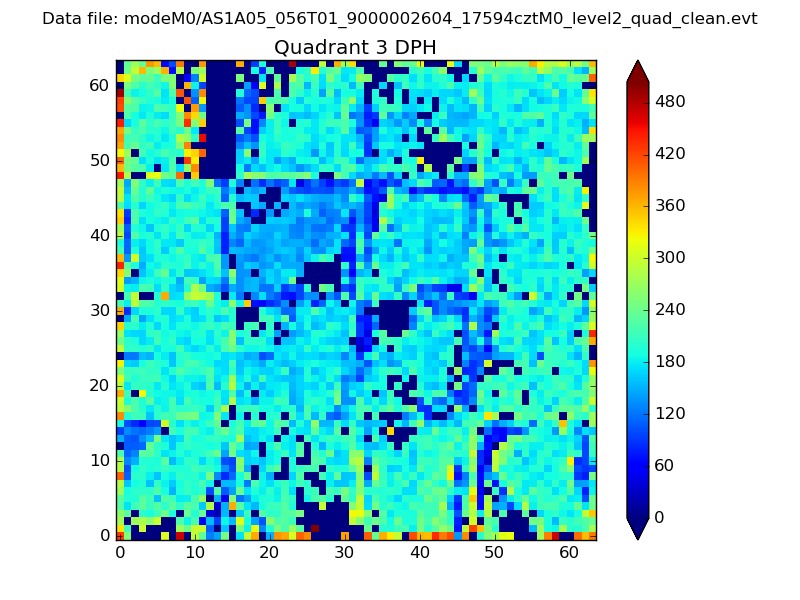 |
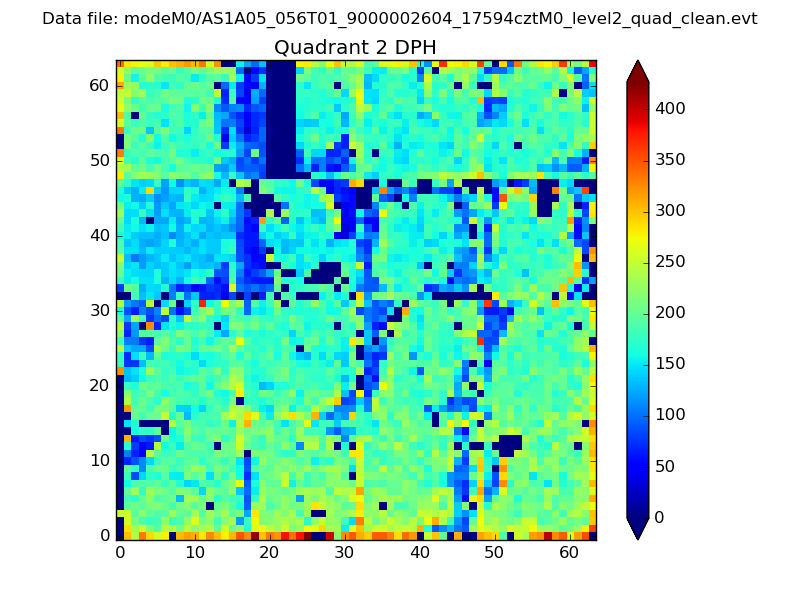 |
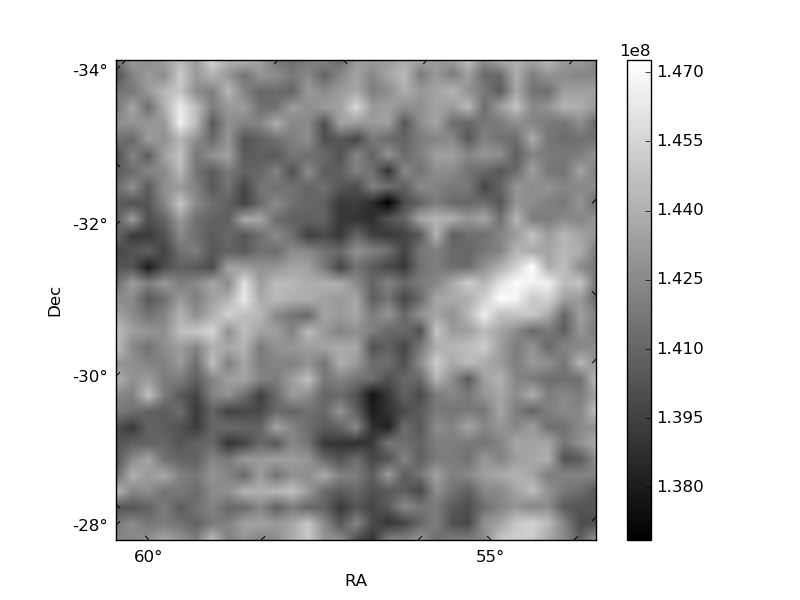
Quadrant C |
| Plot type | Count rate plots | Images |
|---|---|---|
| Comparison with Poisson distribution Blue bars denote a histogram of data divided into 1 sec bins. Red curve is a Poisson curve with rate = median count rate of data. |
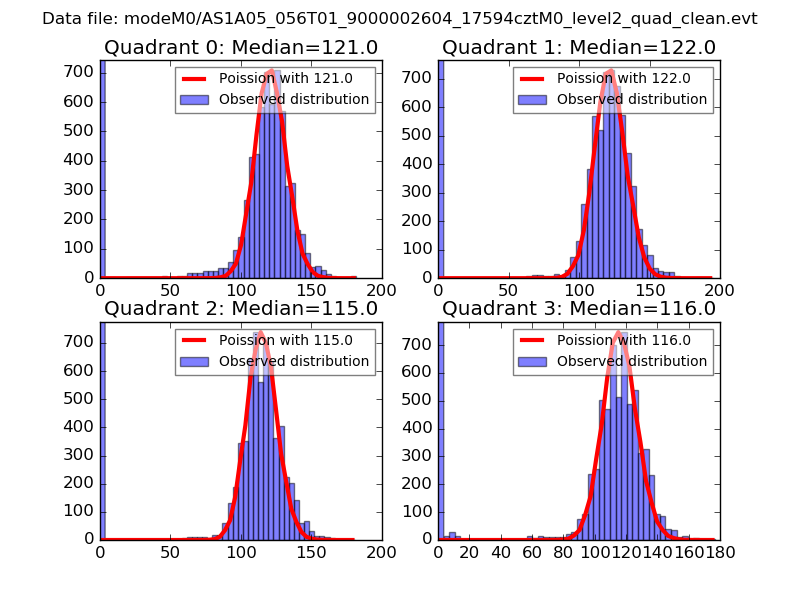 |
 |
| Quadrant-wise count rates Data is divided into 100 sec bins |
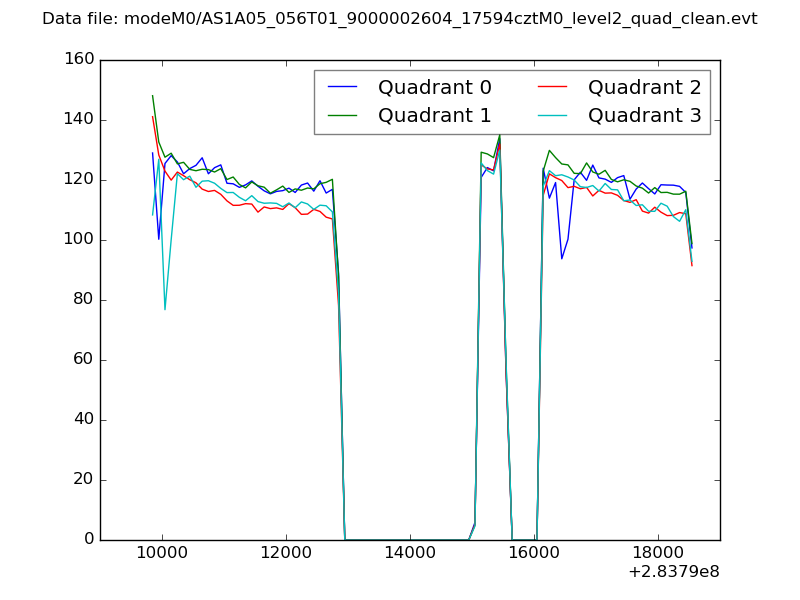 |
|
| Module-wise count rates for Quadrant A Data is divided into 100 sec bins |
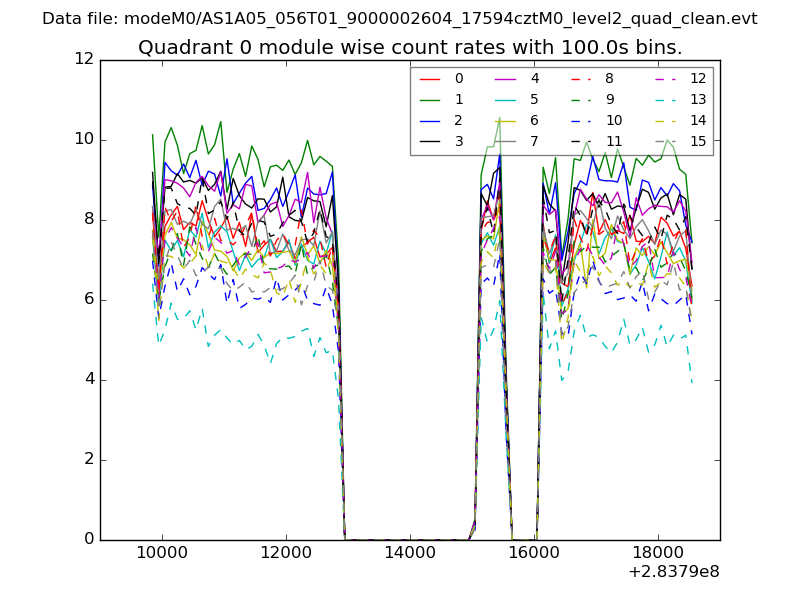 |
 |
| Module-wise count rates for Quadrant B Data is divided into 100 sec bins |
 |
 |
| Module-wise count rates for Quadrant C Data is divided into 100 sec bins |
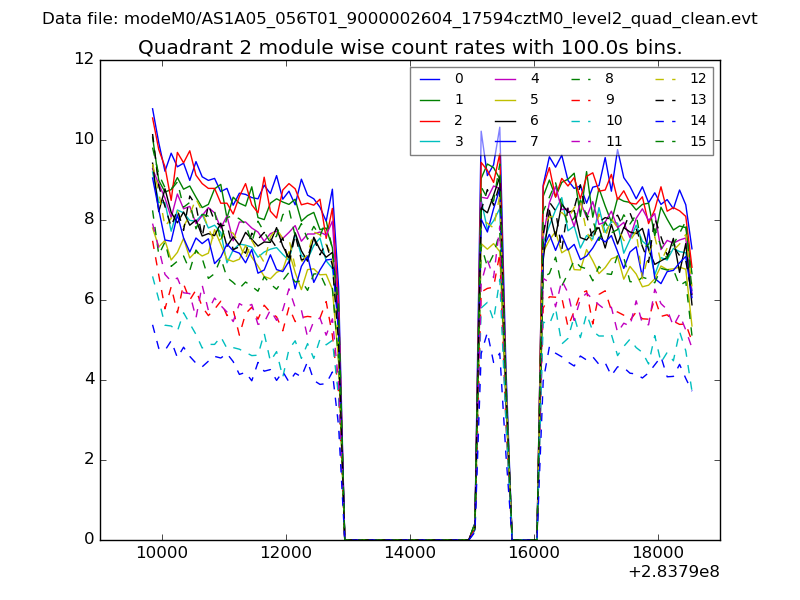 |
 |
| Module-wise count rates for Quadrant D Data is divided into 100 sec bins |
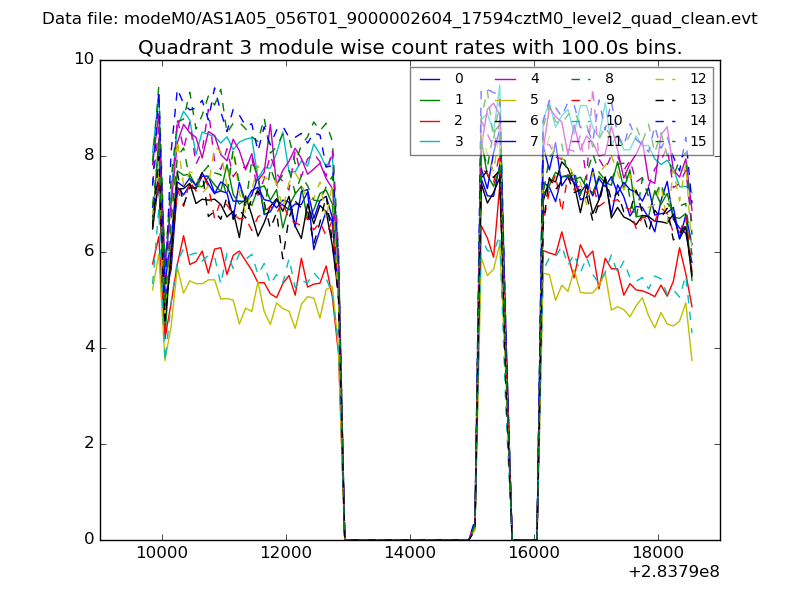 |
 |
| Parameter | Plot |
|---|---|
| CZT HV Monitor | 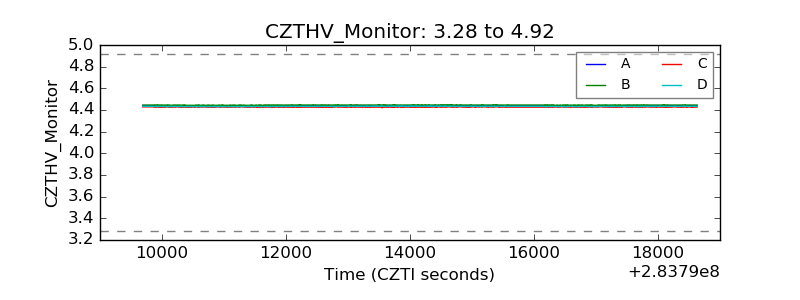 |
| D_VDD | 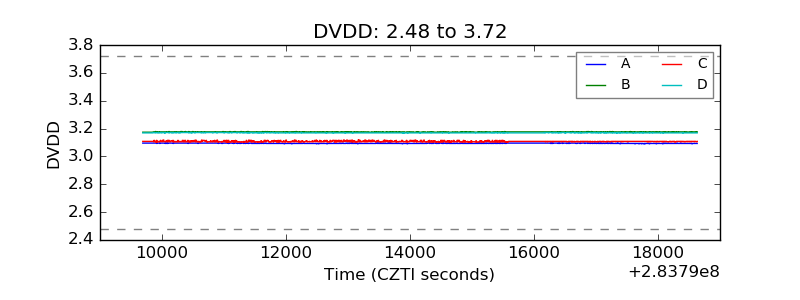 |
| Temperature 1 | 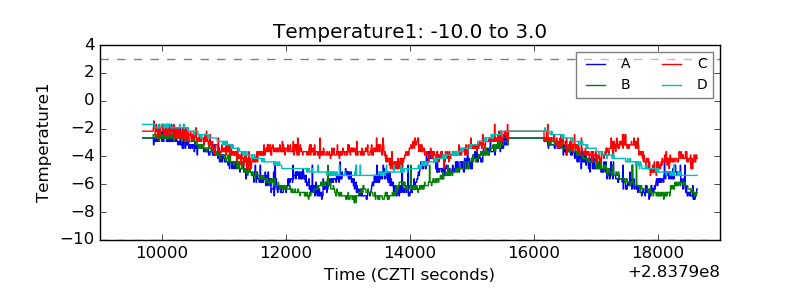 |
| Veto HV Monitor | 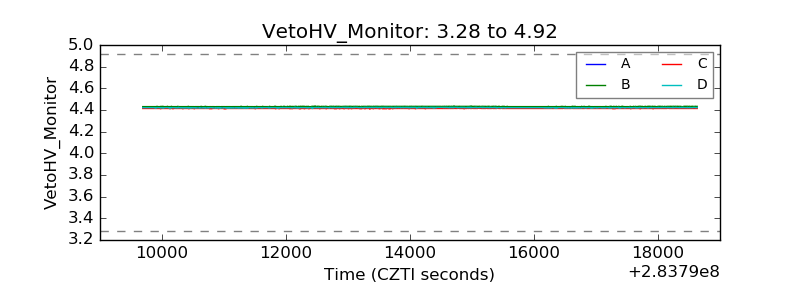 |
| Veto LLD | 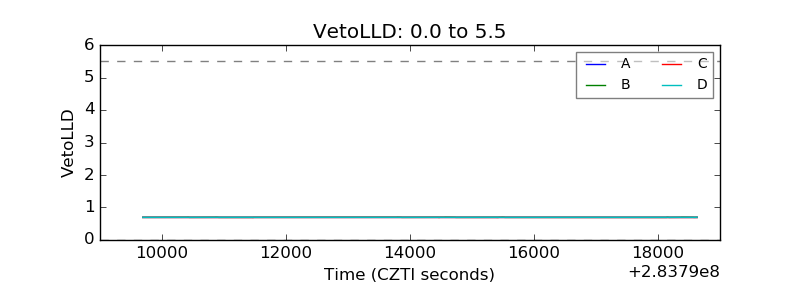 |
| Alpha Counter | 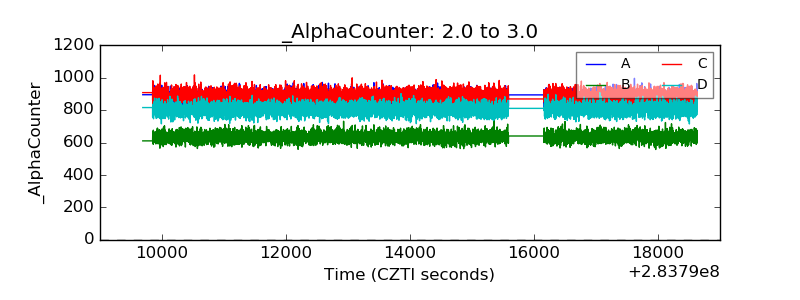 |
| _CPM_Rate | 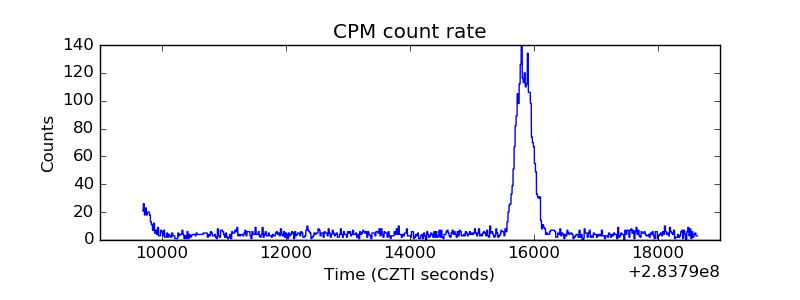 |
| CZT Counter | 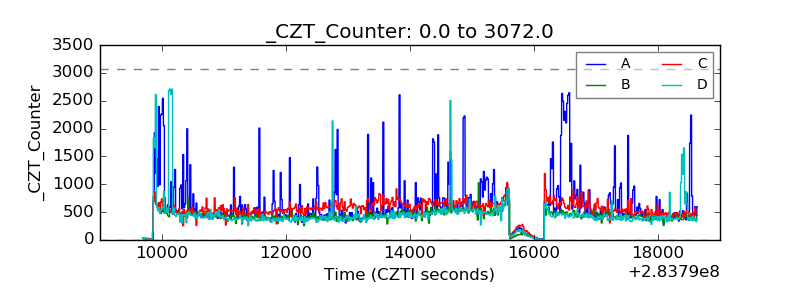 |
| +2.5 Volts monitor |  |
| +5 Volts monitor |  |
| _ROLL_ROT | 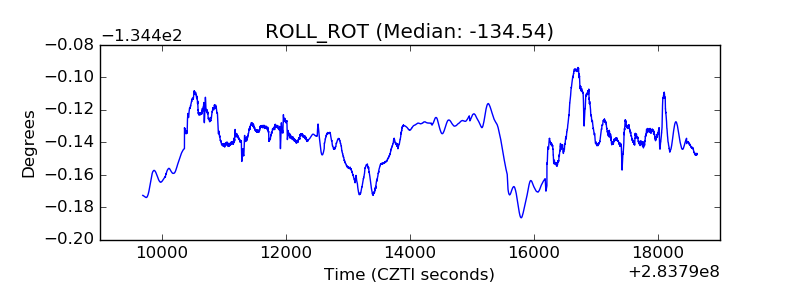 |
| _Roll_DEC | 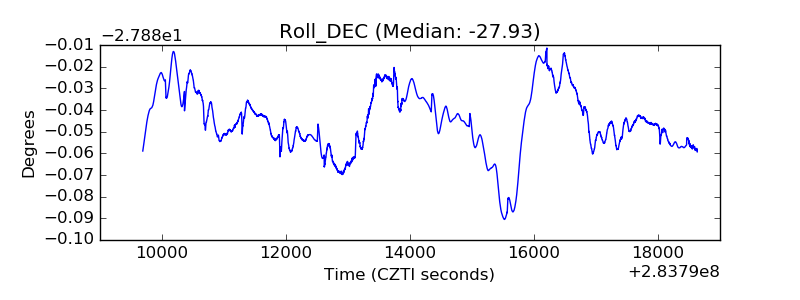 |
| _Roll_RA | 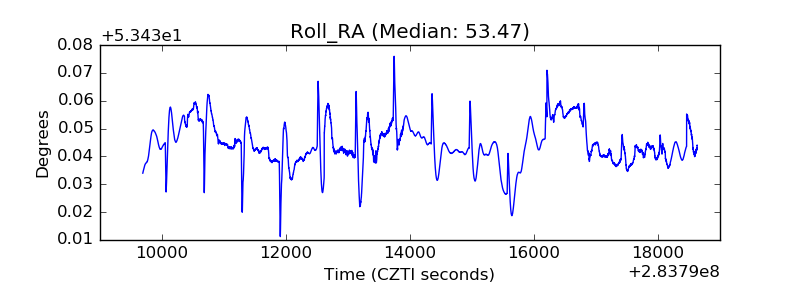 |
| Veto Counter | 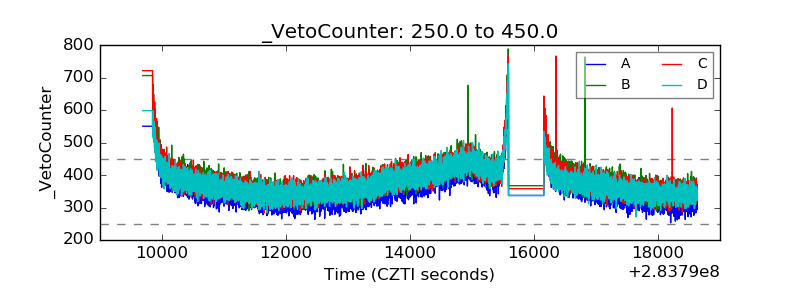 |