| Param | Original file | Final file |
|---|---|---|
| Filename | modeM0/AS1A05_056T01_9000002604_17595cztM0_level2.evt | modeM0/AS1A05_056T01_9000002604_17595cztM0_level2_quad_clean.evt |
| Size (bytes) | 802,437,120 | 137,151,360 |
| Size | 765.3 MB | 130.8 MB |
| Events in quadrant A | 6,369,007 | 856,814 |
| Events in quadrant B | 5,250,178 | 869,434 |
| Events in quadrant C | 6,518,505 | 820,926 |
| Events in quadrant D | 5,398,821 | 824,071 |
| Mode M9 | |||
|---|---|---|---|
| Quadrant | BADHDUFLAG | Total packets | Discarded packets |
| A | 0 | 16 | 0 |
| B | 0 | 16 | 0 |
| C | 0 | 16 | 0 |
| D | 0 | 16 | 0 |
| Mode M0 | |||
|---|---|---|---|
| Quadrant | BADHDUFLAG | Total packets | Discarded packets |
| A | 0 | 26306 | 2 |
| B | 0 | 23012 | 4 |
| C | 0 | 26550 | 2 |
| D | 0 | 24005 | 5 |
| Mode SS | |||
|---|---|---|---|
| Quadrant | BADHDUFLAG | Total packets | Discarded packets |
| A | 0 | 230 | 0 |
| B | 0 | 230 | 0 |
| C | 0 | 230 | 0 |
| D | 0 | 230 | 0 |
| Quadrant | Total seconds | Saturated seconds | Saturation percentage |
|---|---|---|---|
| A | 11308 | 194 | 1.715600% |
| B | 11306 | 43 | 0.380329% |
| C | 11306 | 93 | 0.822572% |
| D | 11306 | 32 | 0.283036% |
Noise dominated data is calculated using 1-second bins in cleaned event files. If a bin has >2000 counts, and if more than 50% of those come from <1% of pixels, then it is considered to be noise-dominated and hence unusable.
| Quadrant | # 1 sec bins | Bins with >0 counts | Bins with >2000 counts | High rate bins dominated by noise | Noise dominated (total time) | Noise dominated (detector-on time) | Marked lightcurve |
|---|---|---|---|---|---|---|---|
| A | 12903 | 11310 | 140 | 140 | 1.09% | 1.24% | 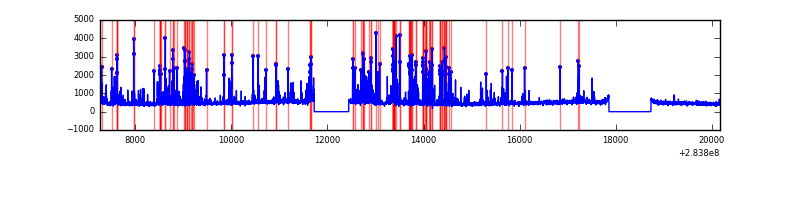 |
| B | 12902 | 11309 | 2 | 2 | 0.02% | 0.02% | 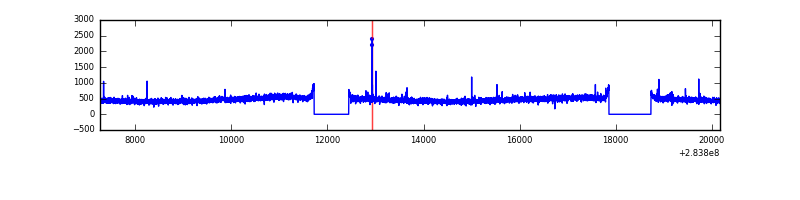 |
| C | 12902 | 11309 | 0 | 0 | 0.00% | 0.00% | 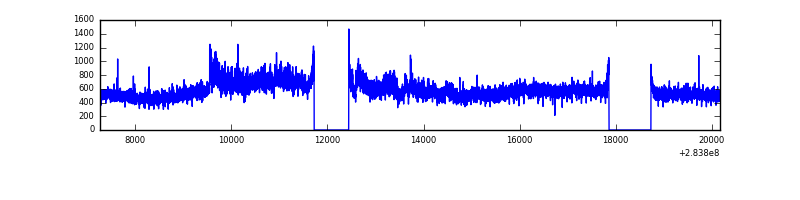 |
| D | 12901 | 11308 | 22 | 22 | 0.17% | 0.19% | 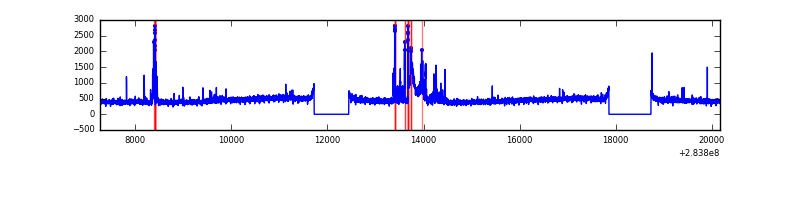 |
Top three noisy pixels from each quadrant. If the there are fewer than three noisy pixels in the level2.evt file, extra rows are filled as -1
| Pixel properties | Quadrant properties | ||||||
|---|---|---|---|---|---|---|---|
| Quadrant | DetID | PixID | Counts | Sigma | Mean | Median | Sigma |
| A | 14 | 237 | 1187020 | 4444.42 | 1327 | 1301 | 266.8 |
| A | 15 | 174 | 69520 | 255.7 | 1327 | 1301 | 266.8 |
| A | 0 | 13 | 13095 | 44.21 | 1327 | 1301 | 266.8 |
| B | 12 | 111 | 31795 | 119.27 | 1334 | 1300 | 255.7 |
| B | 11 | 111 | 27728 | 103.36 | 1334 | 1300 | 255.7 |
| B | 14 | 111 | 24288 | 89.91 | 1334 | 1300 | 255.7 |
| C | 3 | 233 | 1219936 | 4043.65 | 1281 | 1290 | 301.4 |
| C | 14 | 238 | 196899 | 649.06 | 1281 | 1290 | 301.4 |
| C | 5 | 218 | 96838 | 317.04 | 1281 | 1290 | 301.4 |
| D | 13 | 189 | 458826 | 1438.06 | 1298 | 1261 | 318.2 |
| D | 2 | 234 | 44327 | 135.35 | 1298 | 1261 | 318.2 |
| D | 2 | 152 | 13578 | 38.71 | 1298 | 1261 | 318.2 |
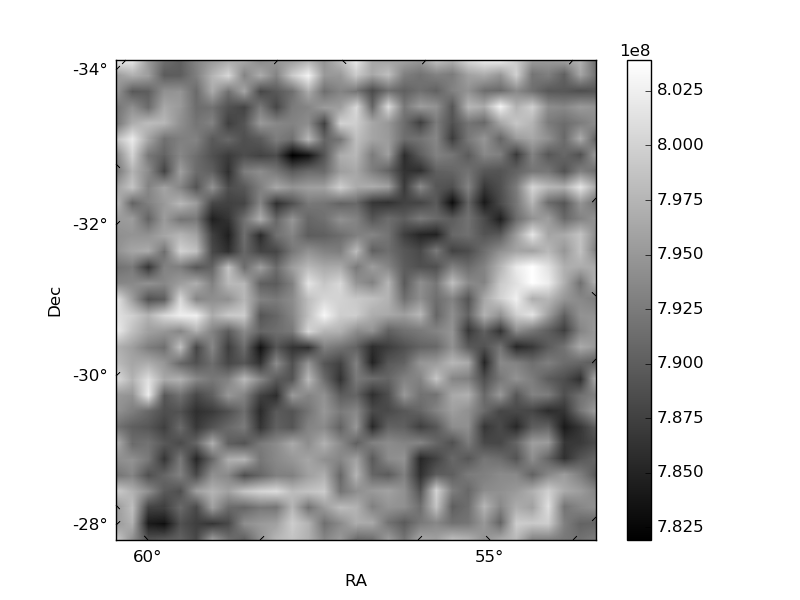
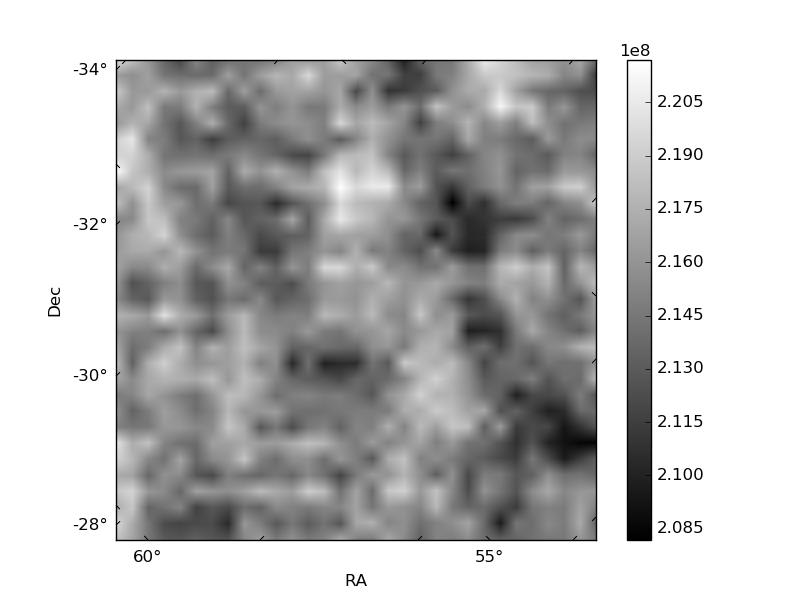
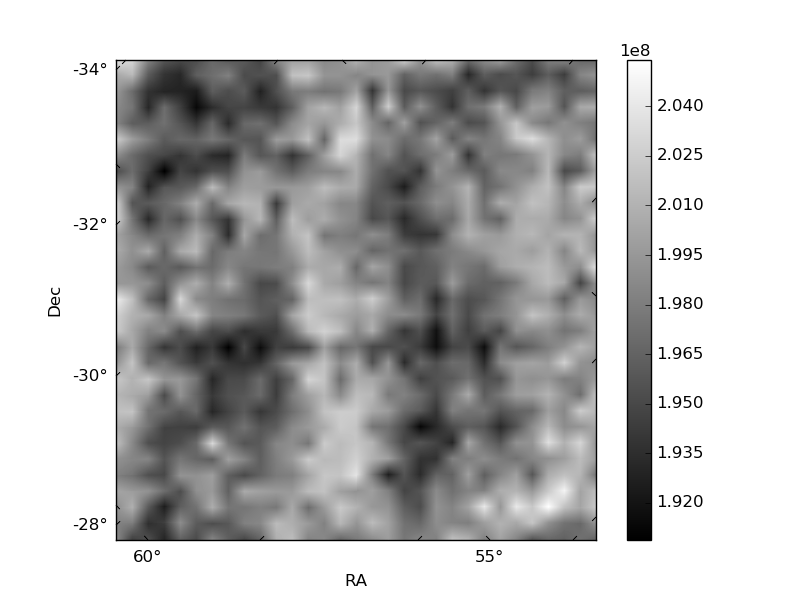
Histogram calculated using DETX and DETY for each event in the final _common_clean file
| Quadrant A | 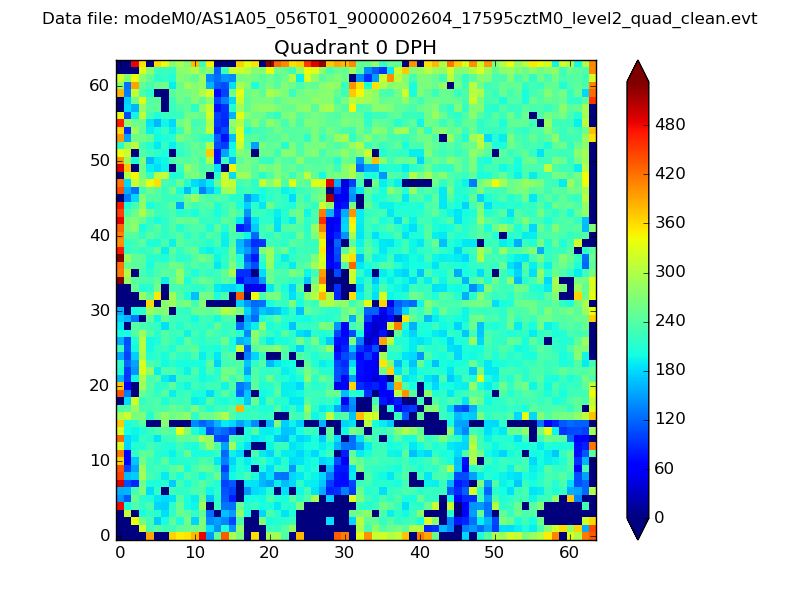 |
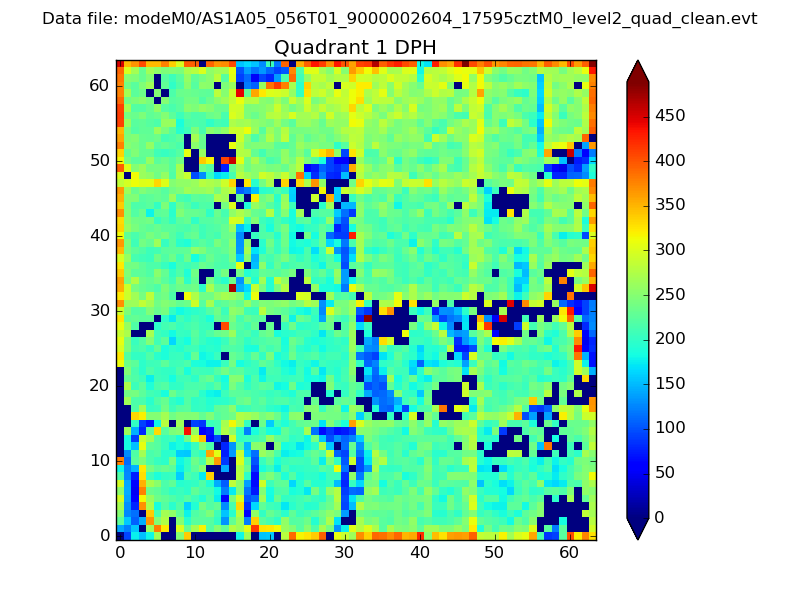 |
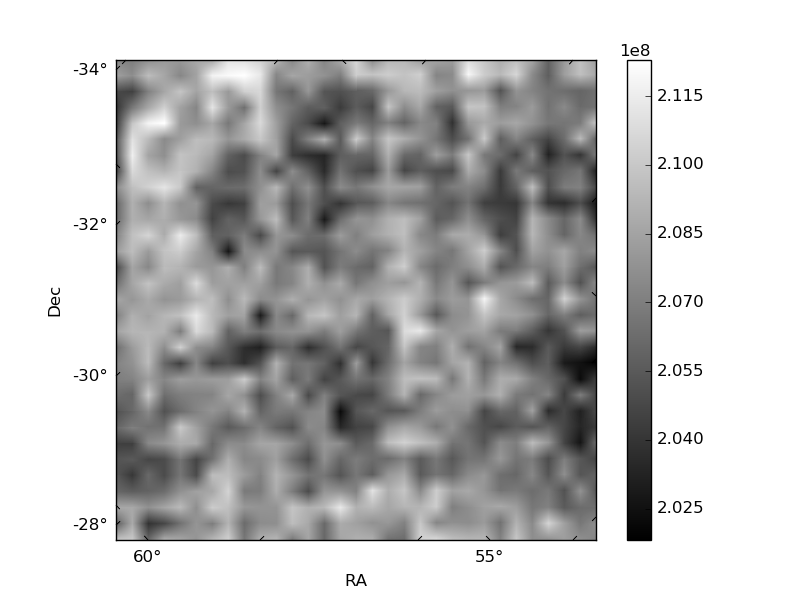
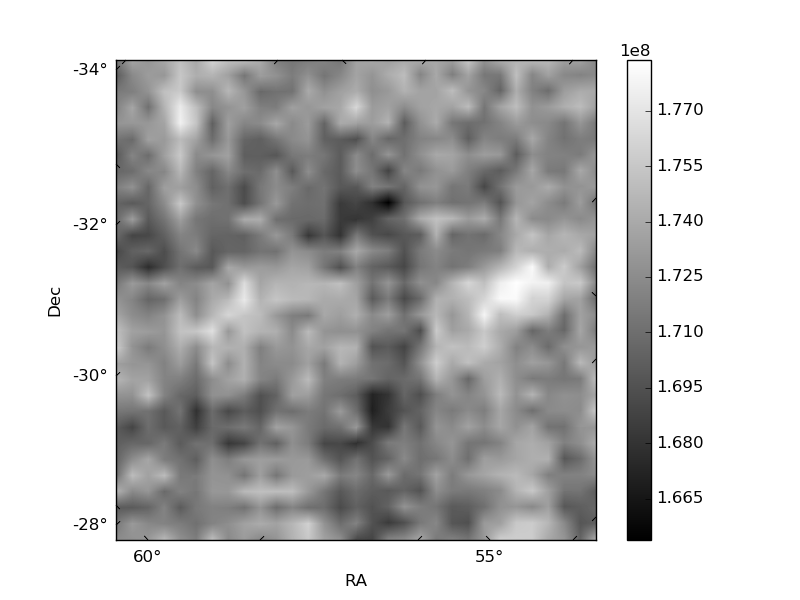
Quadrant B |
|---|---|---|---|
| Quadrant D |  |
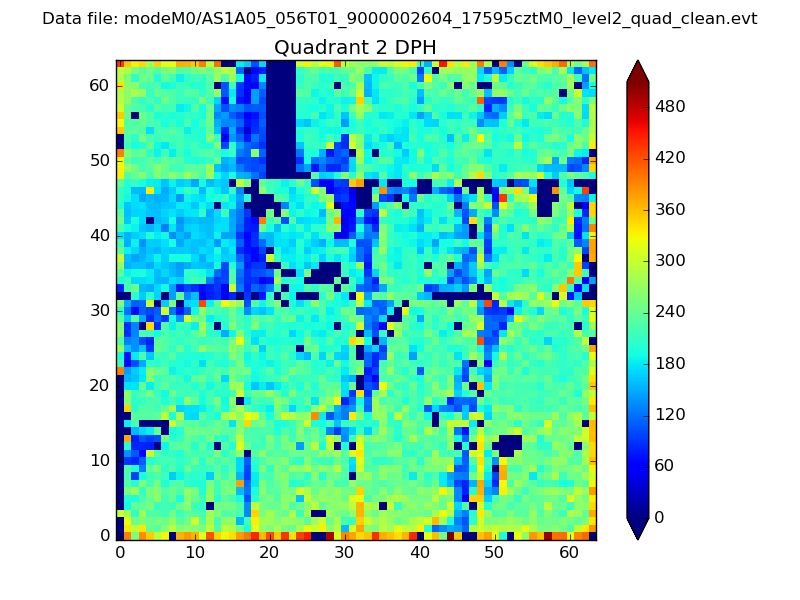 |
Quadrant C |
| Plot type | Count rate plots | Images |
|---|---|---|
| Comparison with Poisson distribution Blue bars denote a histogram of data divided into 1 sec bins. Red curve is a Poisson curve with rate = median count rate of data. |
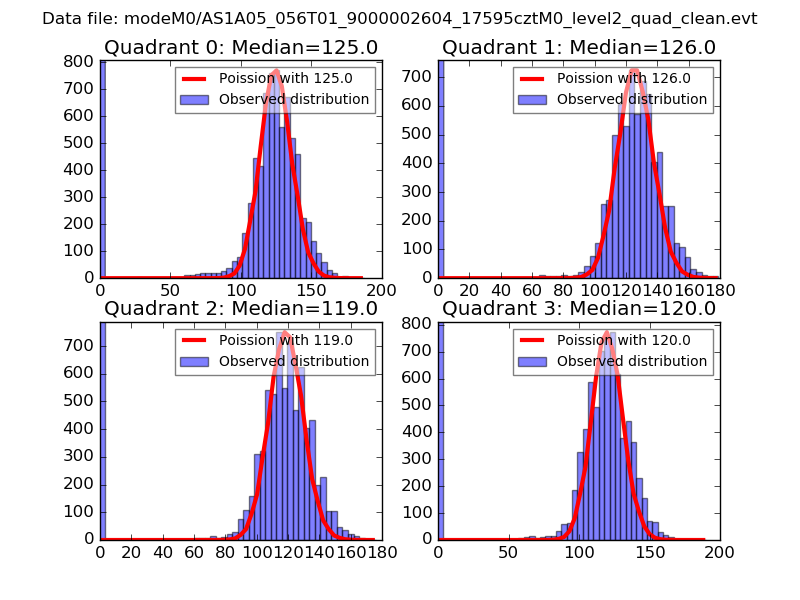 |
 |
| Quadrant-wise count rates Data is divided into 100 sec bins |
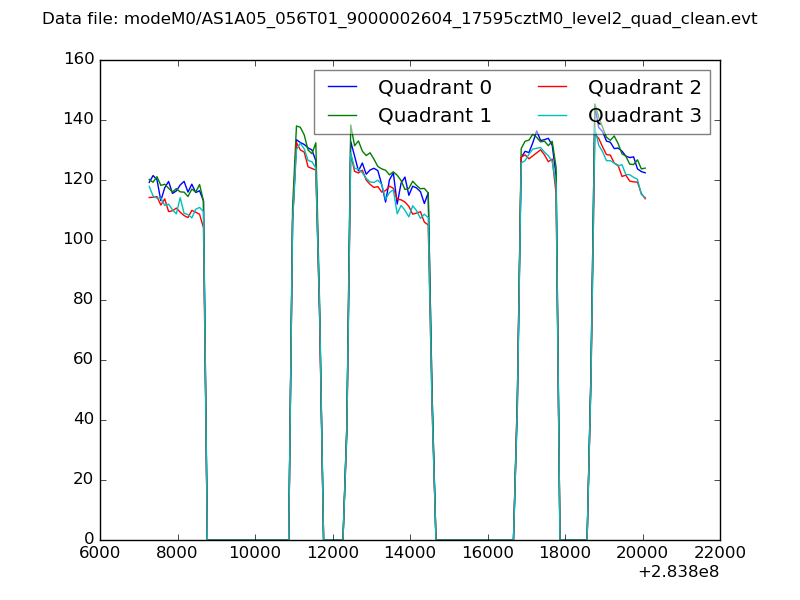 |
|
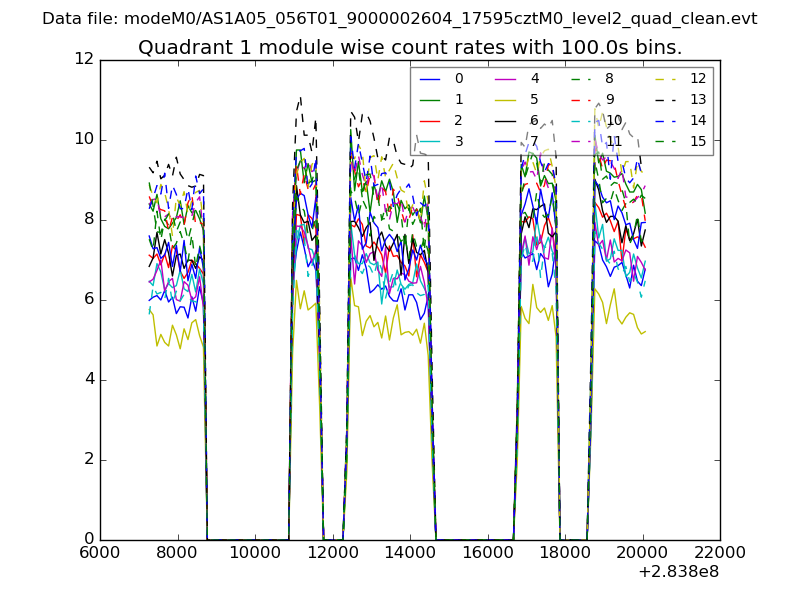
| Module-wise count rates for Quadrant A Data is divided into 100 sec bins |
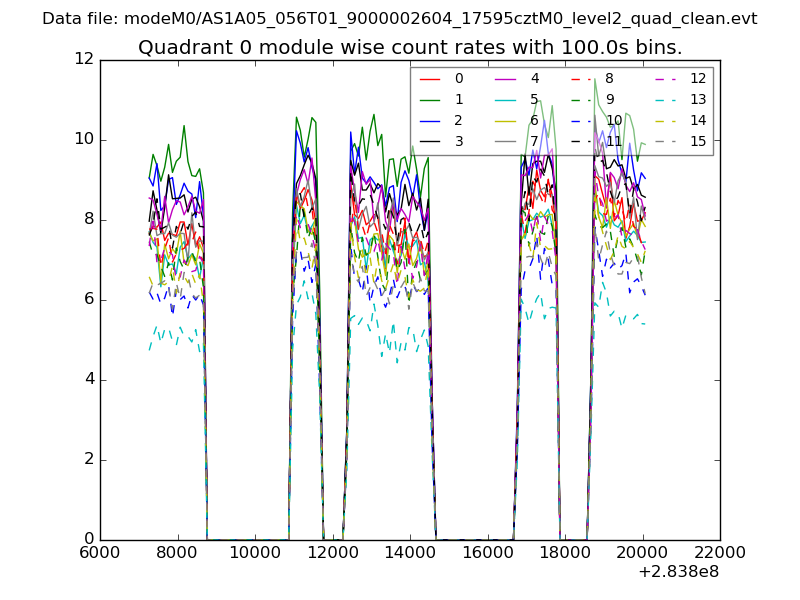 |
 |
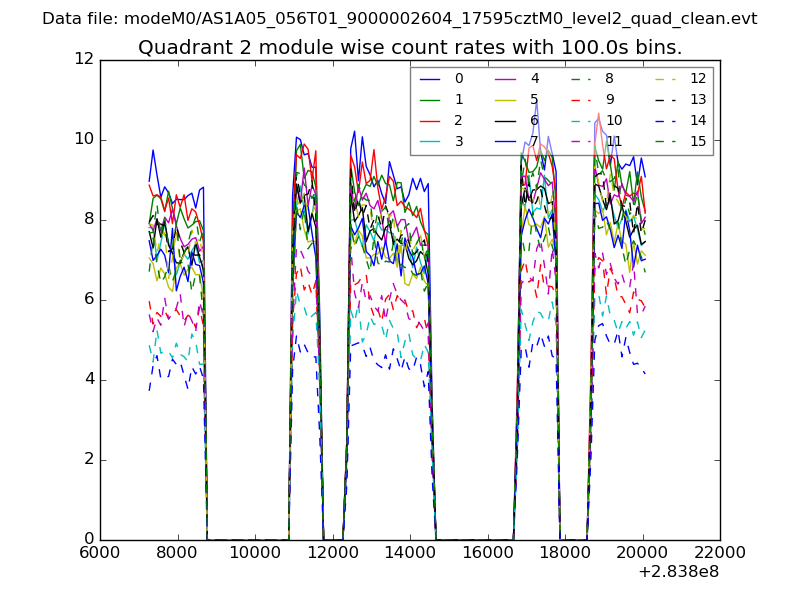
| Module-wise count rates for Quadrant B Data is divided into 100 sec bins |
 |
 |
| Module-wise count rates for Quadrant C Data is divided into 100 sec bins |
 |
 |
| Module-wise count rates for Quadrant D Data is divided into 100 sec bins |
 |
 |
| Parameter | Plot |
|---|---|
| CZT HV Monitor |  |
| D_VDD |  |
| Temperature 1 | 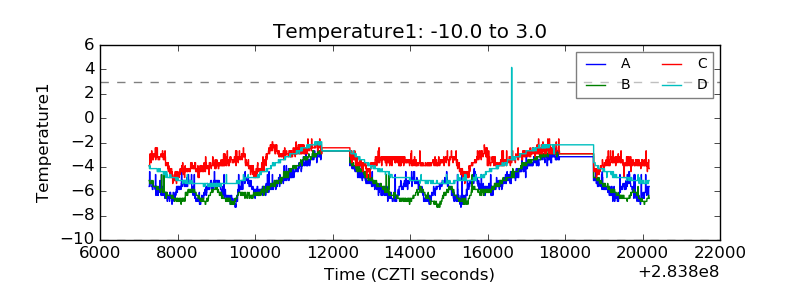 |
| Veto HV Monitor | 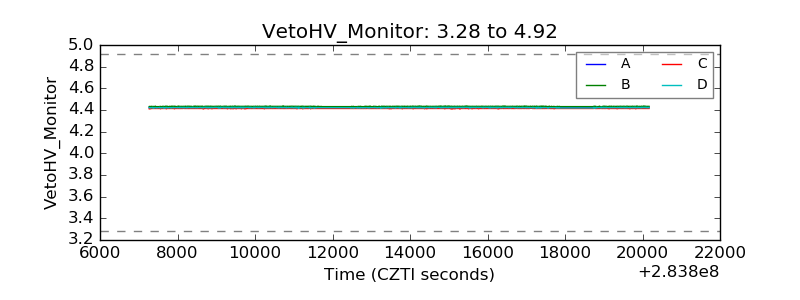 |
| Veto LLD |  |
| Alpha Counter | 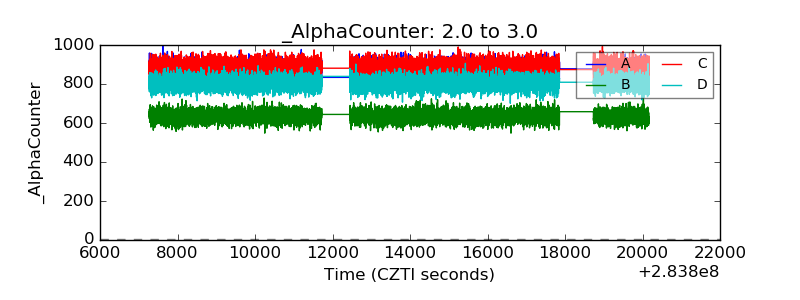 |
| _CPM_Rate | 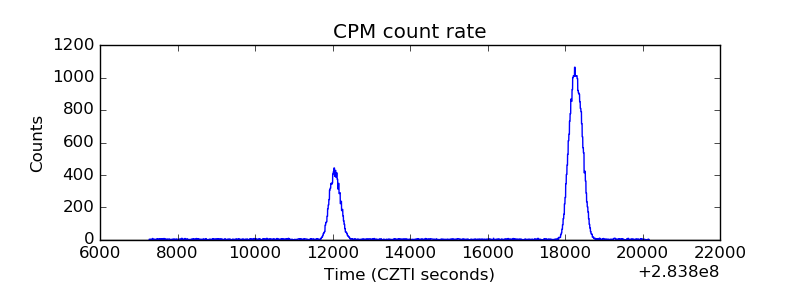 |
| CZT Counter | 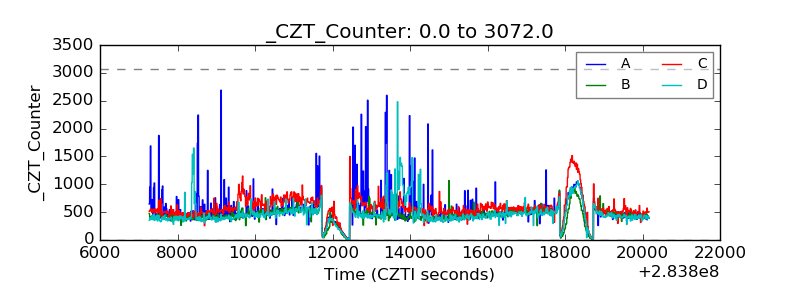 |
| +2.5 Volts monitor |  |
| +5 Volts monitor |  |
| _ROLL_ROT | 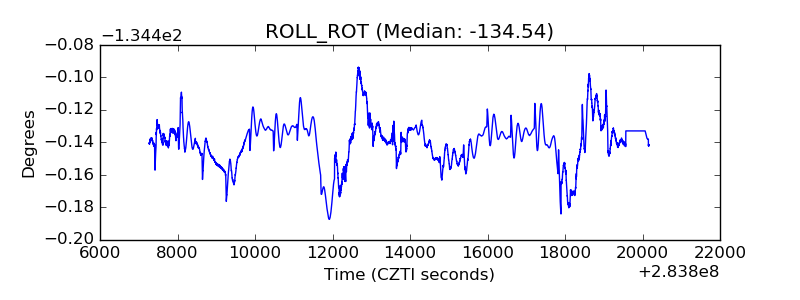 |
| _Roll_DEC | 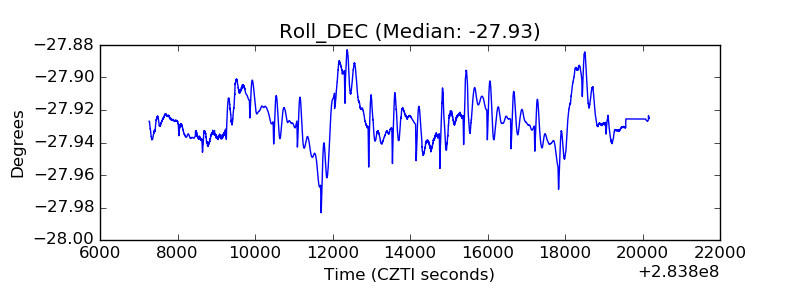 |
| _Roll_RA | 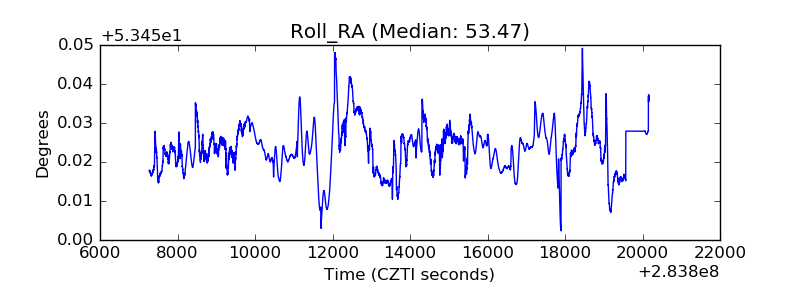 |
| Veto Counter | 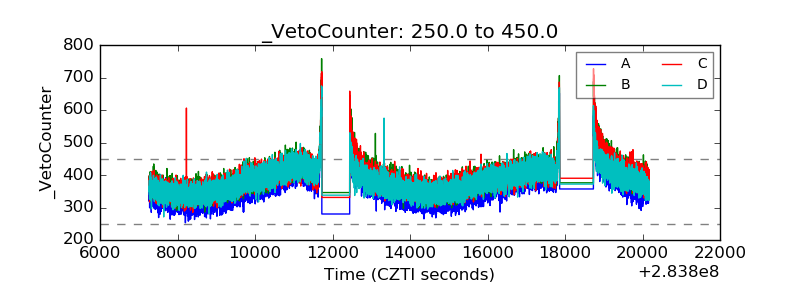 |