| Param | Original file | Final file |
|---|---|---|
| Filename | modeM0/AS1A05_056T01_9000002604_17596cztM0_level2.evt | modeM0/AS1A05_056T01_9000002604_17596cztM0_level2_quad_clean.evt |
| Size (bytes) | 445,443,840 | 91,365,120 |
| Size | 424.8 MB | 87.1 MB |
| Events in quadrant A | 3,155,864 | 585,177 |
| Events in quadrant B | 3,186,260 | 590,688 |
| Events in quadrant C | 3,680,207 | 561,089 |
| Events in quadrant D | 3,011,813 | 562,093 |
| Mode M9 | |||
|---|---|---|---|
| Quadrant | BADHDUFLAG | Total packets | Discarded packets |
| A | 0 | 19 | 0 |
| B | 0 | 19 | 0 |
| C | 0 | 19 | 0 |
| D | 0 | 19 | 0 |
| Mode M0 | |||
|---|---|---|---|
| Quadrant | BADHDUFLAG | Total packets | Discarded packets |
| A | 0 | 13746 | 2 |
| B | 0 | 13689 | 2 |
| C | 0 | 14841 | 2 |
| D | 0 | 13609 | 2 |
| Mode SS | |||
|---|---|---|---|
| Quadrant | BADHDUFLAG | Total packets | Discarded packets |
| A | 0 | 140 | 0 |
| B | 0 | 140 | 0 |
| C | 0 | 140 | 0 |
| D | 0 | 140 | 0 |
| Quadrant | Total seconds | Saturated seconds | Saturation percentage |
|---|---|---|---|
| A | 6703 | 16 | 0.238699% |
| B | 6703 | 26 | 0.387886% |
| C | 6703 | 56 | 0.835447% |
| D | 6704 | 10 | 0.149165% |
Noise dominated data is calculated using 1-second bins in cleaned event files. If a bin has >2000 counts, and if more than 50% of those come from <1% of pixels, then it is considered to be noise-dominated and hence unusable.
| Quadrant | # 1 sec bins | Bins with >0 counts | Bins with >2000 counts | High rate bins dominated by noise | Noise dominated (total time) | Noise dominated (detector-on time) | Marked lightcurve |
|---|---|---|---|---|---|---|---|
| A | 8633 | 6705 | 2 | 2 | 0.02% | 0.03% | 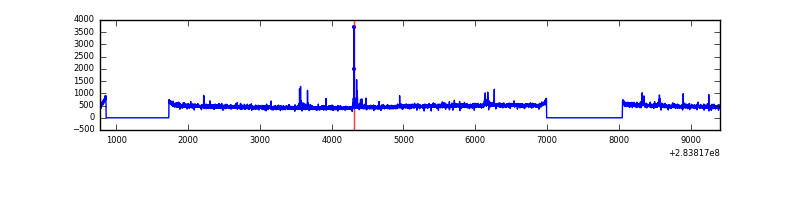 |
| B | 8633 | 6705 | 0 | 0 | 0.00% | 0.00% | 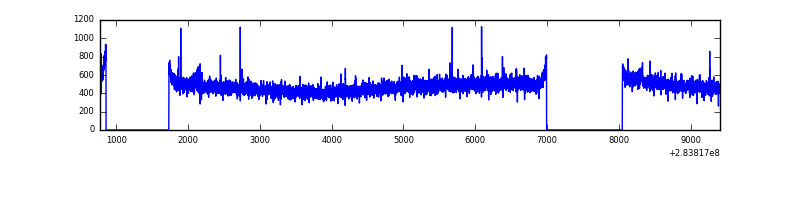 |
| C | 8633 | 6705 | 0 | 0 | 0.00% | 0.00% | 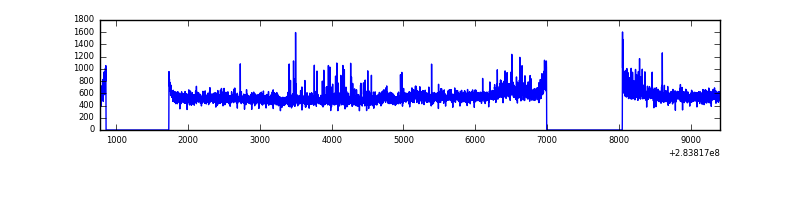 |
| D | 8634 | 6706 | 1 | 1 | 0.01% | 0.01% | 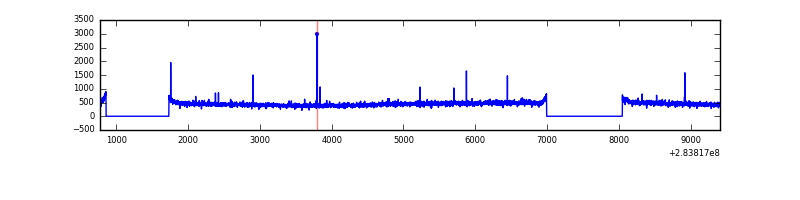 |
Top three noisy pixels from each quadrant. If the there are fewer than three noisy pixels in the level2.evt file, extra rows are filled as -1
| Pixel properties | Quadrant properties | ||||||
|---|---|---|---|---|---|---|---|
| Quadrant | DetID | PixID | Counts | Sigma | Mean | Median | Sigma |
| A | 14 | 237 | 55485 | 335.2 | 806 | 788 | 163.2 |
| A | 0 | 226 | 6972 | 37.89 | 806 | 788 | 163.2 |
| A | 3 | 137 | 6047 | 32.23 | 806 | 788 | 163.2 |
| B | 12 | 111 | 18848 | 116.54 | 810 | 790 | 155.0 |
| B | 11 | 111 | 16635 | 102.25 | 810 | 790 | 155.0 |
| B | 14 | 111 | 14590 | 89.06 | 810 | 790 | 155.0 |
| C | 3 | 233 | 450635 | 2445.75 | 780 | 785 | 183.9 |
| C | 14 | 238 | 121479 | 656.19 | 780 | 785 | 183.9 |
| C | 5 | 218 | 58072 | 311.46 | 780 | 785 | 183.9 |
| D | 2 | 234 | 25136 | 125.84 | 788 | 764 | 193.7 |
| D | 1 | 52 | 13506 | 65.79 | 788 | 764 | 193.7 |
| D | 2 | 14 | 10646 | 51.02 | 788 | 764 | 193.7 |
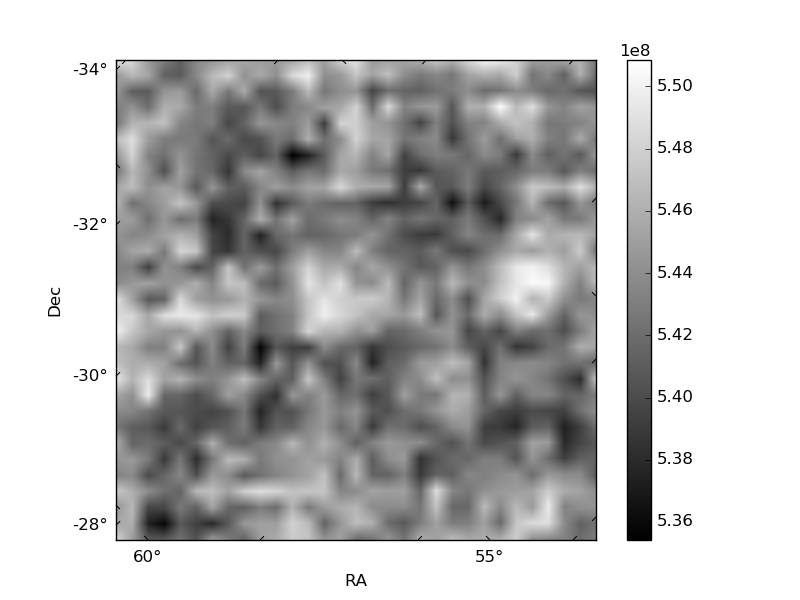
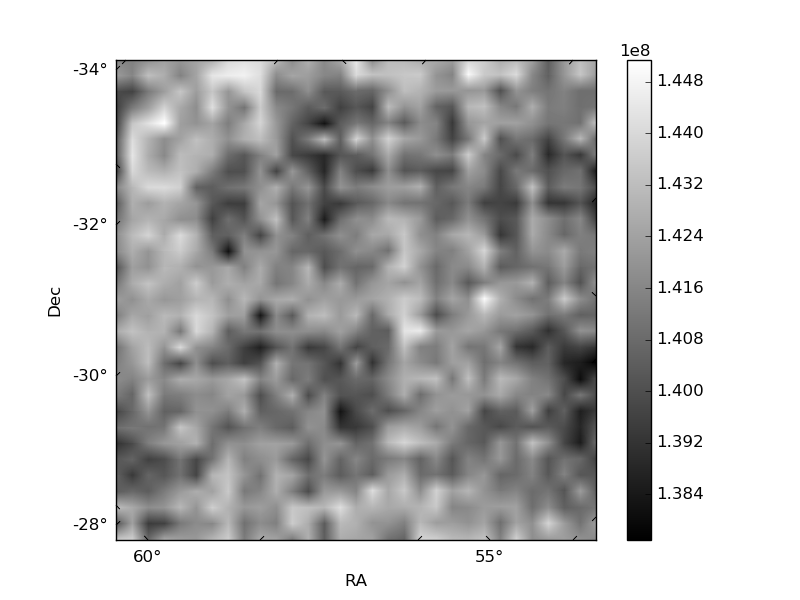
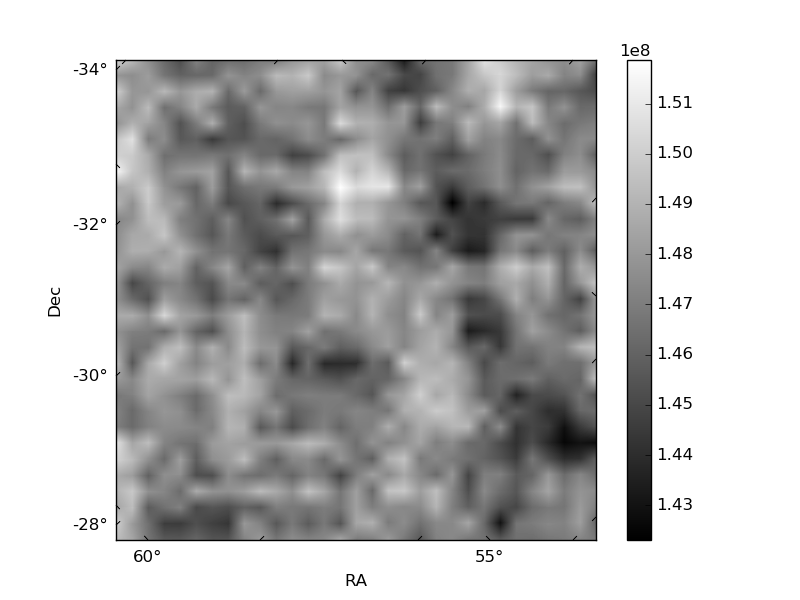
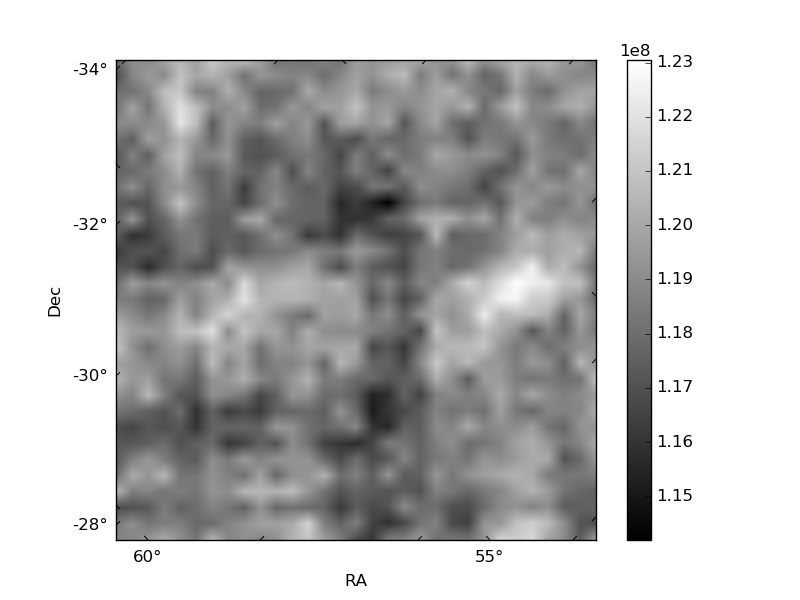
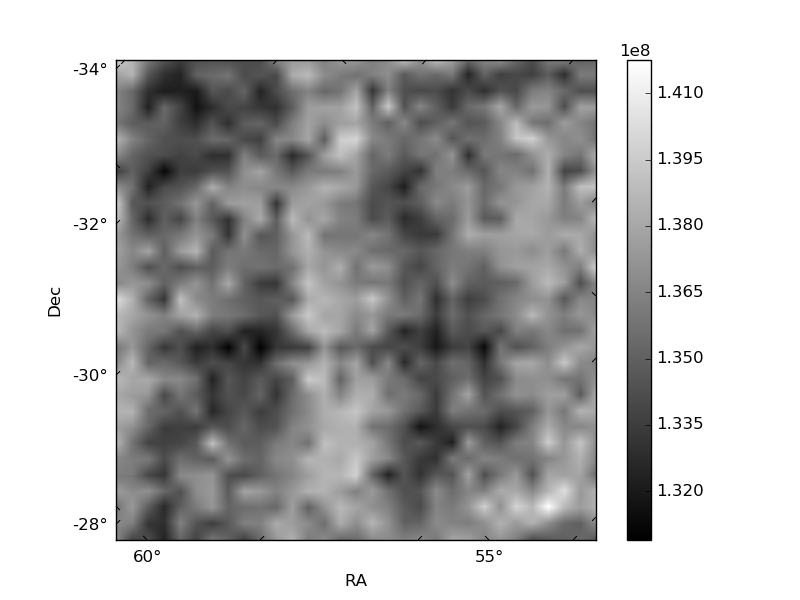
Histogram calculated using DETX and DETY for each event in the final _common_clean file
| Quadrant A | 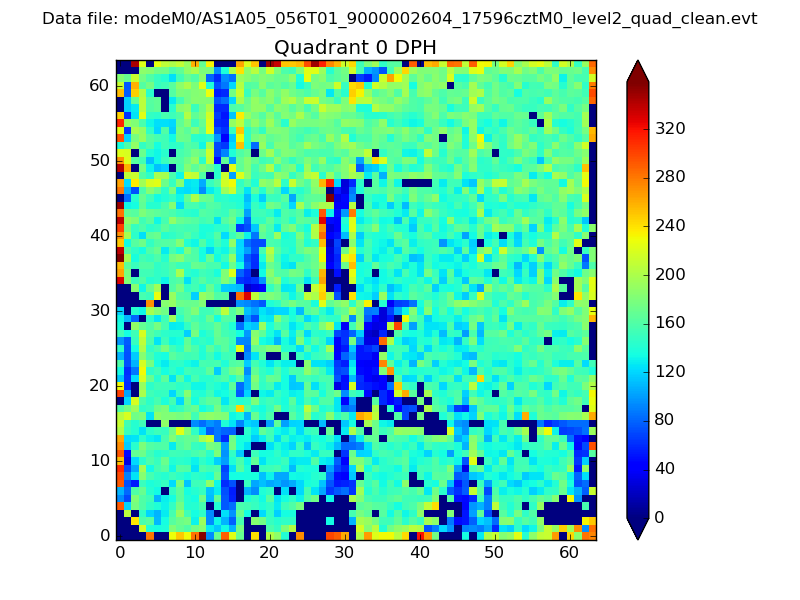 |
 |
Quadrant B |
|---|---|---|---|
| Quadrant D | 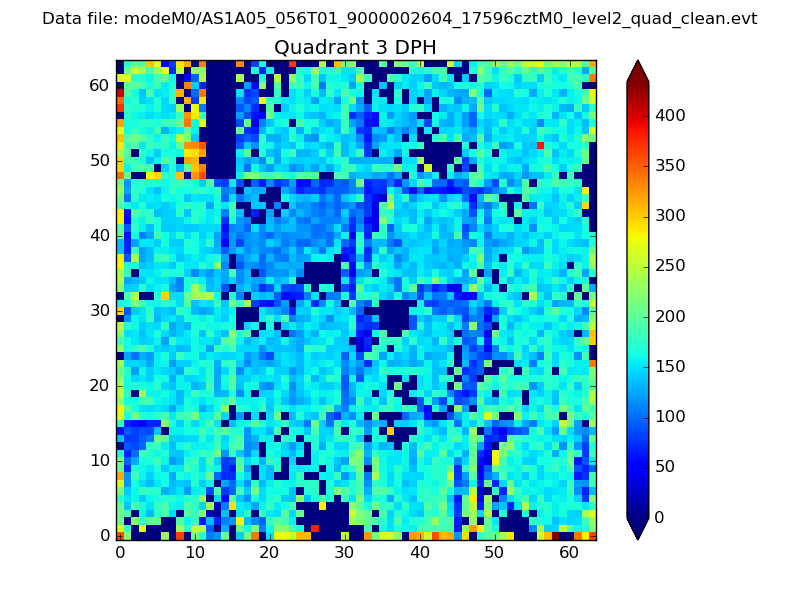 |
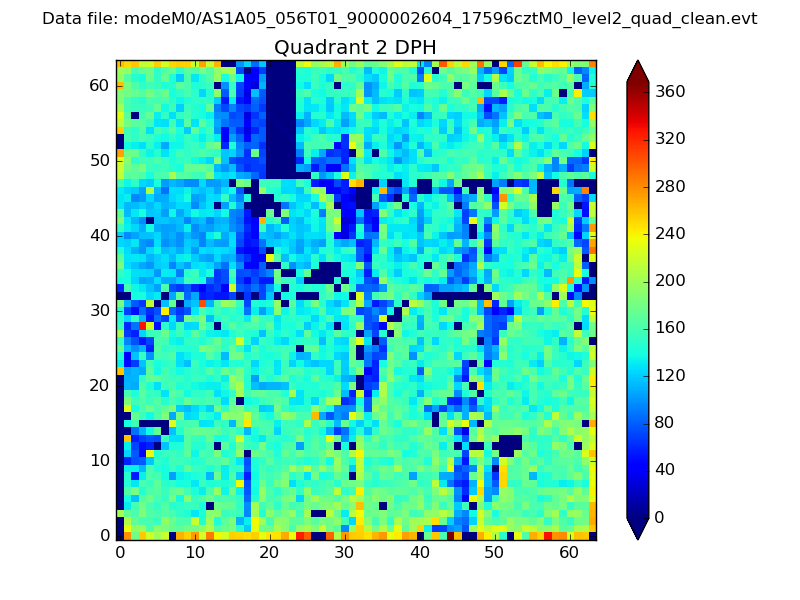 |
Quadrant C |
| Plot type | Count rate plots | Images |
|---|---|---|
| Comparison with Poisson distribution Blue bars denote a histogram of data divided into 1 sec bins. Red curve is a Poisson curve with rate = median count rate of data. |
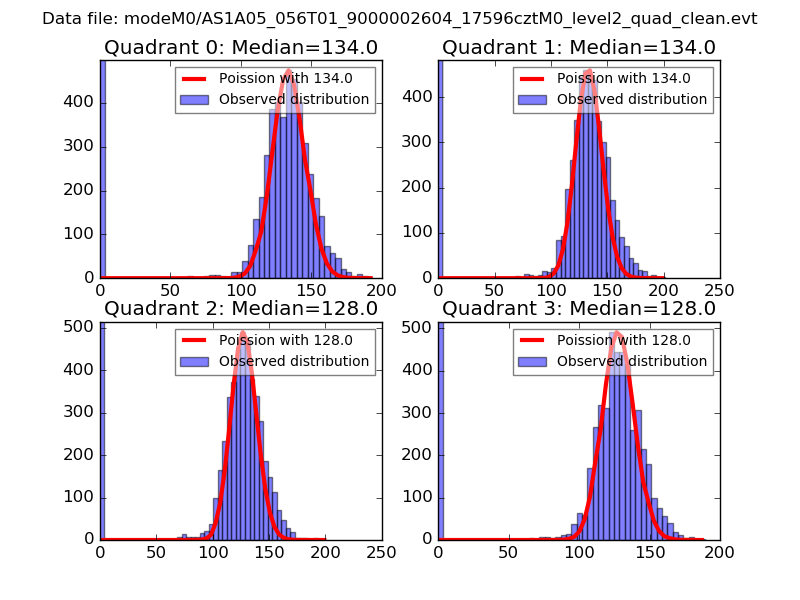 |
 |
| Quadrant-wise count rates Data is divided into 100 sec bins |
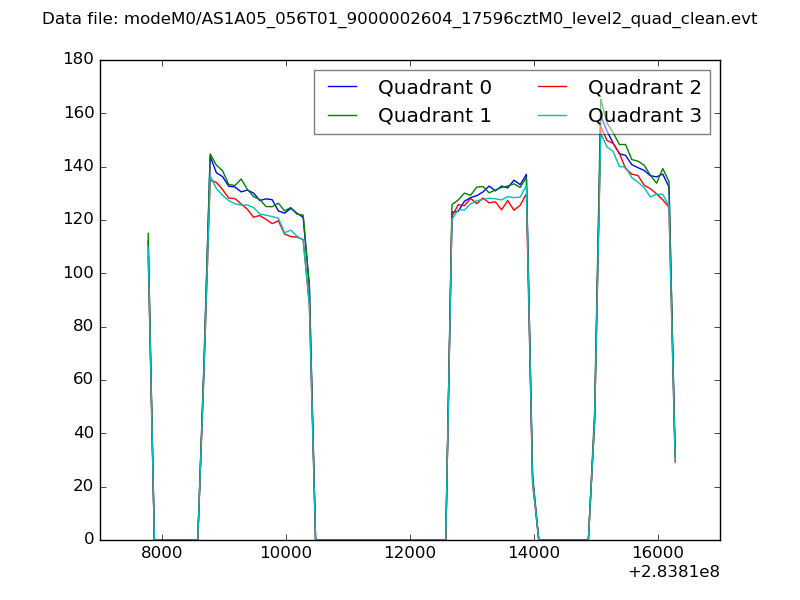 |
|
| Module-wise count rates for Quadrant A Data is divided into 100 sec bins |
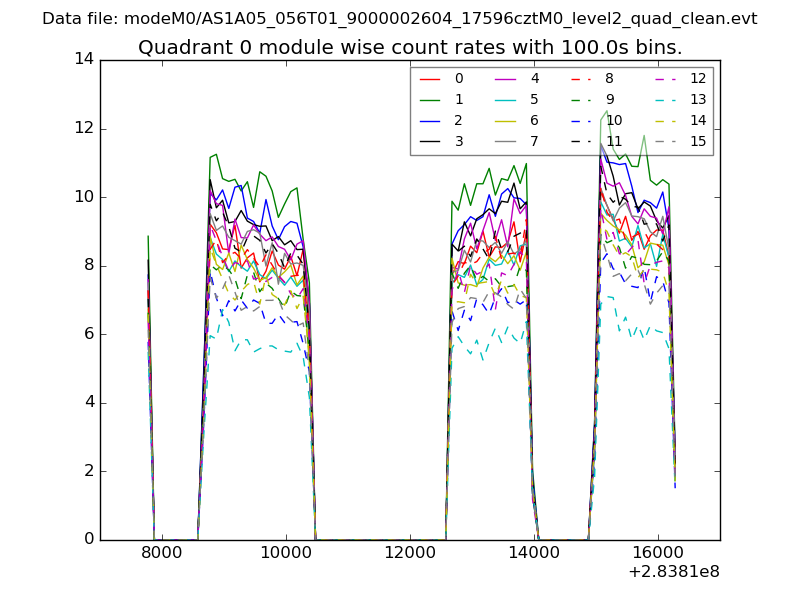 |
 |
| Module-wise count rates for Quadrant B Data is divided into 100 sec bins |
 |
 |
| Module-wise count rates for Quadrant C Data is divided into 100 sec bins |
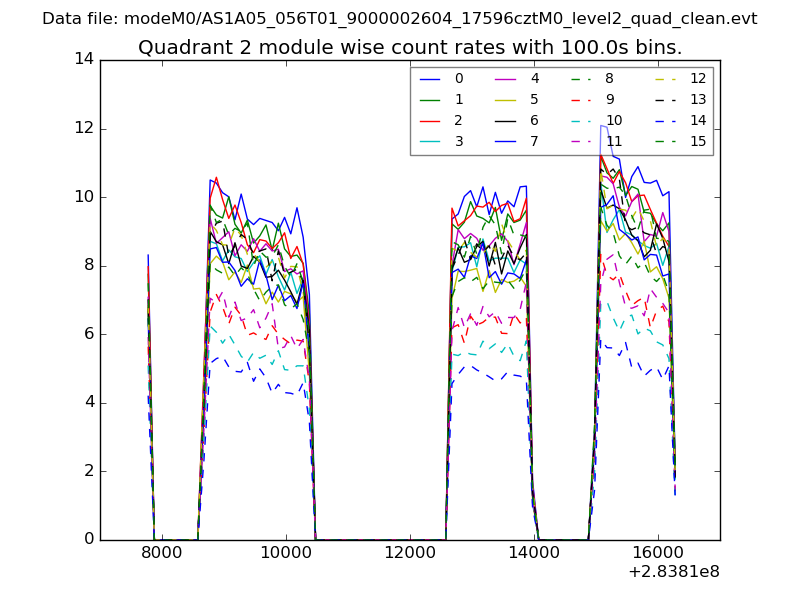 |
 |
| Module-wise count rates for Quadrant D Data is divided into 100 sec bins |
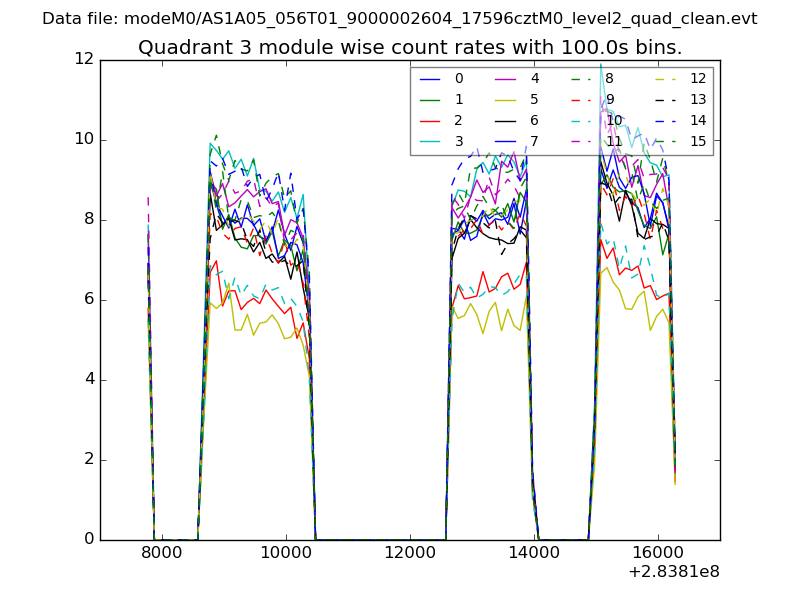 |
 |
| Parameter | Plot |
|---|---|
| CZT HV Monitor |  |
| D_VDD | 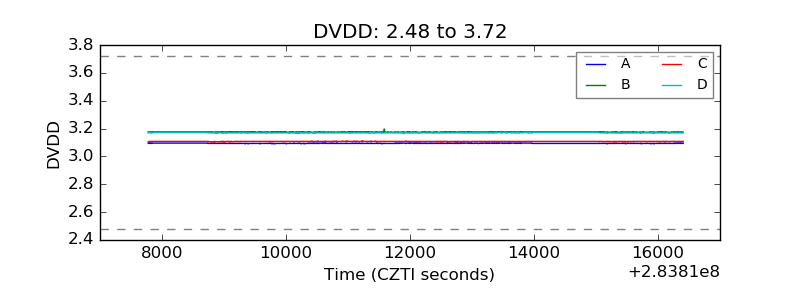 |
| Temperature 1 | 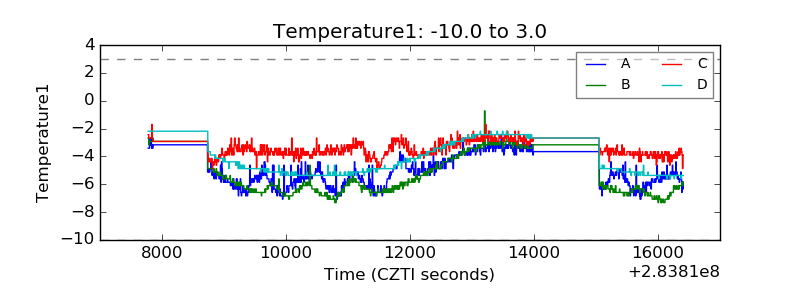 |
| Veto HV Monitor | 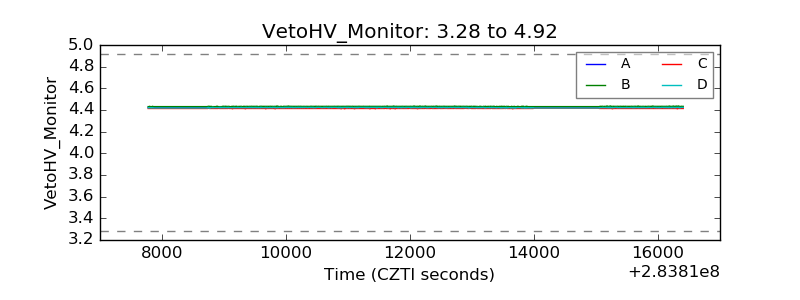 |
| Veto LLD | 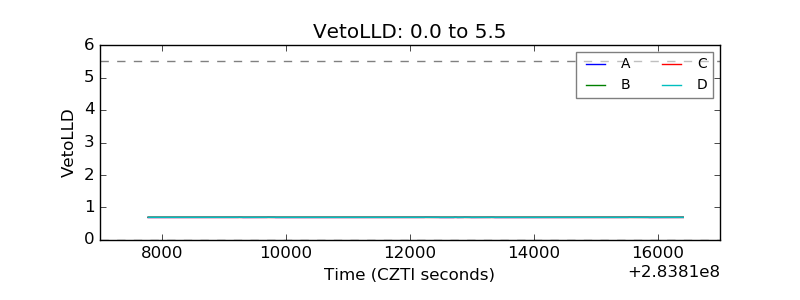 |
| Alpha Counter | 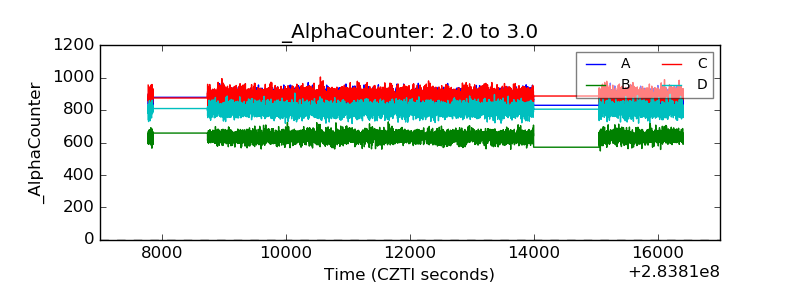 |
| _CPM_Rate | 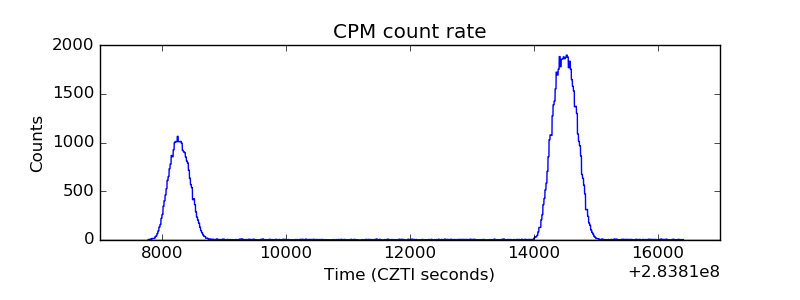 |
| CZT Counter | 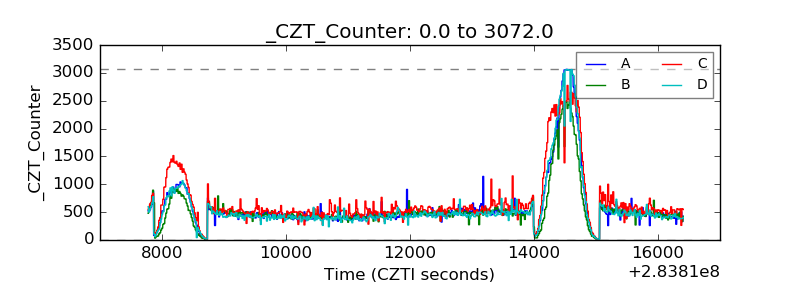 |
| +2.5 Volts monitor |  |
| +5 Volts monitor | 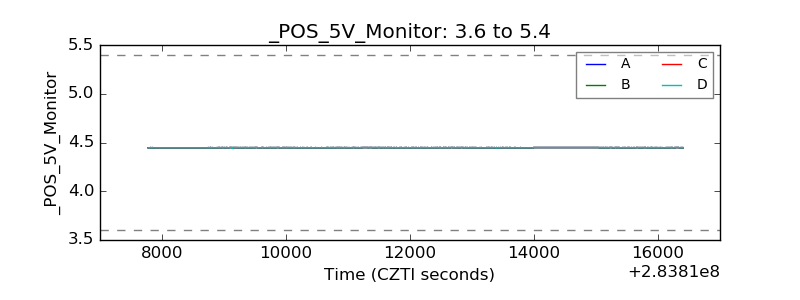 |
| _ROLL_ROT | 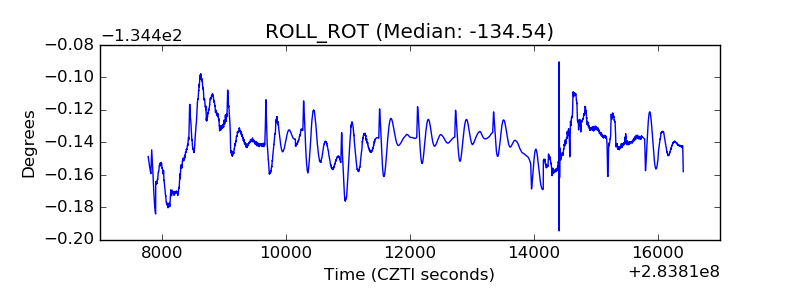 |
| _Roll_DEC | 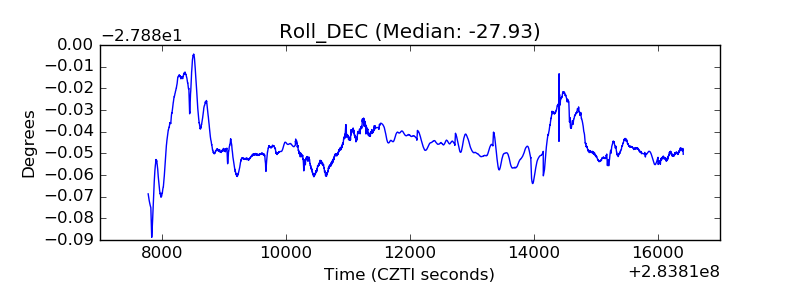 |
| _Roll_RA | 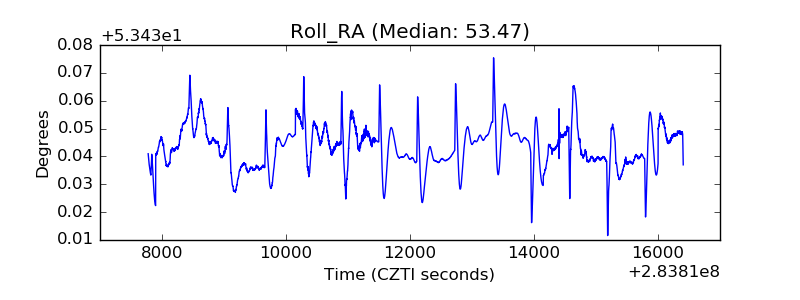 |
| Veto Counter | 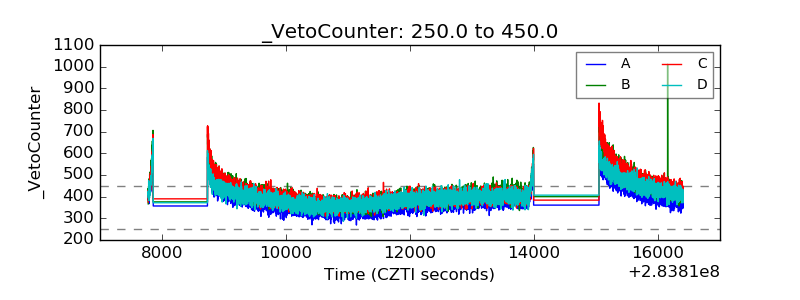 |