| Param | Original file | Final file |
|---|---|---|
| Filename | modeM0/AS1A05_056T01_9000002604_17598cztM0_level2.evt | modeM0/AS1A05_056T01_9000002604_17598cztM0_level2_quad_clean.evt |
| Size (bytes) | 460,126,080 | 83,949,120 |
| Size | 438.8 MB | 80.1 MB |
| Events in quadrant A | 3,492,139 | 518,972 |
| Events in quadrant B | 3,163,077 | 542,140 |
| Events in quadrant C | 3,779,938 | 518,207 |
| Events in quadrant D | 3,061,198 | 512,390 |
| Mode M9 | |||
|---|---|---|---|
| Quadrant | BADHDUFLAG | Total packets | Discarded packets |
| A | 0 | 15 | 0 |
| B | 0 | 16 | 0 |
| C | 0 | 16 | 0 |
| D | 0 | 16 | 0 |
| Mode M0 | |||
|---|---|---|---|
| Quadrant | BADHDUFLAG | Total packets | Discarded packets |
| A | 0 | 14472 | 2 |
| B | 0 | 13353 | 3 |
| C | 0 | 15200 | 2 |
| D | 0 | 13368 | 2 |
| Mode SS | |||
|---|---|---|---|
| Quadrant | BADHDUFLAG | Total packets | Discarded packets |
| A | 0 | 130 | 0 |
| B | 0 | 130 | 0 |
| C | 0 | 130 | 0 |
| D | 0 | 130 | 0 |
| Quadrant | Total seconds | Saturated seconds | Saturation percentage |
|---|---|---|---|
| A | 6459 | 147 | 2.275894% |
| B | 6458 | 22 | 0.340663% |
| C | 6458 | 46 | 0.712295% |
| D | 6458 | 7 | 0.108393% |
Noise dominated data is calculated using 1-second bins in cleaned event files. If a bin has >2000 counts, and if more than 50% of those come from <1% of pixels, then it is considered to be noise-dominated and hence unusable.
| Quadrant | # 1 sec bins | Bins with >0 counts | Bins with >2000 counts | High rate bins dominated by noise | Noise dominated (total time) | Noise dominated (detector-on time) | Marked lightcurve |
|---|---|---|---|---|---|---|---|
| A | 7619 | 6460 | 113 | 113 | 1.48% | 1.75% | 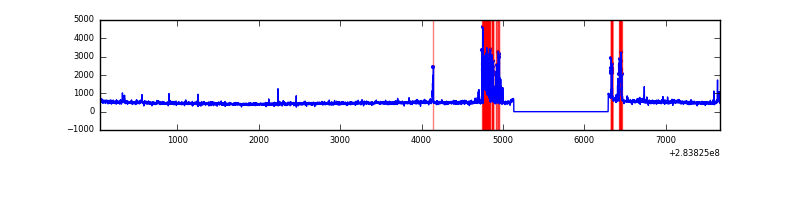 |
| B | 7618 | 6459 | 4 | 4 | 0.05% | 0.06% | 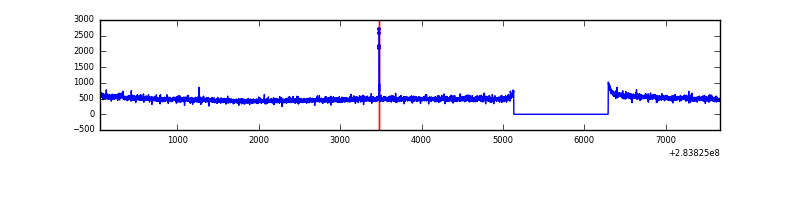 |
| C | 7618 | 6459 | 0 | 0 | 0.00% | 0.00% | 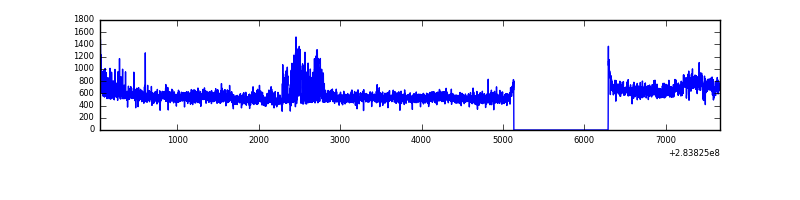 |
| D | 7618 | 6459 | 0 | 0 | 0.00% | 0.00% | 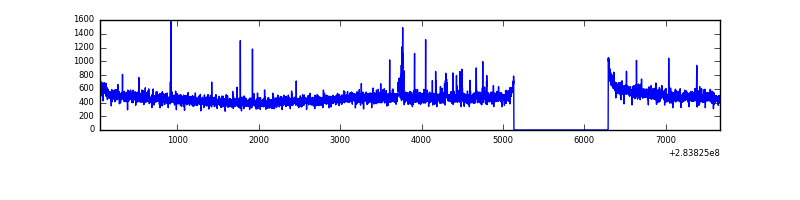 |
Top three noisy pixels from each quadrant. If the there are fewer than three noisy pixels in the level2.evt file, extra rows are filled as -1
| Pixel properties | Quadrant properties | ||||||
|---|---|---|---|---|---|---|---|
| Quadrant | DetID | PixID | Counts | Sigma | Mean | Median | Sigma |
| A | 14 | 237 | 449725 | 2836.16 | 791 | 776 | 158.3 |
| A | 0 | 226 | 6630 | 36.98 | 791 | 776 | 158.3 |
| A | 3 | 137 | 5845 | 32.02 | 791 | 776 | 158.3 |
| B | 12 | 111 | 18547 | 116.66 | 805 | 786 | 152.2 |
| B | 11 | 111 | 16091 | 100.53 | 805 | 786 | 152.2 |
| B | 14 | 111 | 14197 | 88.09 | 805 | 786 | 152.2 |
| C | 3 | 233 | 540704 | 2960.48 | 782 | 787 | 182.4 |
| C | 14 | 238 | 121074 | 659.56 | 782 | 787 | 182.4 |
| C | 5 | 218 | 61799 | 334.54 | 782 | 787 | 182.4 |
| D | 4 | 239 | 38115 | 195.9 | 787 | 767 | 190.6 |
| D | 1 | 52 | 32077 | 164.23 | 787 | 767 | 190.6 |
| D | 2 | 234 | 23300 | 118.19 | 787 | 767 | 190.6 |
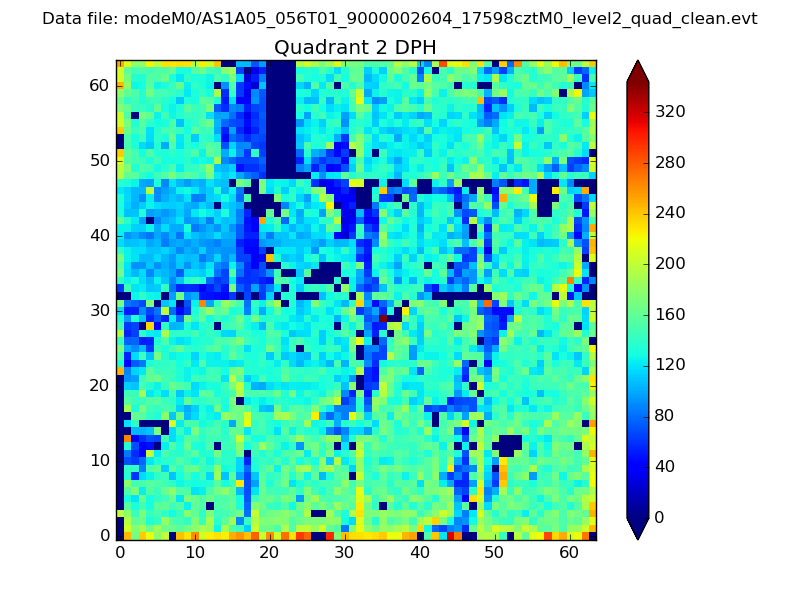
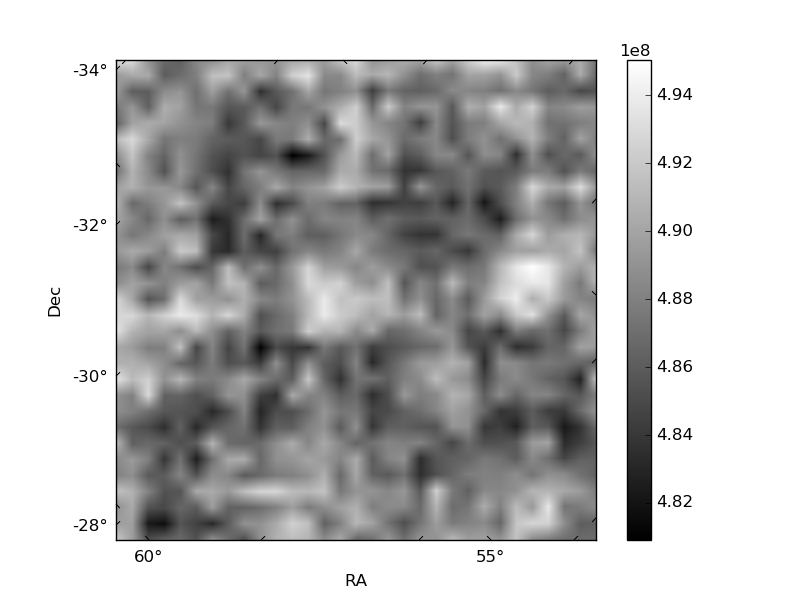
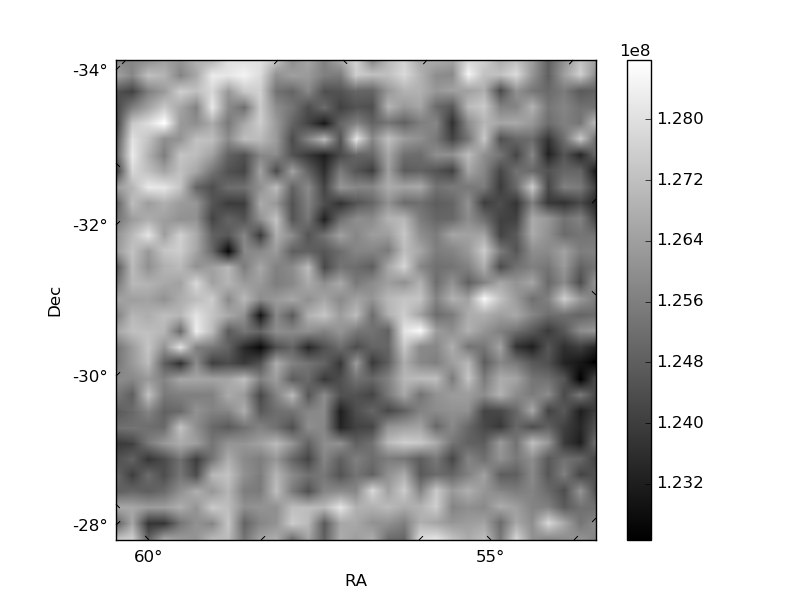
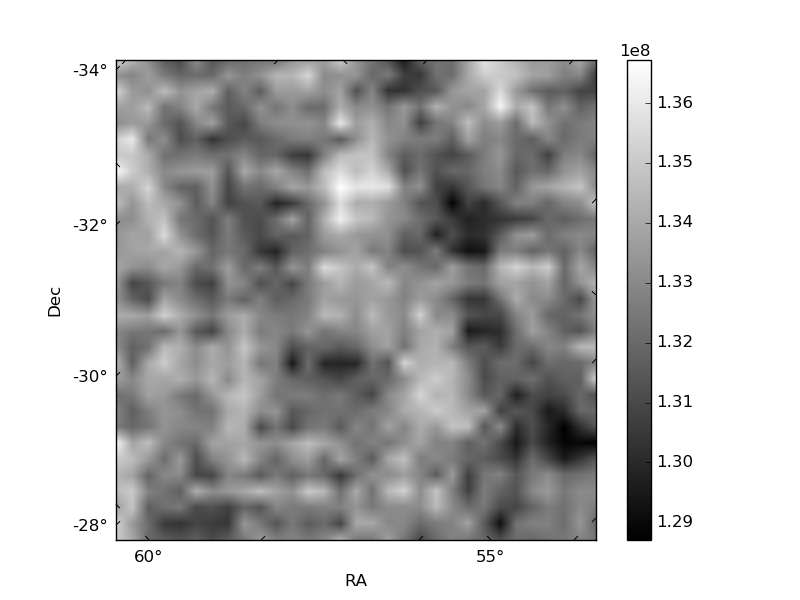
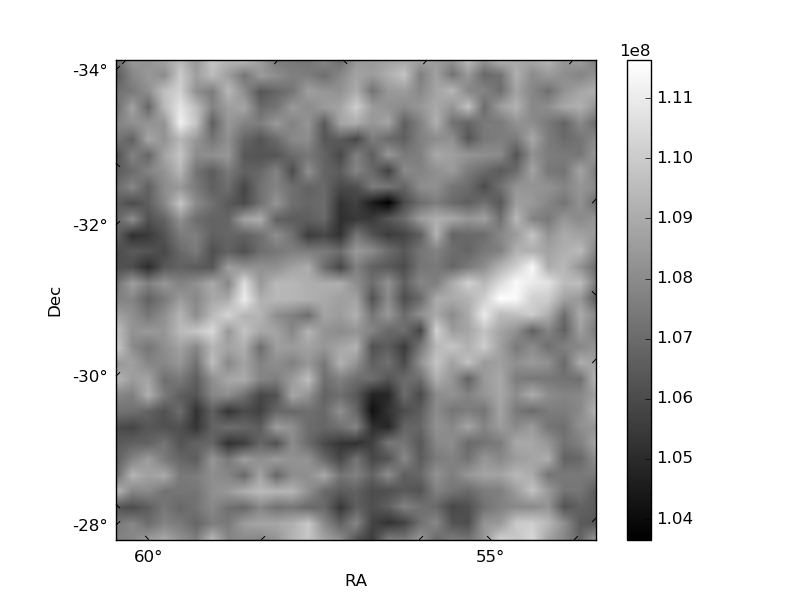
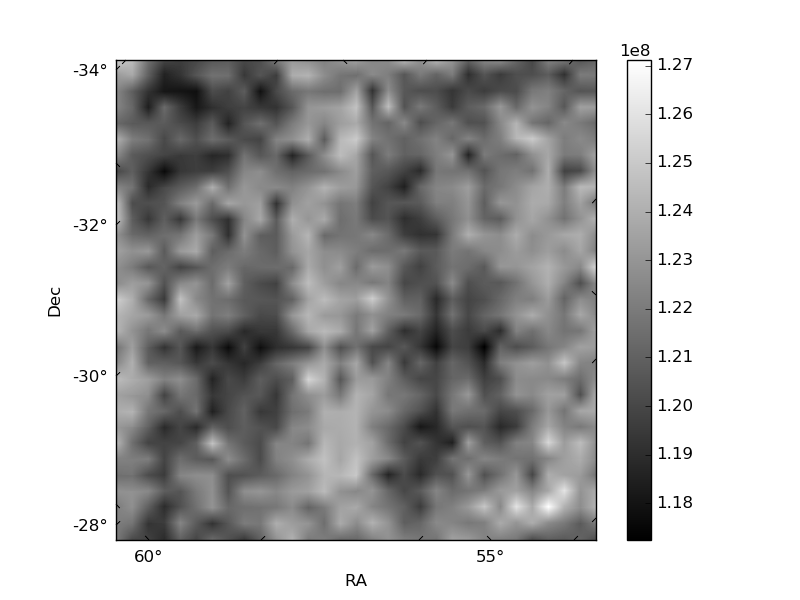
Histogram calculated using DETX and DETY for each event in the final _common_clean file
| Quadrant A | 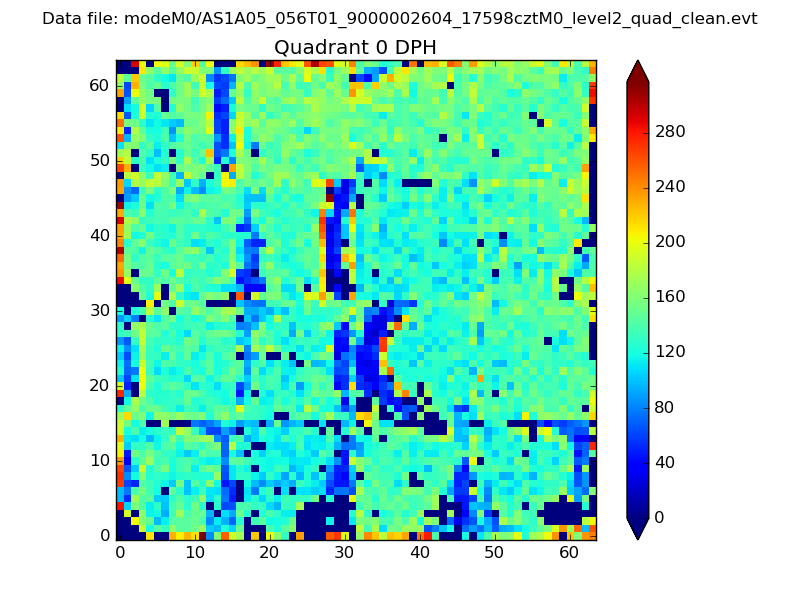 |
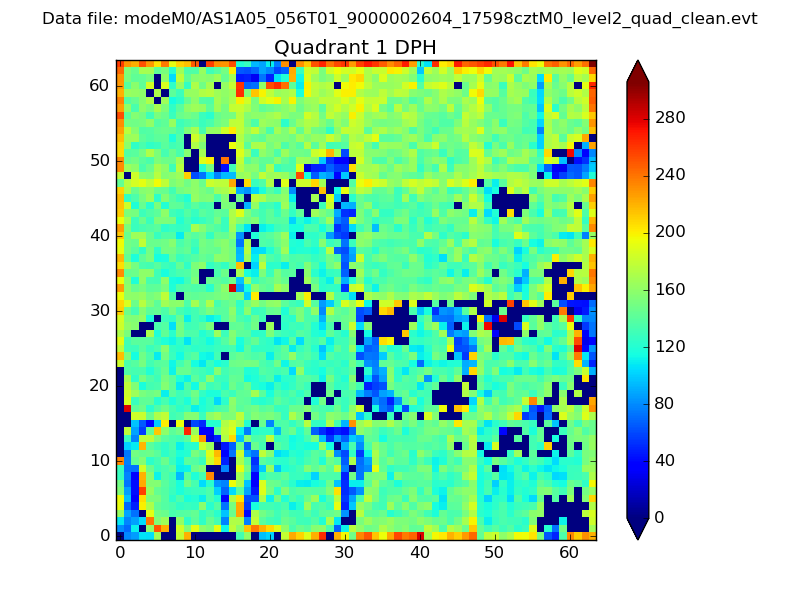 |
Quadrant B |
|---|---|---|---|
| Quadrant D | 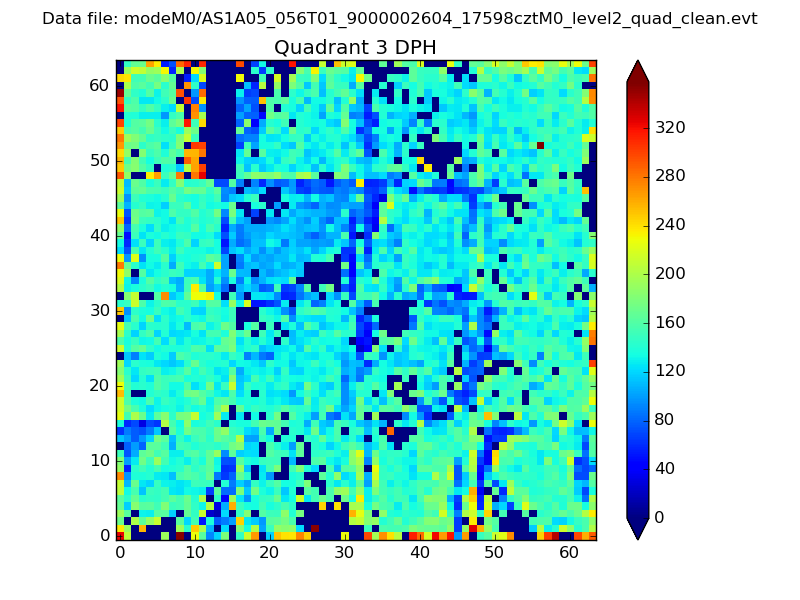 |
 |
Quadrant C |
| Plot type | Count rate plots | Images |
|---|---|---|
| Comparison with Poisson distribution Blue bars denote a histogram of data divided into 1 sec bins. Red curve is a Poisson curve with rate = median count rate of data. |
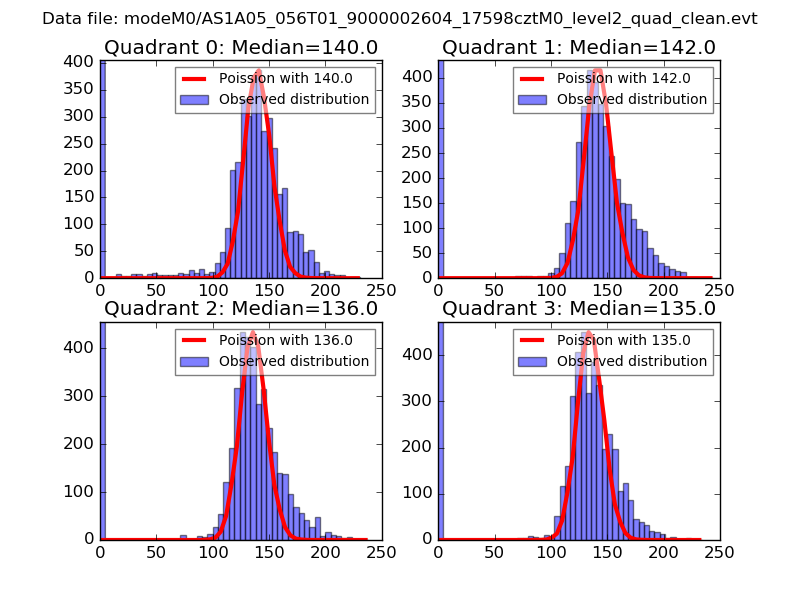 |
 |
| Quadrant-wise count rates Data is divided into 100 sec bins |
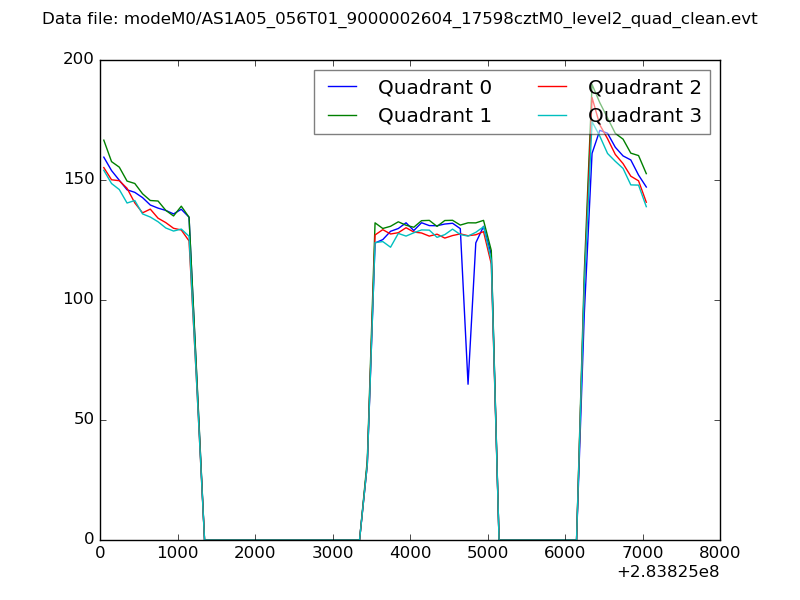 |
|
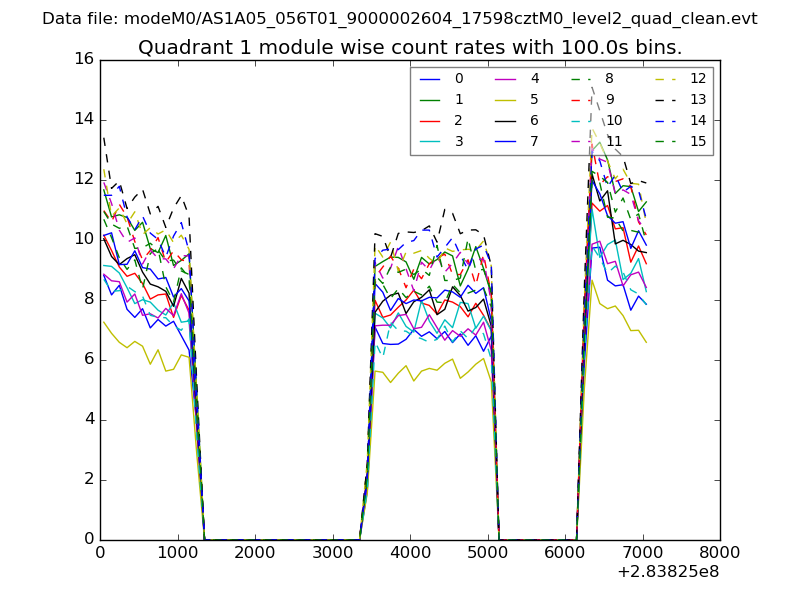
| Module-wise count rates for Quadrant A Data is divided into 100 sec bins |
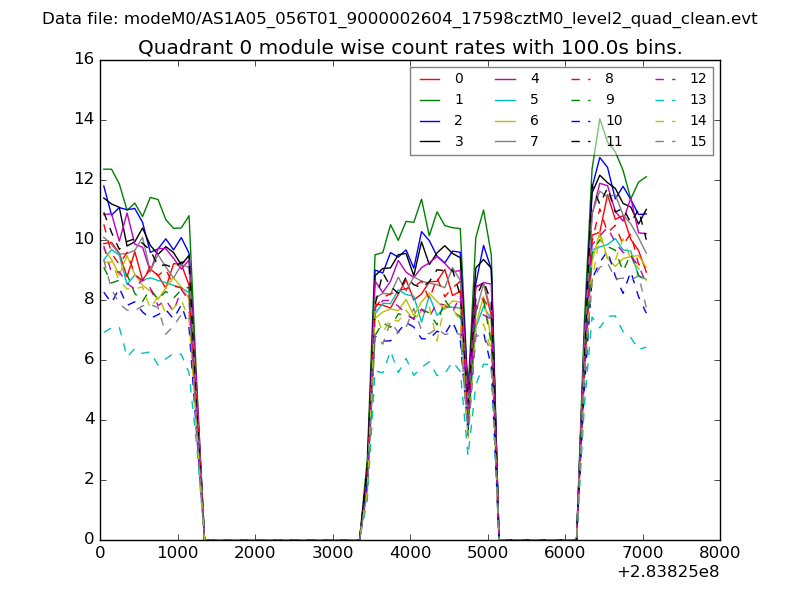 |
 |
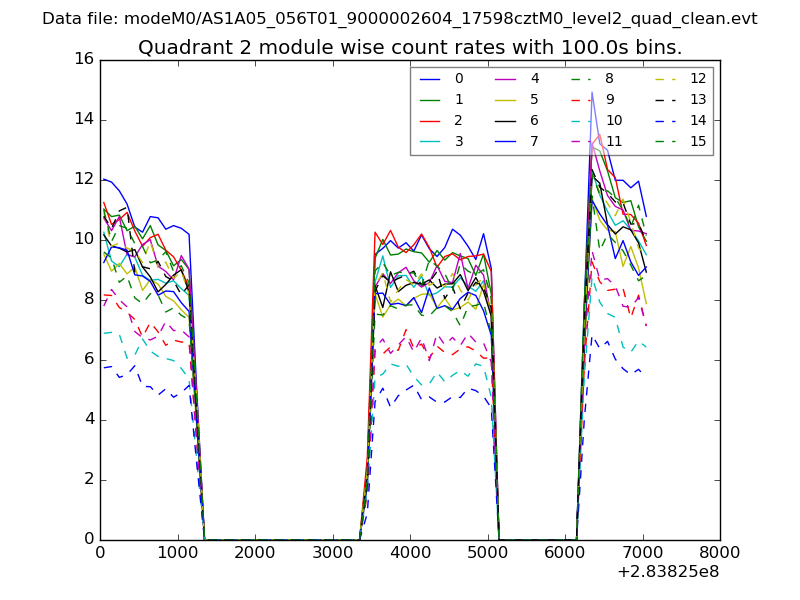
| Module-wise count rates for Quadrant B Data is divided into 100 sec bins |
 |
 |
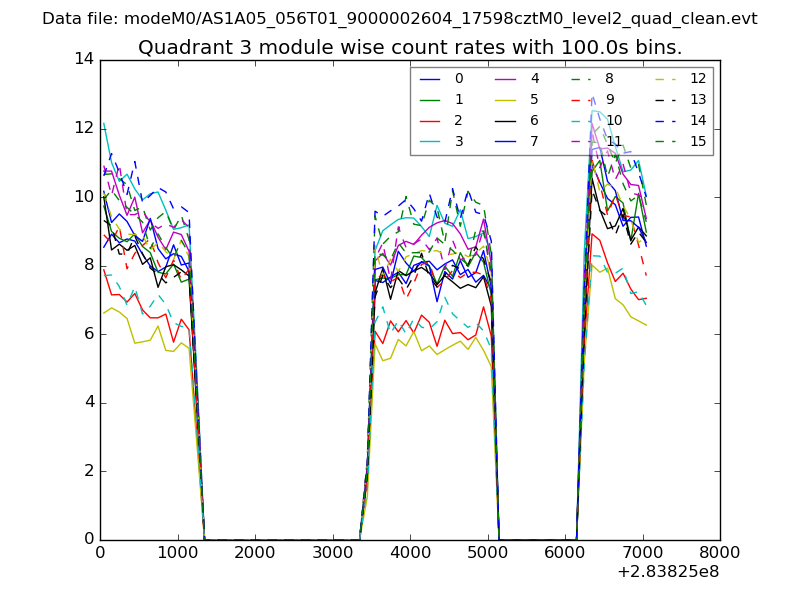
| Module-wise count rates for Quadrant C Data is divided into 100 sec bins |
 |
 |
| Module-wise count rates for Quadrant D Data is divided into 100 sec bins |
 |
 |
| Parameter | Plot |
|---|---|
| CZT HV Monitor | 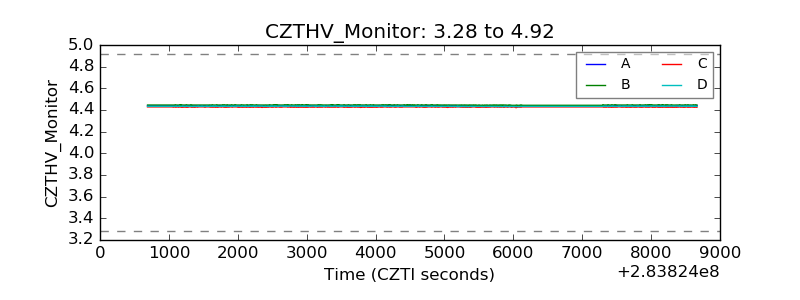 |
| D_VDD | 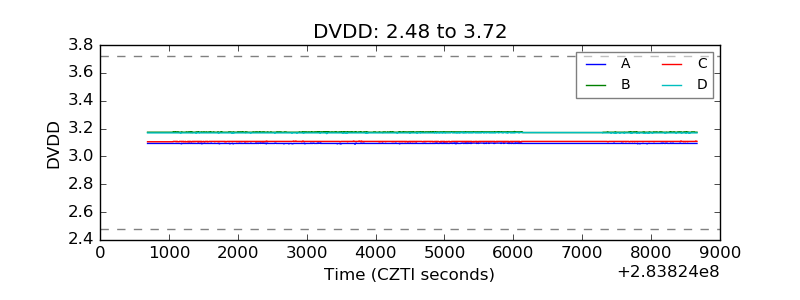 |
| Temperature 1 | 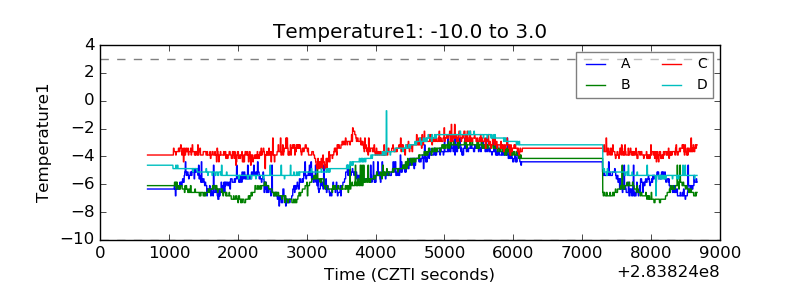 |
| Veto HV Monitor |  |
| Veto LLD |  |
| Alpha Counter | 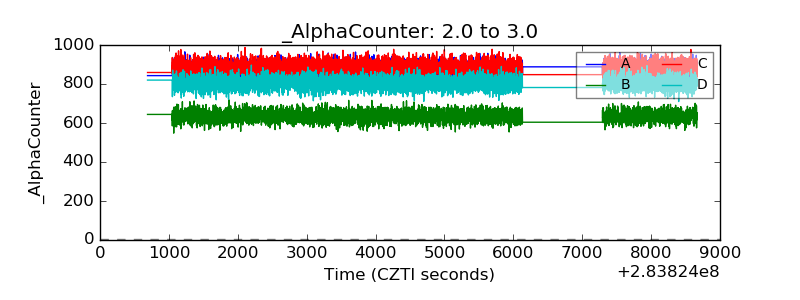 |
| _CPM_Rate | 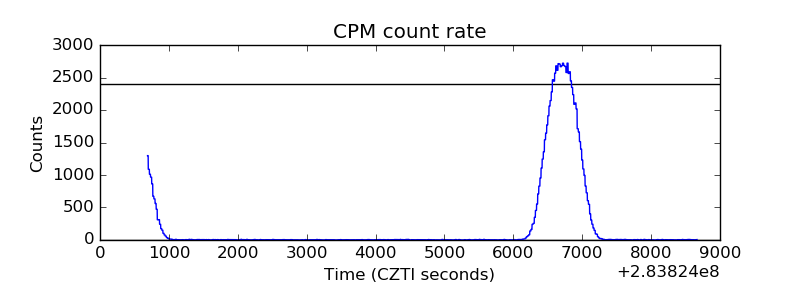 |
| CZT Counter | 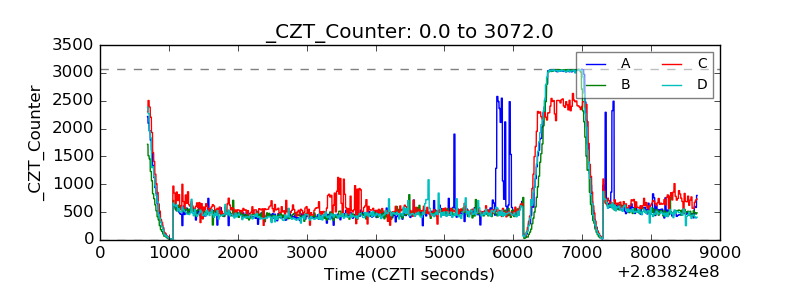 |
| +2.5 Volts monitor |  |
| +5 Volts monitor |  |
| _ROLL_ROT | 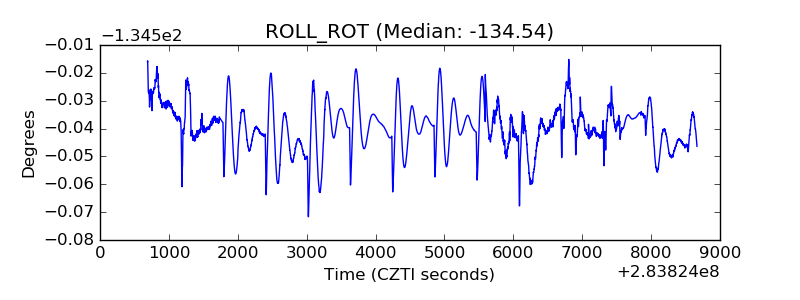 |
| _Roll_DEC | 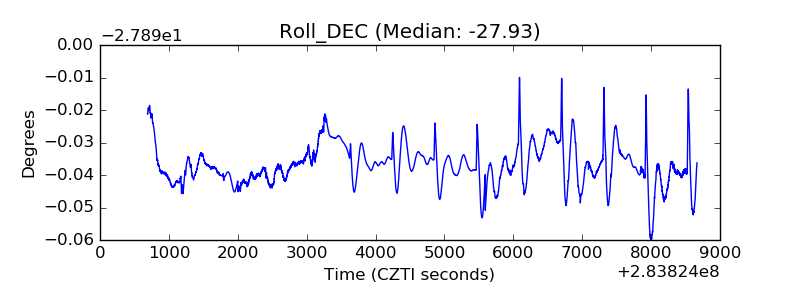 |
| _Roll_RA | 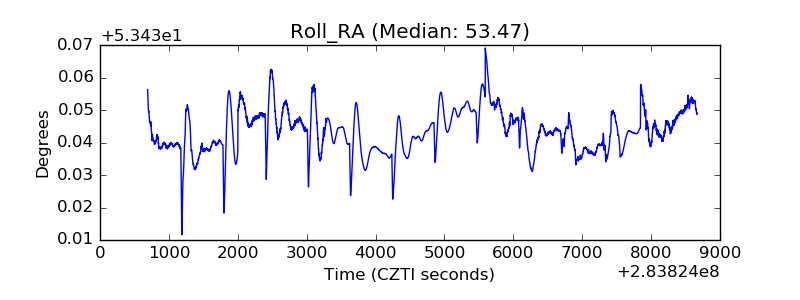 |
| Veto Counter | 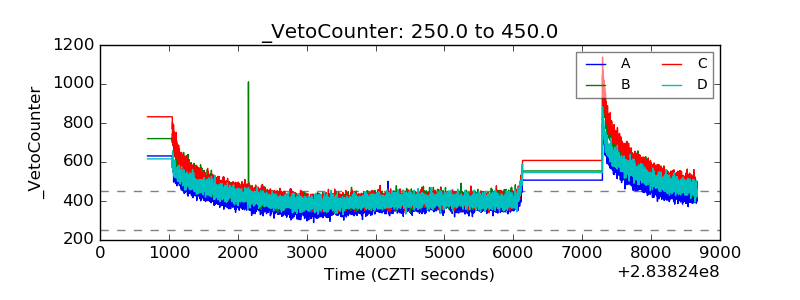 |