| Param | Original file | Final file |
|---|---|---|
| Filename | modeM0/AS1A05_056T01_9000002604_17599cztM0_level2.evt | modeM0/AS1A05_056T01_9000002604_17599cztM0_level2_quad_clean.evt |
| Size (bytes) | 476,556,480 | 77,379,840 |
| Size | 454.5 MB | 73.8 MB |
| Events in quadrant A | 3,293,368 | 477,337 |
| Events in quadrant B | 3,248,912 | 493,743 |
| Events in quadrant C | 4,314,301 | 467,796 |
| Events in quadrant D | 3,146,569 | 462,664 |
| Mode M9 | |||
|---|---|---|---|
| Quadrant | BADHDUFLAG | Total packets | Discarded packets |
| A | 0 | 12 | 0 |
| B | 0 | 12 | 0 |
| C | 0 | 12 | 0 |
| D | 0 | 12 | 0 |
| Mode M0 | |||
|---|---|---|---|
| Quadrant | BADHDUFLAG | Total packets | Discarded packets |
| A | 0 | 13562 | 2 |
| B | 0 | 13419 | 2 |
| C | 0 | 17796 | 2 |
| D | 0 | 13265 | 2 |
| Mode SS | |||
|---|---|---|---|
| Quadrant | BADHDUFLAG | Total packets | Discarded packets |
| A | 0 | 130 | 0 |
| B | 0 | 130 | 0 |
| C | 0 | 130 | 0 |
| D | 0 | 130 | 0 |
| Quadrant | Total seconds | Saturated seconds | Saturation percentage |
|---|---|---|---|
| A | 6321 | 60 | 0.949217% |
| B | 6321 | 33 | 0.522069% |
| C | 6322 | 102 | 1.613413% |
| D | 6322 | 16 | 0.253084% |
Noise dominated data is calculated using 1-second bins in cleaned event files. If a bin has >2000 counts, and if more than 50% of those come from <1% of pixels, then it is considered to be noise-dominated and hence unusable.
| Quadrant | # 1 sec bins | Bins with >0 counts | Bins with >2000 counts | High rate bins dominated by noise | Noise dominated (total time) | Noise dominated (detector-on time) | Marked lightcurve |
|---|---|---|---|---|---|---|---|
| A | 7576 | 6322 | 32 | 32 | 0.42% | 0.51% | 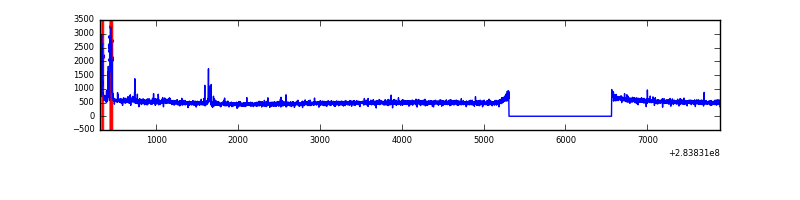 |
| B | 7576 | 6322 | 0 | 0 | 0.00% | 0.00% | 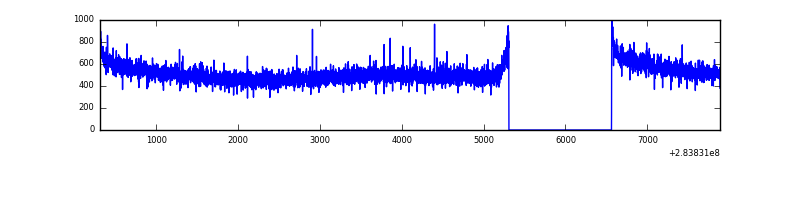 |
| C | 7577 | 6323 | 0 | 0 | 0.00% | 0.00% | 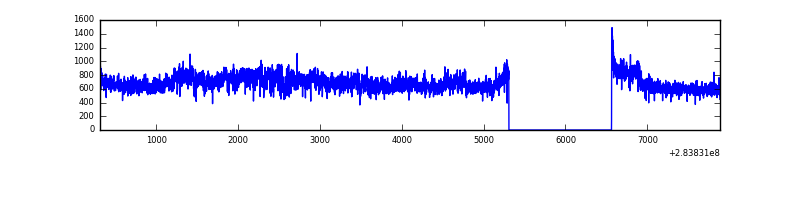 |
| D | 7577 | 6323 | 0 | 0 | 0.00% | 0.00% | 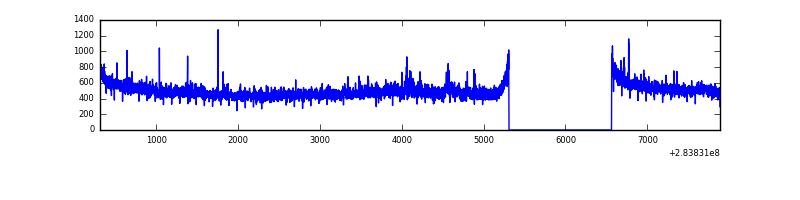 |
Top three noisy pixels from each quadrant. If the there are fewer than three noisy pixels in the level2.evt file, extra rows are filled as -1
| Pixel properties | Quadrant properties | ||||||
|---|---|---|---|---|---|---|---|
| Quadrant | DetID | PixID | Counts | Sigma | Mean | Median | Sigma |
| A | 14 | 237 | 142191 | 869.22 | 820 | 806 | 162.7 |
| A | 0 | 226 | 7043 | 38.34 | 820 | 806 | 162.7 |
| A | 12 | 194 | 5966 | 31.72 | 820 | 806 | 162.7 |
| B | 12 | 111 | 18476 | 113.22 | 831 | 811 | 156.0 |
| B | 11 | 111 | 16015 | 97.44 | 831 | 811 | 156.0 |
| B | 14 | 111 | 14035 | 84.75 | 831 | 811 | 156.0 |
| C | 3 | 233 | 984338 | 5299.05 | 805 | 815 | 185.6 |
| C | 14 | 238 | 127742 | 683.86 | 805 | 815 | 185.6 |
| C | 5 | 218 | 59224 | 314.7 | 805 | 815 | 185.6 |
| D | 4 | 239 | 43343 | 218.46 | 809 | 787 | 194.8 |
| D | 1 | 52 | 42551 | 214.4 | 809 | 787 | 194.8 |
| D | 2 | 234 | 21701 | 107.36 | 809 | 787 | 194.8 |
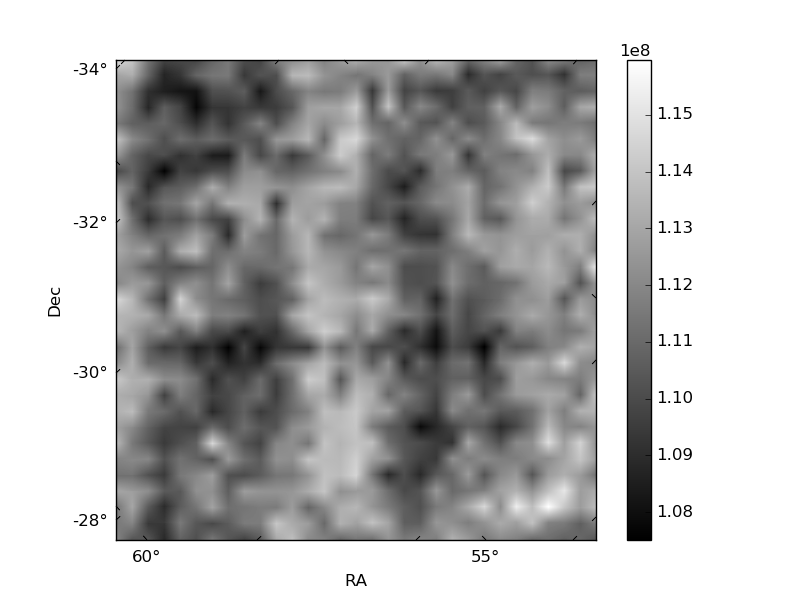
Histogram calculated using DETX and DETY for each event in the final _common_clean file
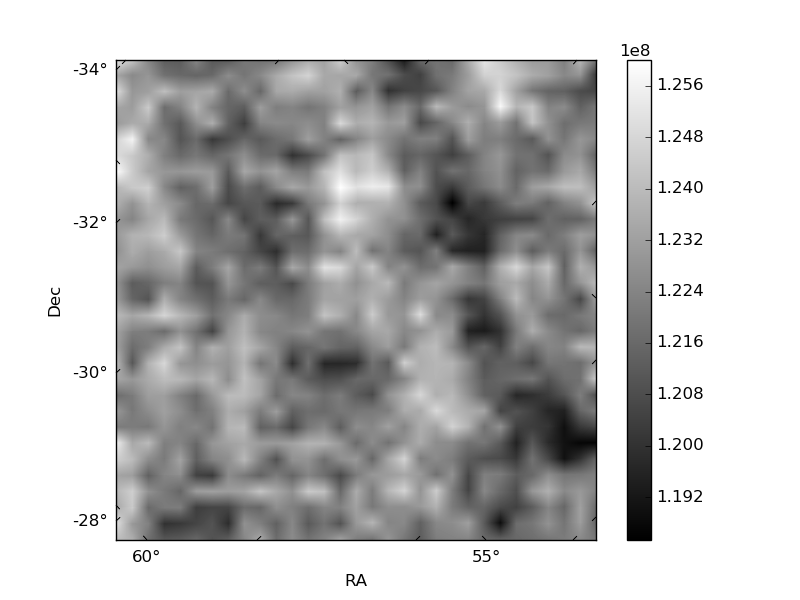
| Quadrant A | 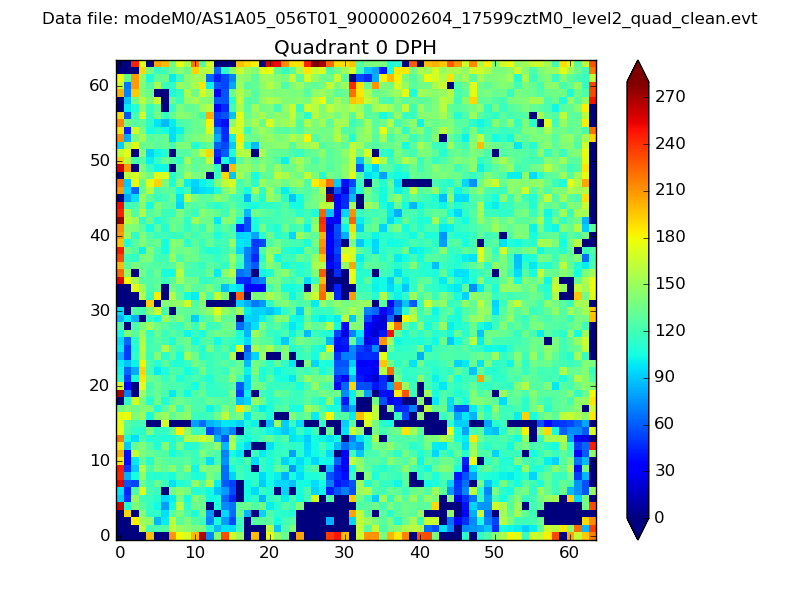 |
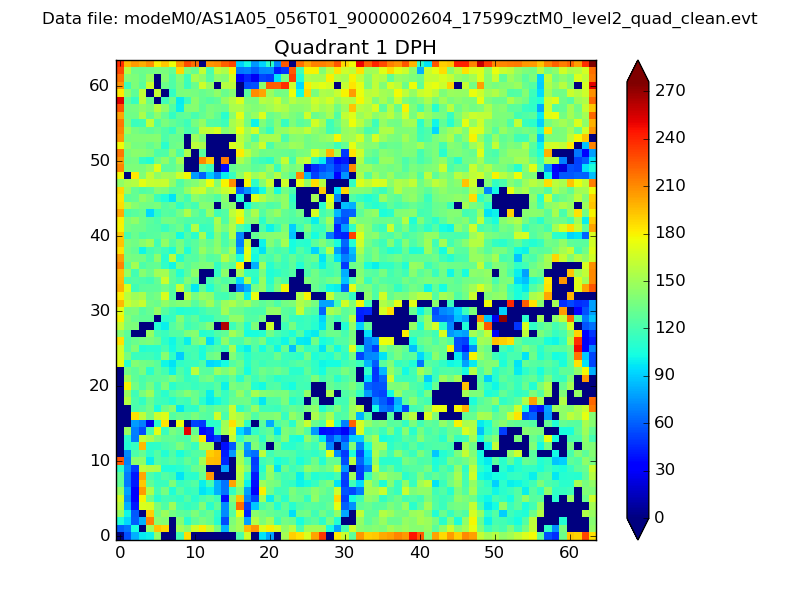 |
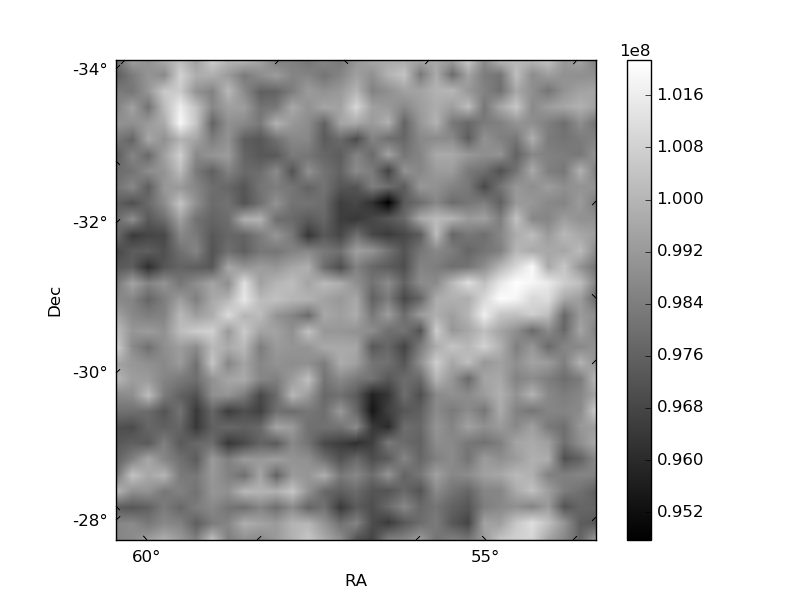
Quadrant B |
|---|---|---|---|
| Quadrant D | 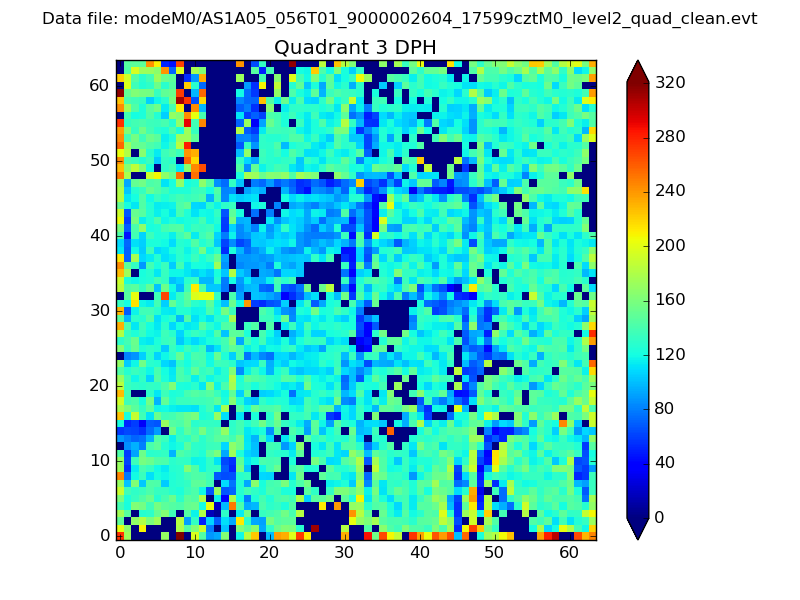 |
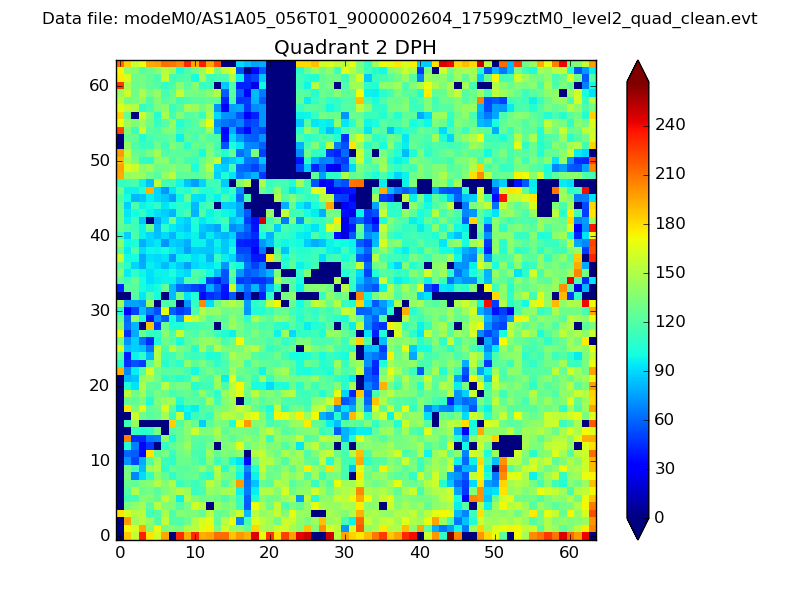 |
Quadrant C |
| Plot type | Count rate plots | Images |
|---|---|---|
| Comparison with Poisson distribution Blue bars denote a histogram of data divided into 1 sec bins. Red curve is a Poisson curve with rate = median count rate of data. |
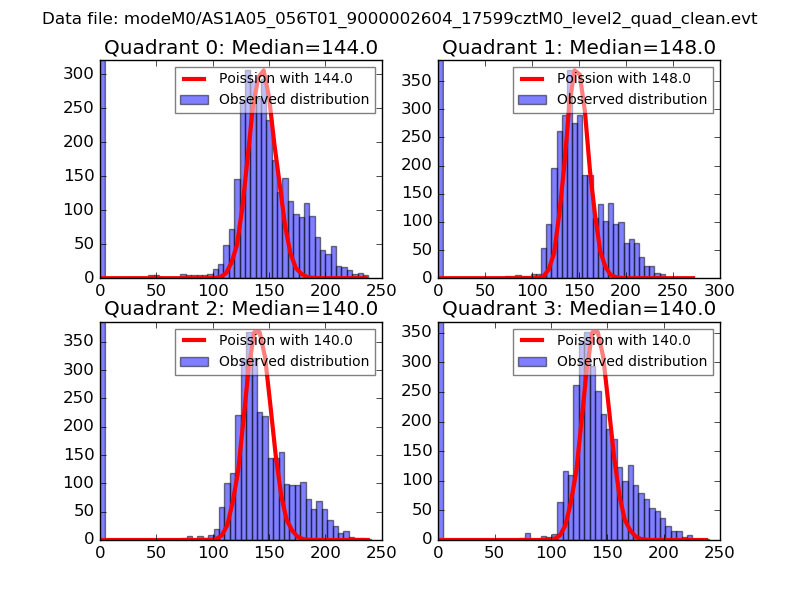 |
 |
| Quadrant-wise count rates Data is divided into 100 sec bins |
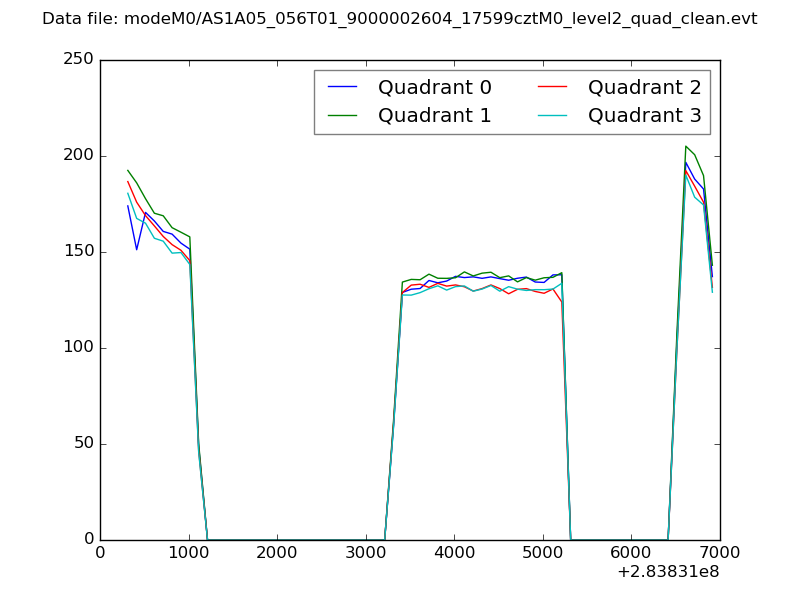 |
|
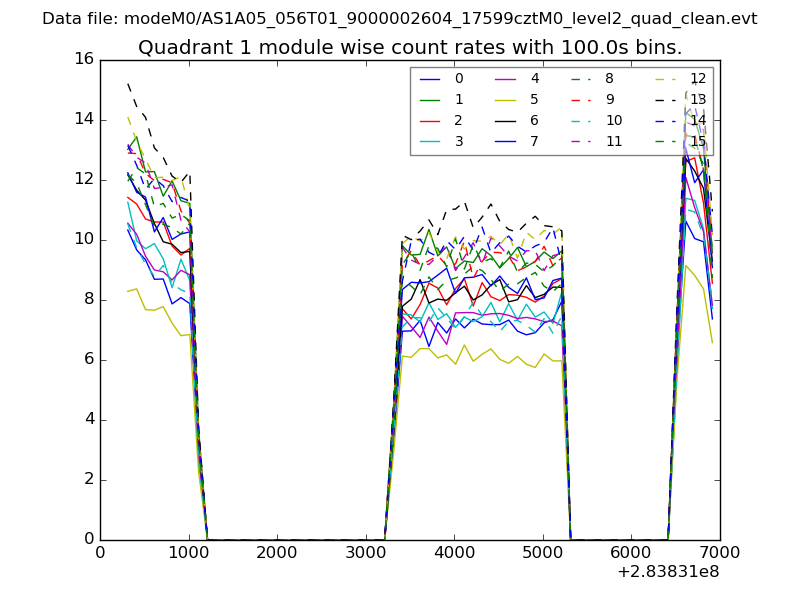
| Module-wise count rates for Quadrant A Data is divided into 100 sec bins |
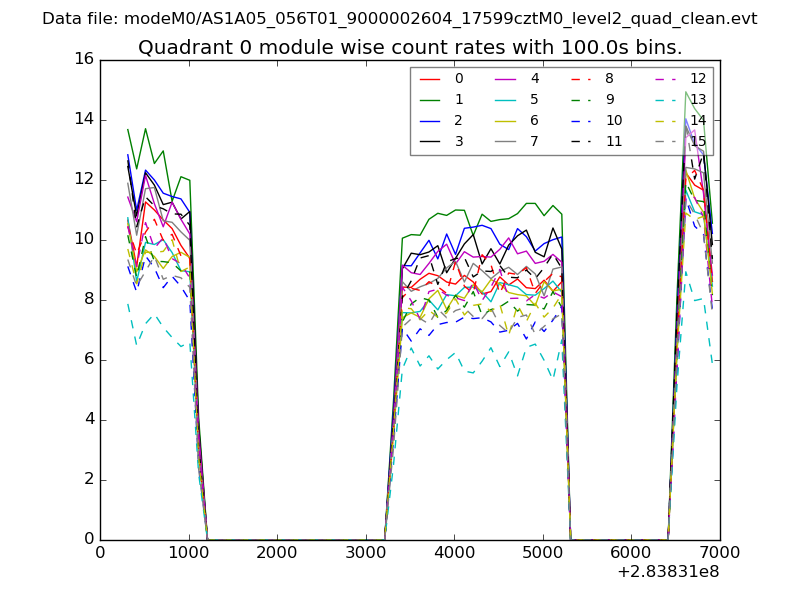 |
 |
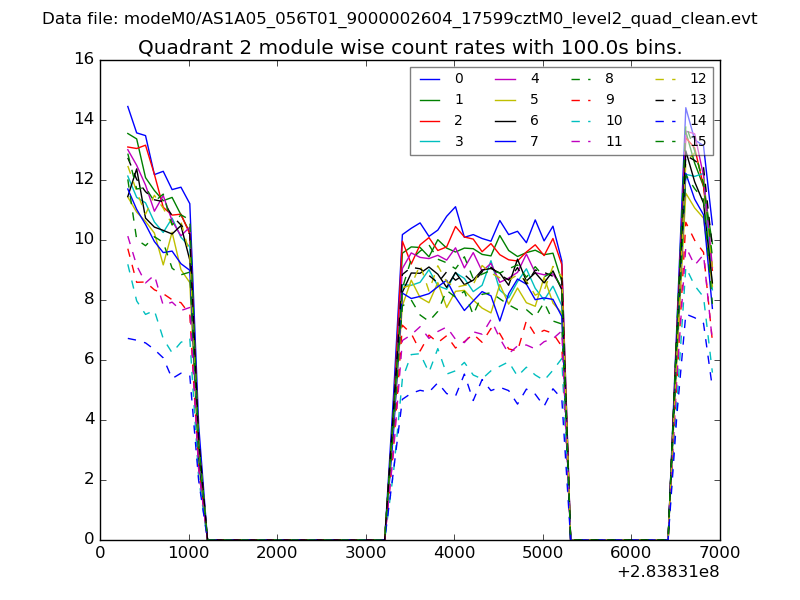
| Module-wise count rates for Quadrant B Data is divided into 100 sec bins |
 |
 |
| Module-wise count rates for Quadrant C Data is divided into 100 sec bins |
 |
 |
| Module-wise count rates for Quadrant D Data is divided into 100 sec bins |
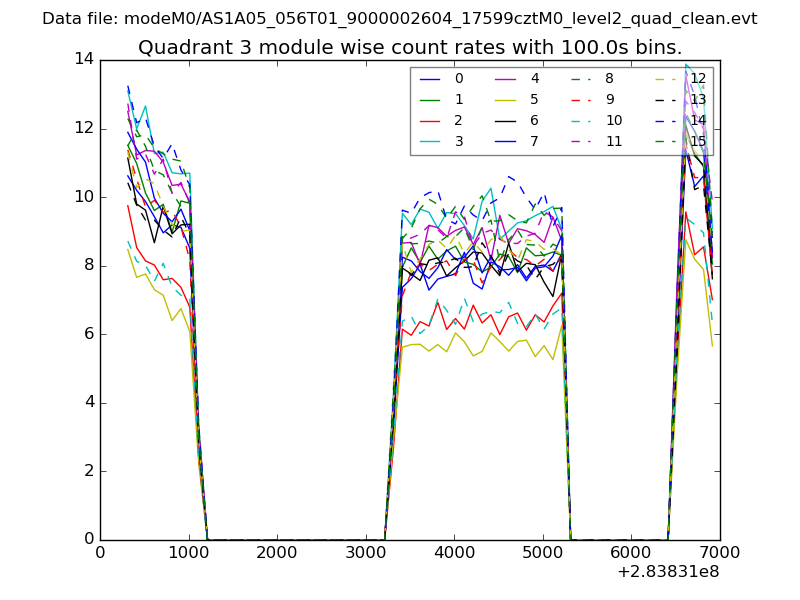 |
 |
| Parameter | Plot |
|---|---|
| CZT HV Monitor | 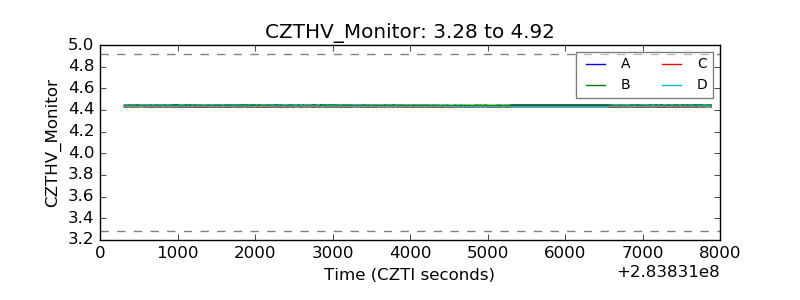 |
| D_VDD | 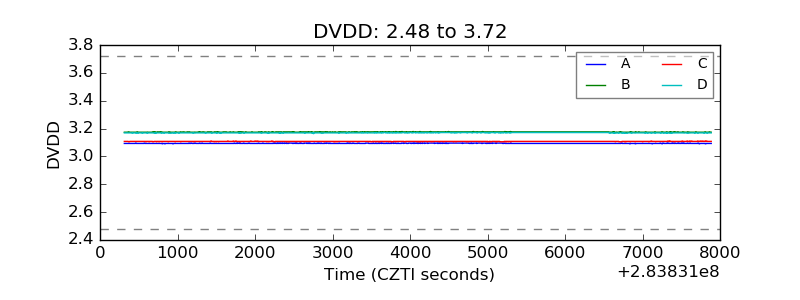 |
| Temperature 1 | 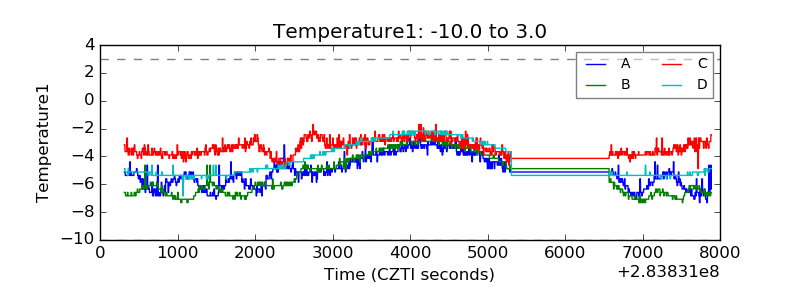 |
| Veto HV Monitor | 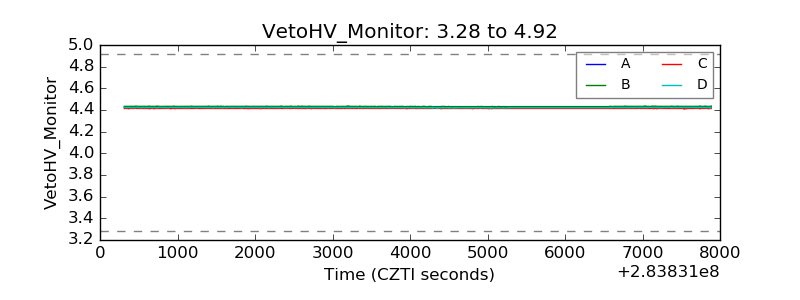 |
| Veto LLD | 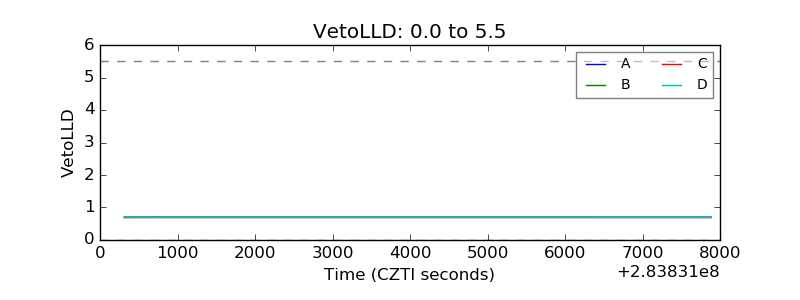 |
| Alpha Counter | 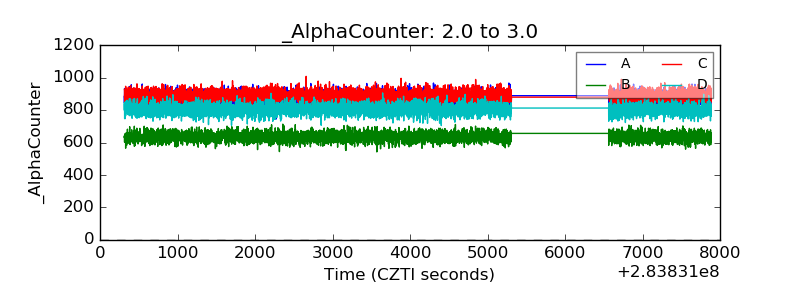 |
| _CPM_Rate | 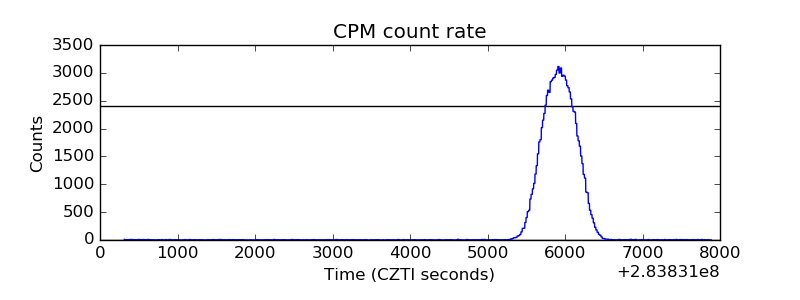 |
| CZT Counter |  |
| +2.5 Volts monitor | 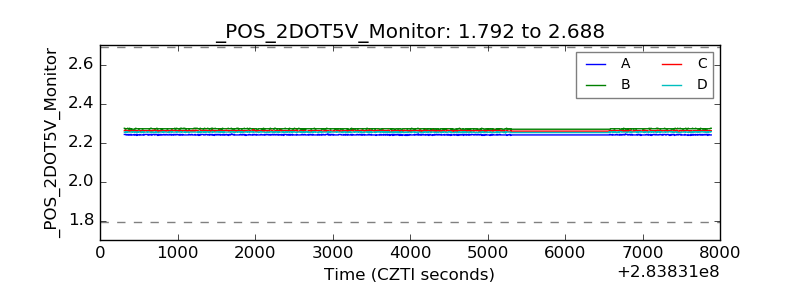 |
| +5 Volts monitor | 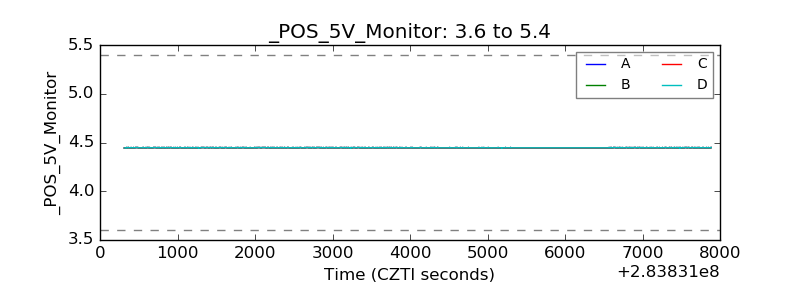 |
| _ROLL_ROT | 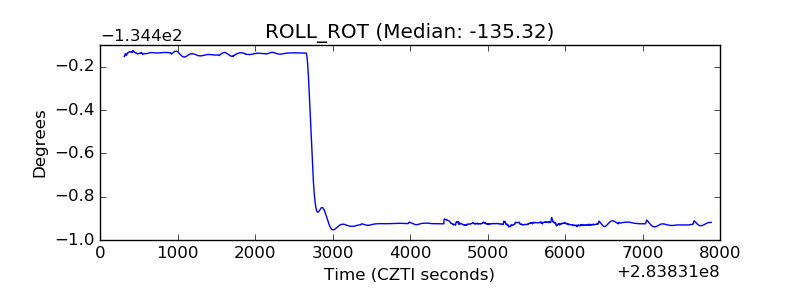 |
| _Roll_DEC | 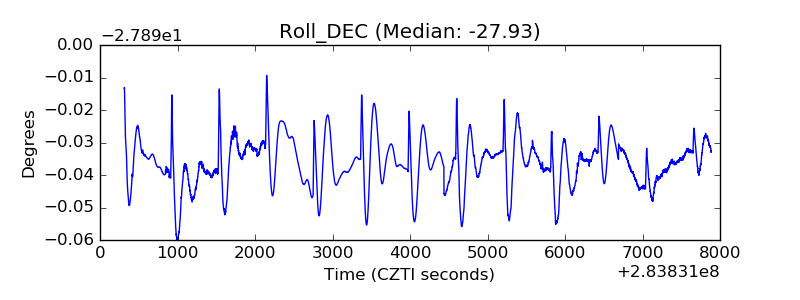 |
| _Roll_RA |  |
| Veto Counter | 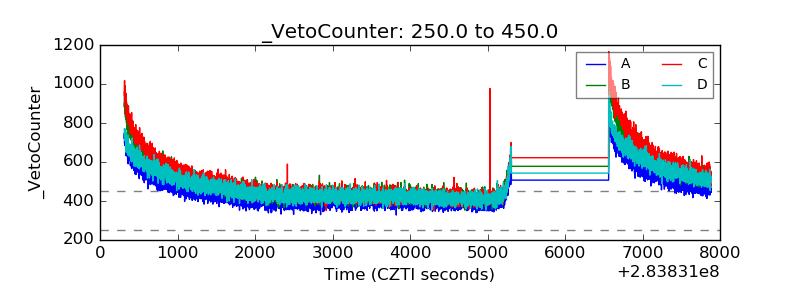 |