| Param | Original file | Final file |
|---|---|---|
| Filename | modeM0/AS1A05_056T01_9000002604_17602cztM0_level2.evt | modeM0/AS1A05_056T01_9000002604_17602cztM0_level2_quad_clean.evt |
| Size (bytes) | 467,593,920 | 72,604,800 |
| Size | 445.9 MB | 69.2 MB |
| Events in quadrant A | 3,300,483 | 444,670 |
| Events in quadrant B | 3,356,789 | 449,321 |
| Events in quadrant C | 3,864,069 | 429,573 |
| Events in quadrant D | 3,205,910 | 429,061 |
| Mode M9 | |||
|---|---|---|---|
| Quadrant | BADHDUFLAG | Total packets | Discarded packets |
| A | 0 | 21 | 0 |
| B | 0 | 22 | 0 |
| C | 0 | 22 | 0 |
| D | 0 | 22 | 0 |
| Mode M0 | |||
|---|---|---|---|
| Quadrant | BADHDUFLAG | Total packets | Discarded packets |
| A | 0 | 13499 | 2 |
| B | 0 | 13696 | 3 |
| C | 0 | 15687 | 2 |
| D | 0 | 13517 | 2 |
| Mode SS | |||
|---|---|---|---|
| Quadrant | BADHDUFLAG | Total packets | Discarded packets |
| A | 0 | 128 | 0 |
| B | 0 | 128 | 0 |
| C | 0 | 128 | 0 |
| D | 0 | 128 | 0 |
| Quadrant | Total seconds | Saturated seconds | Saturation percentage |
|---|---|---|---|
| A | 6395 | 100 | 1.563722% |
| B | 6394 | 110 | 1.720363% |
| C | 6394 | 199 | 3.112293% |
| D | 6394 | 88 | 1.376290% |
Noise dominated data is calculated using 1-second bins in cleaned event files. If a bin has >2000 counts, and if more than 50% of those come from <1% of pixels, then it is considered to be noise-dominated and hence unusable.
| Quadrant | # 1 sec bins | Bins with >0 counts | Bins with >2000 counts | High rate bins dominated by noise | Noise dominated (total time) | Noise dominated (detector-on time) | Marked lightcurve |
|---|---|---|---|---|---|---|---|
| A | 7630 | 6396 | 1 | 1 | 0.01% | 0.02% | 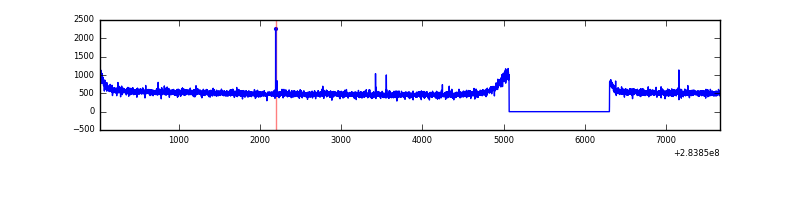 |
| B | 7629 | 6394 | 1 | 1 | 0.01% | 0.02% | 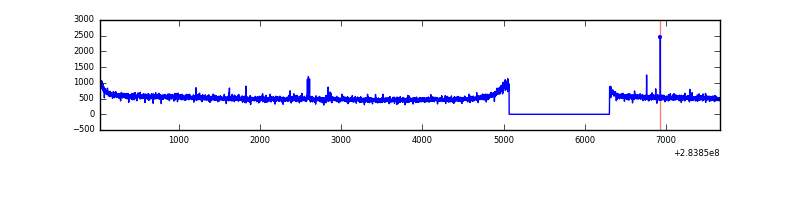 |
| C | 7629 | 6394 | 0 | 0 | 0.00% | 0.00% | 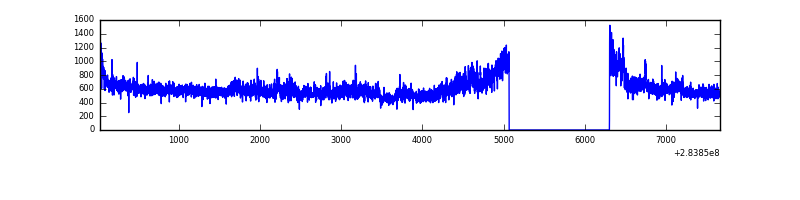 |
| D | 7629 | 6394 | 2 | 2 | 0.03% | 0.03% | 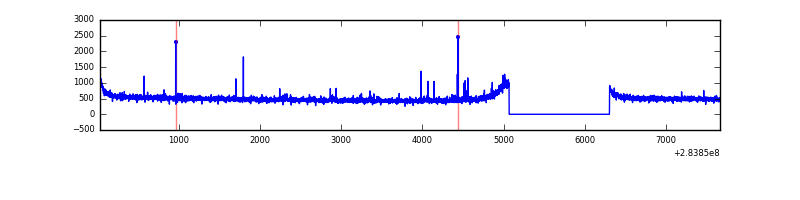 |
Top three noisy pixels from each quadrant. If the there are fewer than three noisy pixels in the level2.evt file, extra rows are filled as -1
| Pixel properties | Quadrant properties | ||||||
|---|---|---|---|---|---|---|---|
| Quadrant | DetID | PixID | Counts | Sigma | Mean | Median | Sigma |
| A | 15 | 191 | 8072 | 42.71 | 856 | 841 | 169.3 |
| A | 0 | 226 | 7498 | 39.32 | 856 | 841 | 169.3 |
| A | 3 | 137 | 6189 | 31.59 | 856 | 841 | 169.3 |
| B | 12 | 111 | 19153 | 113.11 | 856 | 835 | 161.9 |
| B | 11 | 111 | 16577 | 97.21 | 856 | 835 | 161.9 |
| B | 14 | 111 | 14864 | 86.63 | 856 | 835 | 161.9 |
| C | 3 | 233 | 485908 | 2543.87 | 825 | 833 | 190.7 |
| C | 14 | 238 | 129114 | 672.74 | 825 | 833 | 190.7 |
| C | 5 | 218 | 31094 | 158.7 | 825 | 833 | 190.7 |
| D | 4 | 239 | 22952 | 109.69 | 838 | 815 | 201.8 |
| D | 2 | 234 | 21746 | 103.72 | 838 | 815 | 201.8 |
| D | 1 | 52 | 11360 | 52.25 | 838 | 815 | 201.8 |
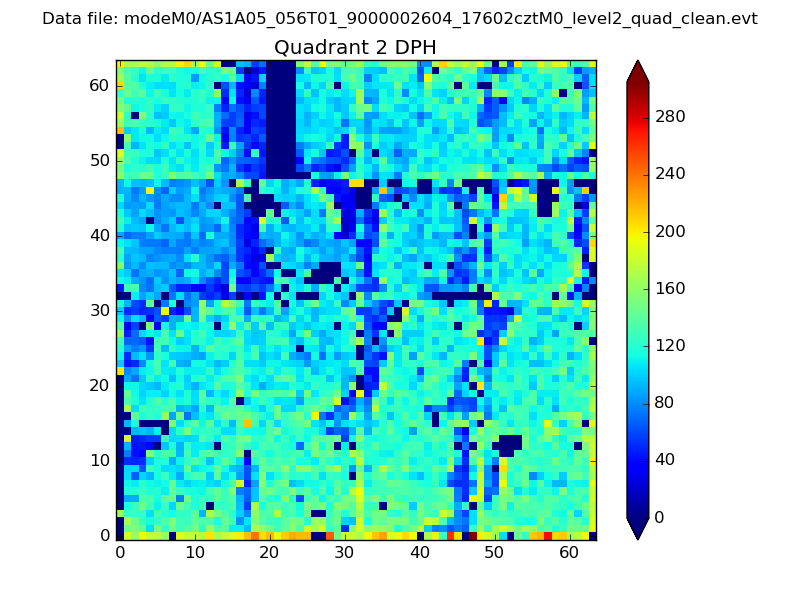
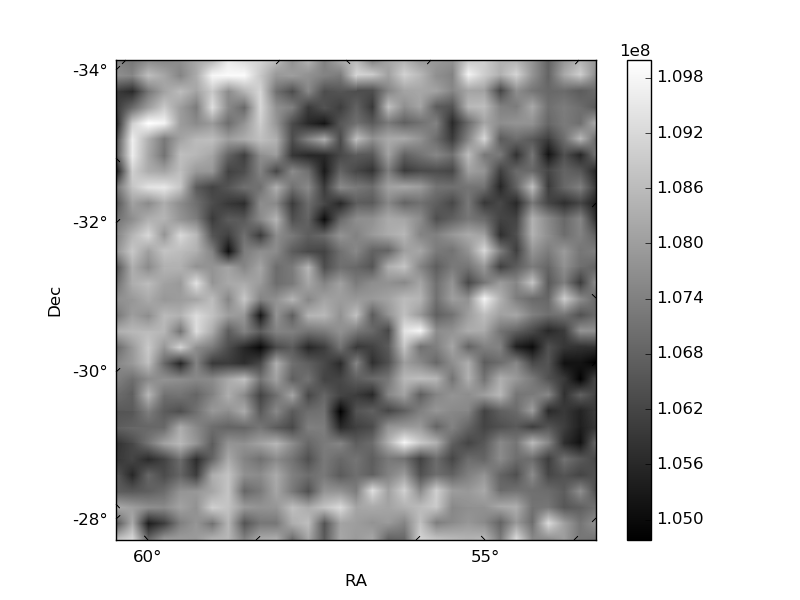
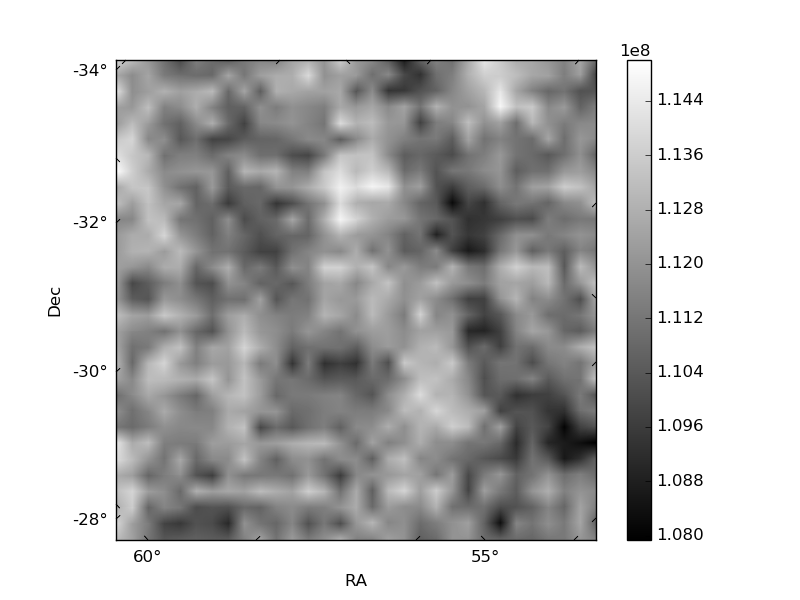
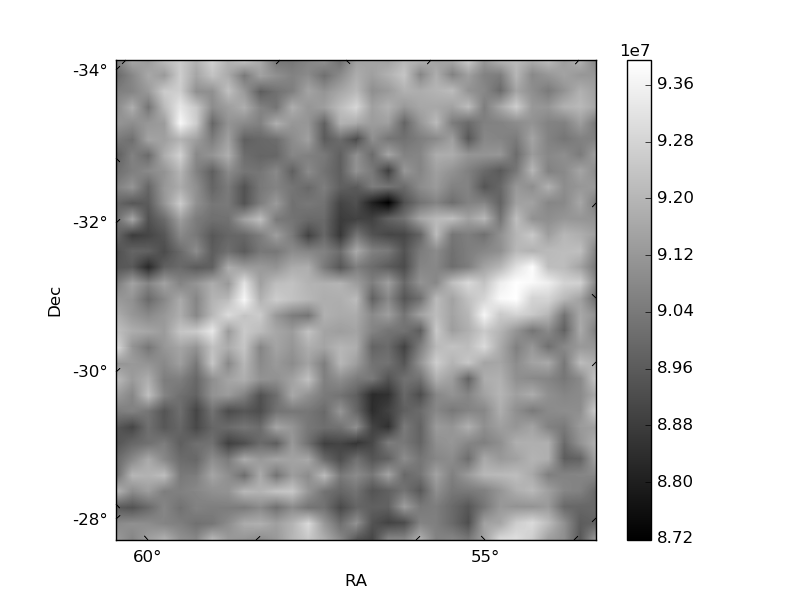
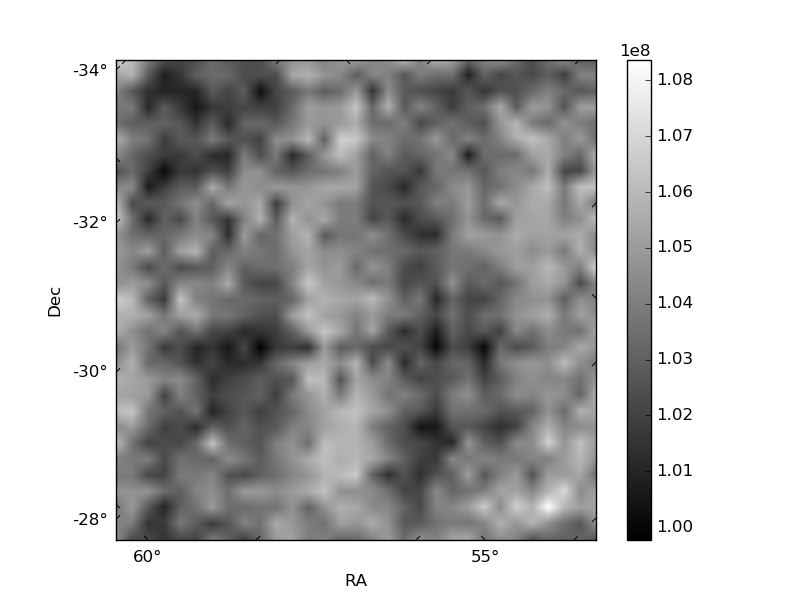
Histogram calculated using DETX and DETY for each event in the final _common_clean file
| Quadrant A | 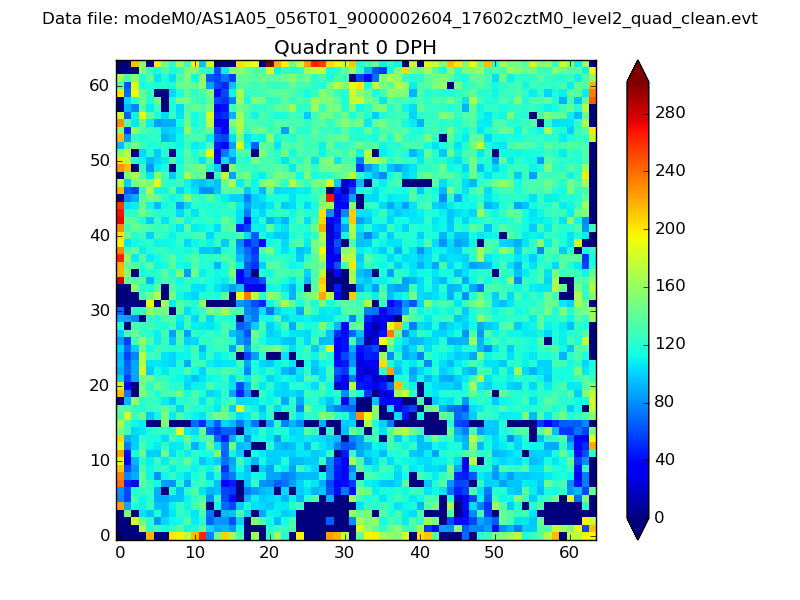 |
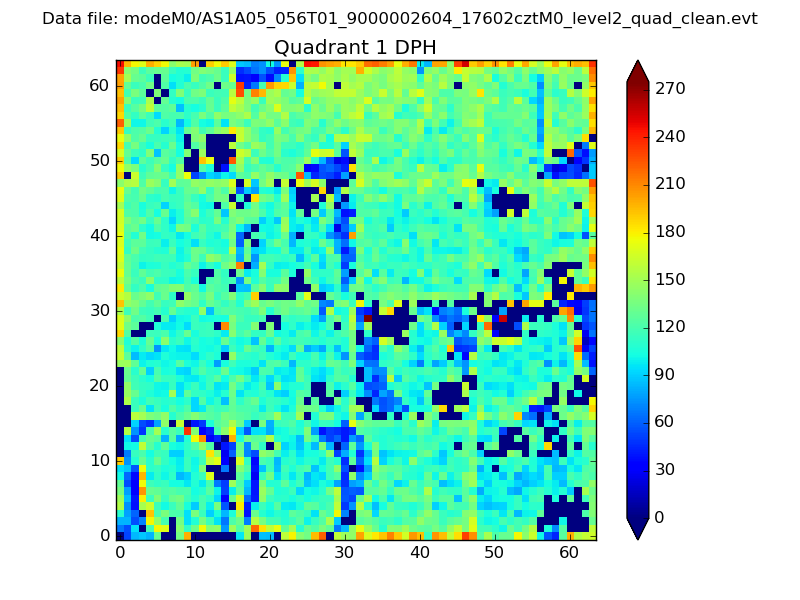 |
Quadrant B |
|---|---|---|---|
| Quadrant D | 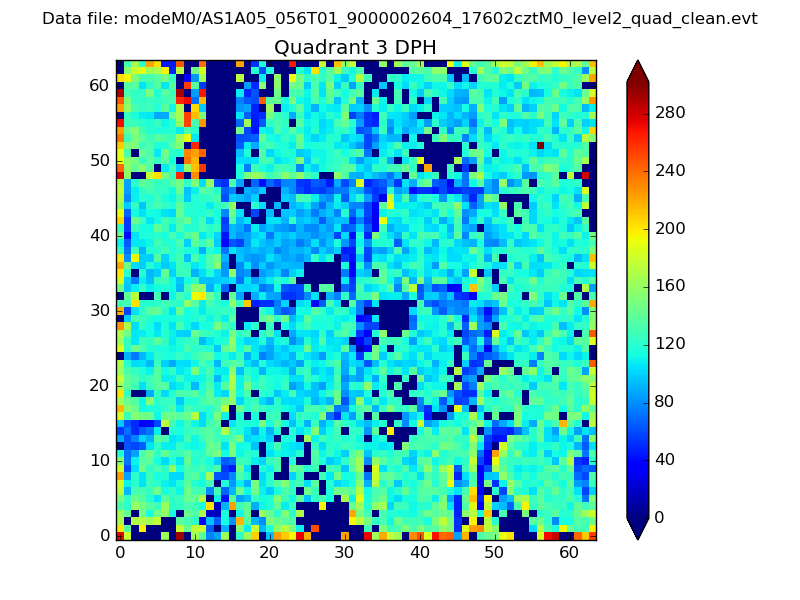 |
 |
Quadrant C |
| Plot type | Count rate plots | Images |
|---|---|---|
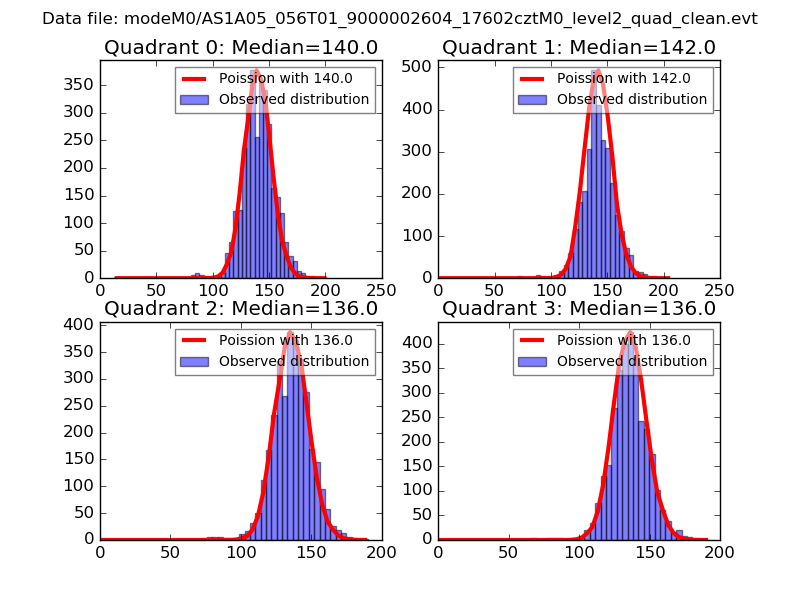
| Comparison with Poisson distribution Blue bars denote a histogram of data divided into 1 sec bins. Red curve is a Poisson curve with rate = median count rate of data. |
 |
 |
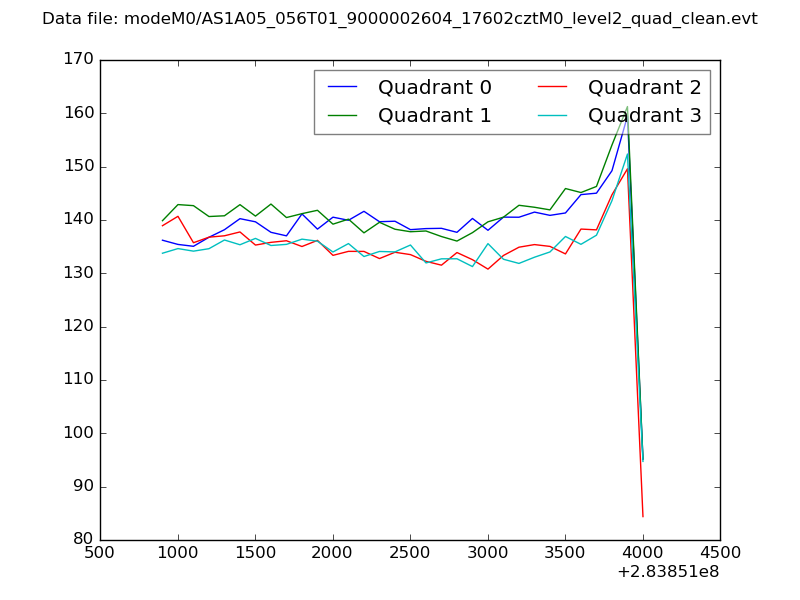
| Quadrant-wise count rates Data is divided into 100 sec bins |
 |
|
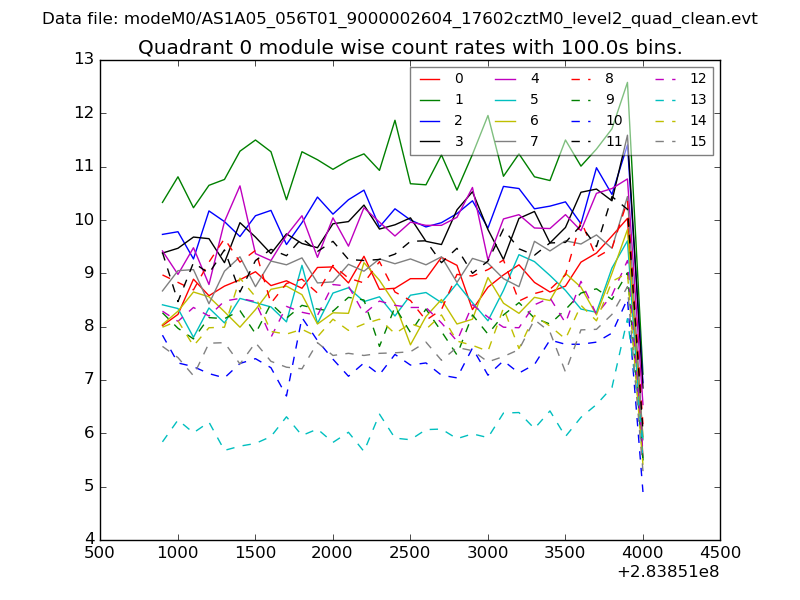
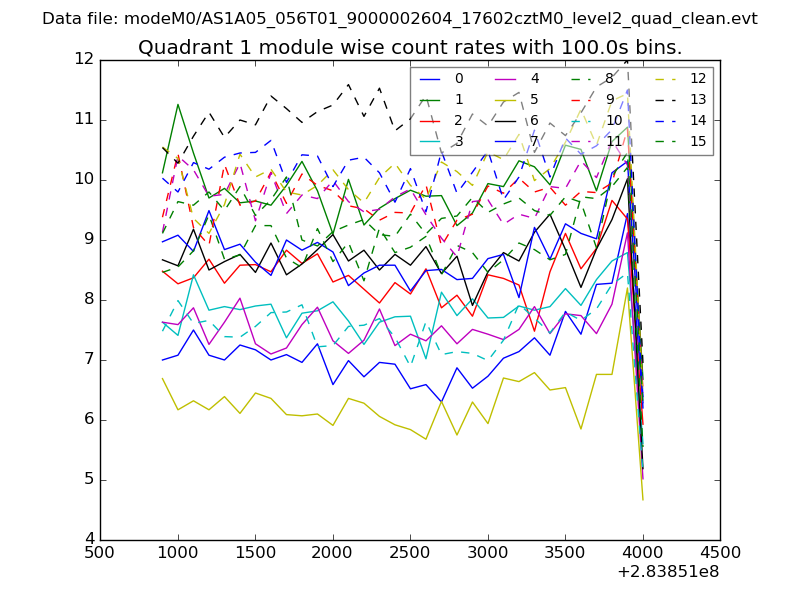
| Module-wise count rates for Quadrant A Data is divided into 100 sec bins |
 |
 |
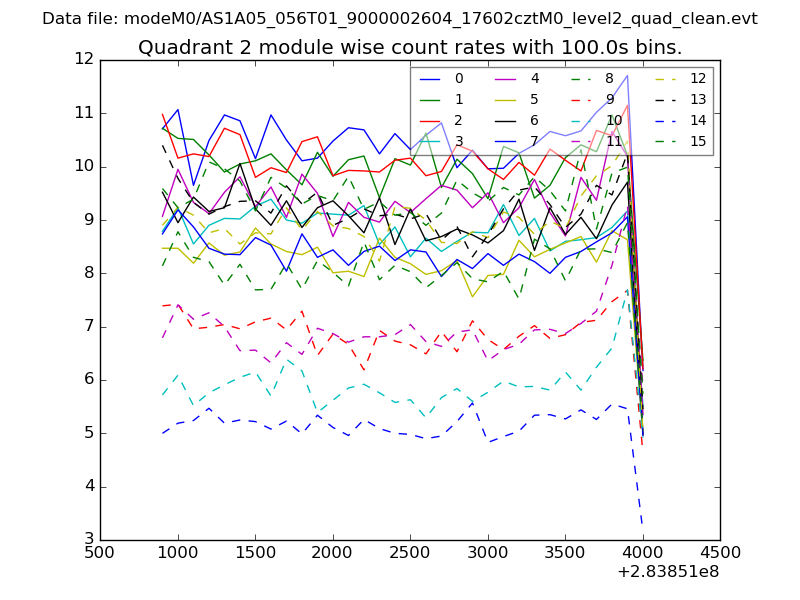
| Module-wise count rates for Quadrant B Data is divided into 100 sec bins |
 |
 |
| Module-wise count rates for Quadrant C Data is divided into 100 sec bins |
 |
 |
| Module-wise count rates for Quadrant D Data is divided into 100 sec bins |
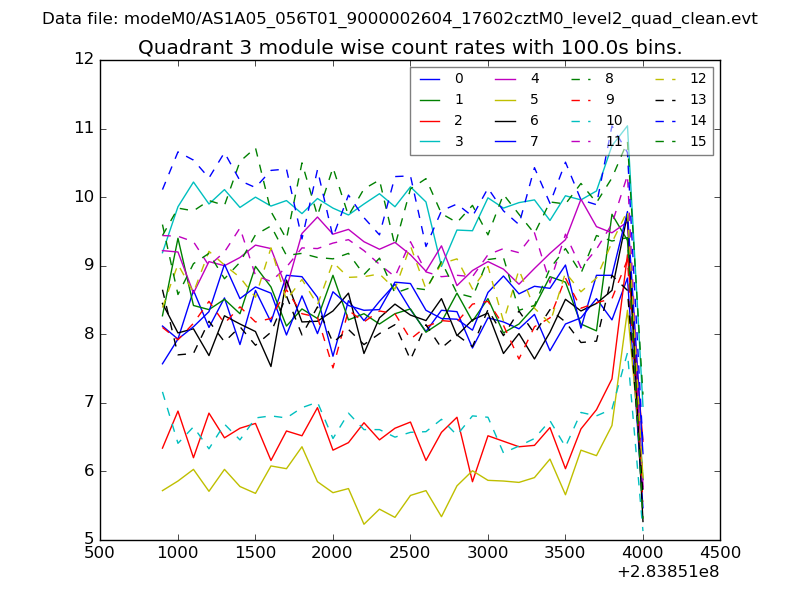 |
 |
| Parameter | Plot |
|---|---|
| CZT HV Monitor | 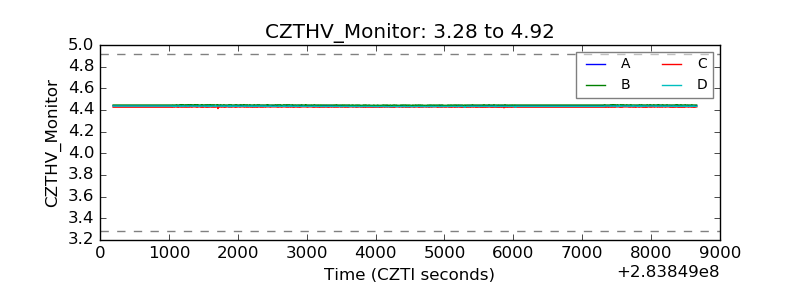 |
| D_VDD | 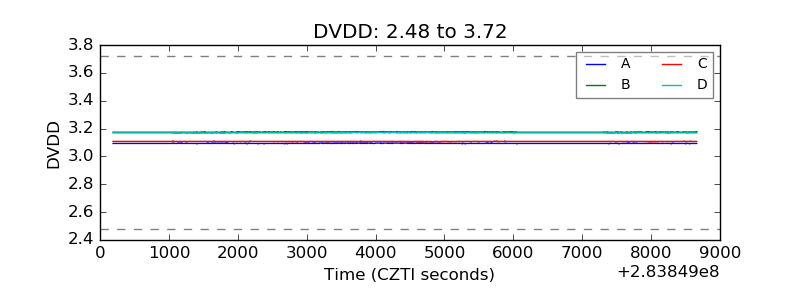 |
| Temperature 1 | 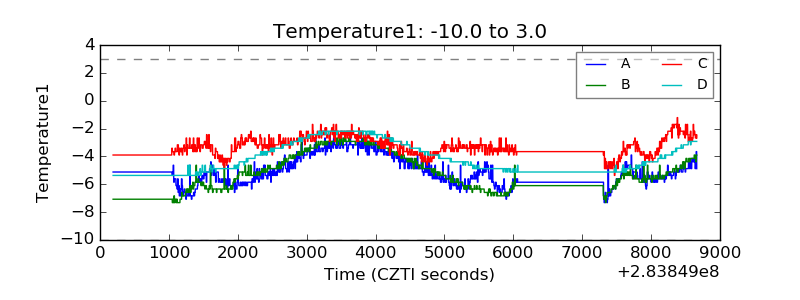 |
| Veto HV Monitor | 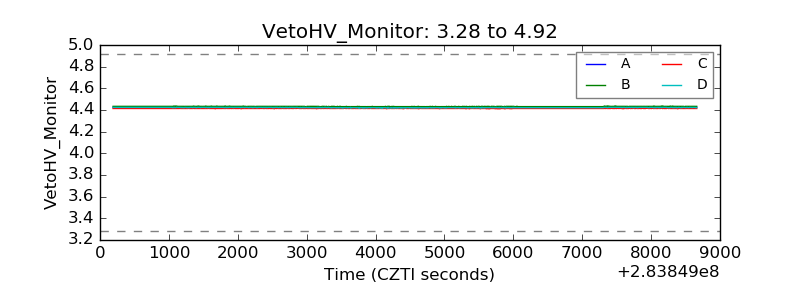 |
| Veto LLD | 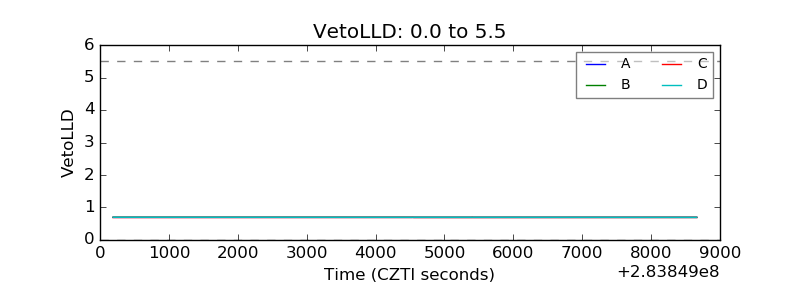 |
| Alpha Counter | 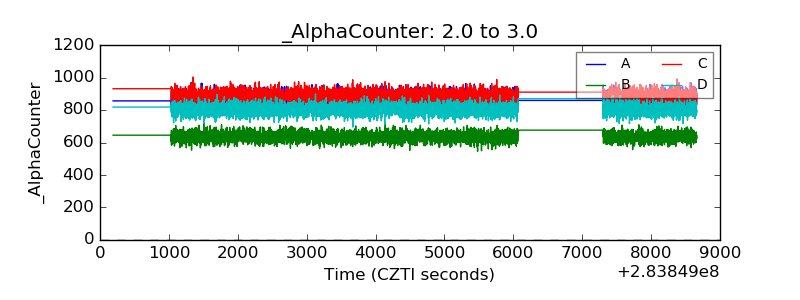 |
| _CPM_Rate | 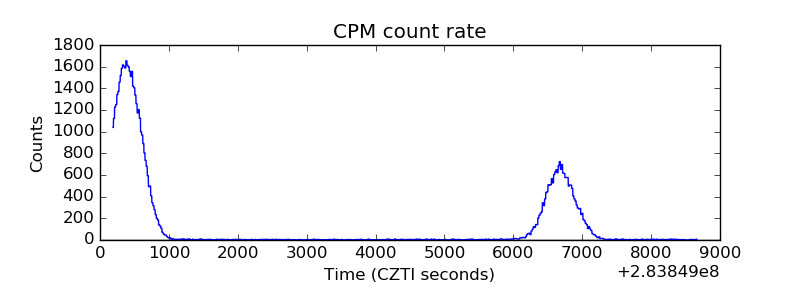 |
| CZT Counter | 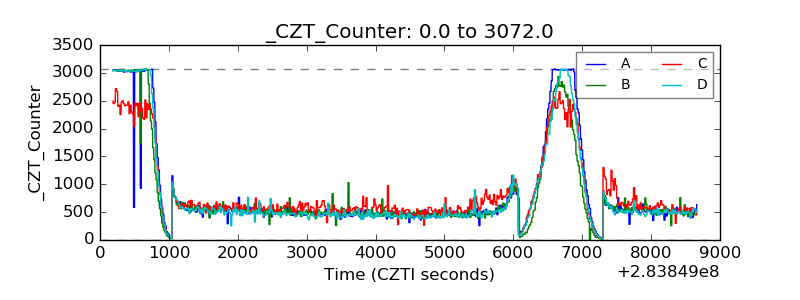 |
| +2.5 Volts monitor |  |
| +5 Volts monitor | 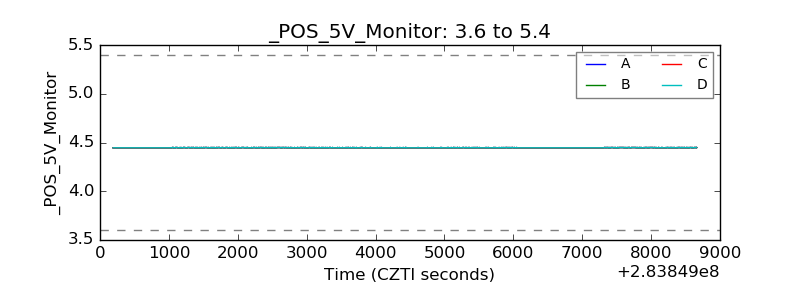 |
| _ROLL_ROT | 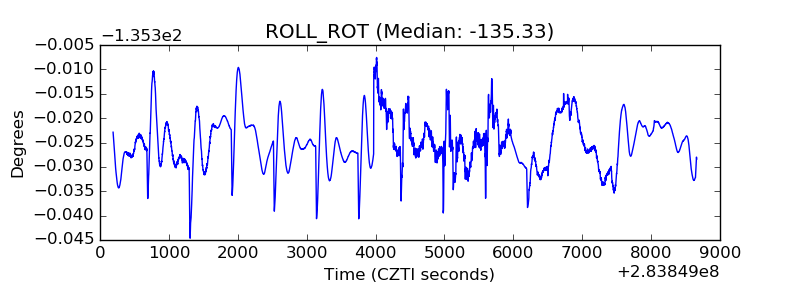 |
| _Roll_DEC | 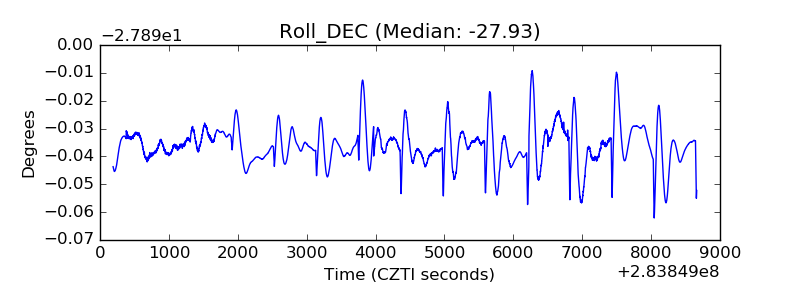 |
| _Roll_RA |  |
| Veto Counter | 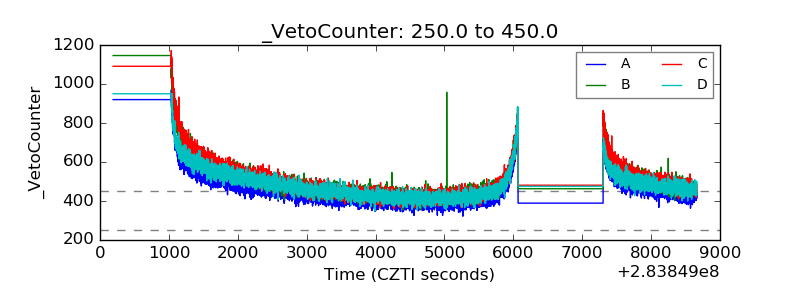 |