| Param | Original file | Final file |
|---|---|---|
| Filename | modeM0/AS1A05_056T01_9000002604_17604cztM0_level2.evt | modeM0/AS1A05_056T01_9000002604_17604cztM0_level2_quad_clean.evt |
| Size (bytes) | 540,809,280 | 99,060,480 |
| Size | 515.8 MB | 94.5 MB |
| Events in quadrant A | 3,786,745 | 625,990 |
| Events in quadrant B | 3,841,466 | 627,646 |
| Events in quadrant C | 4,380,255 | 602,690 |
| Events in quadrant D | 3,842,128 | 603,077 |
| Mode M9 | |||
|---|---|---|---|
| Quadrant | BADHDUFLAG | Total packets | Discarded packets |
| A | 0 | 16 | 0 |
| B | 0 | 16 | 0 |
| C | 0 | 16 | 0 |
| D | 0 | 16 | 0 |
| Mode M0 | |||
|---|---|---|---|
| Quadrant | BADHDUFLAG | Total packets | Discarded packets |
| A | 0 | 16203 | 2 |
| B | 0 | 16260 | 2 |
| C | 0 | 18026 | 2 |
| D | 0 | 16713 | 2 |
| Mode SS | |||
|---|---|---|---|
| Quadrant | BADHDUFLAG | Total packets | Discarded packets |
| A | 0 | 158 | 0 |
| B | 0 | 158 | 0 |
| C | 0 | 158 | 0 |
| D | 0 | 158 | 0 |
| Quadrant | Total seconds | Saturated seconds | Saturation percentage |
|---|---|---|---|
| A | 7778 | 190 | 2.442787% |
| B | 7779 | 233 | 2.995244% |
| C | 7779 | 255 | 3.278056% |
| D | 7779 | 152 | 1.953979% |
Noise dominated data is calculated using 1-second bins in cleaned event files. If a bin has >2000 counts, and if more than 50% of those come from <1% of pixels, then it is considered to be noise-dominated and hence unusable.
| Quadrant | # 1 sec bins | Bins with >0 counts | Bins with >2000 counts | High rate bins dominated by noise | Noise dominated (total time) | Noise dominated (detector-on time) | Marked lightcurve |
|---|---|---|---|---|---|---|---|
| A | 9318 | 7778 | 0 | 0 | 0.00% | 0.00% | 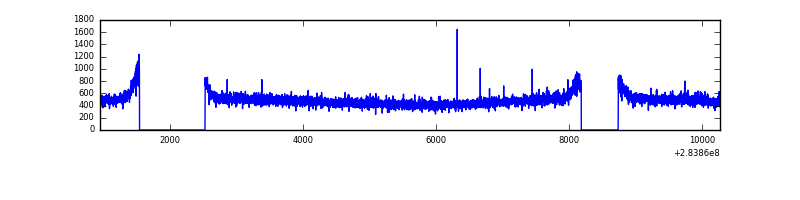 |
| B | 9319 | 7779 | 2 | 2 | 0.02% | 0.03% | 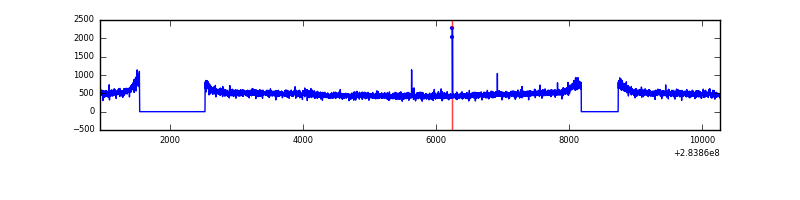 |
| C | 9319 | 7779 | 0 | 0 | 0.00% | 0.00% | 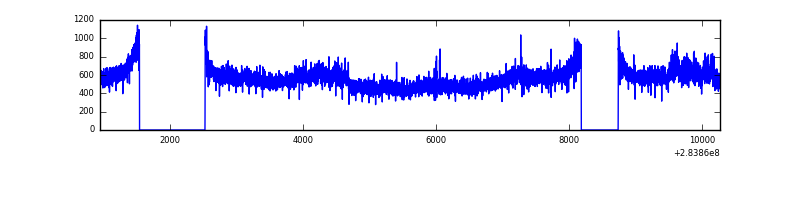 |
| D | 9319 | 7780 | 16 | 16 | 0.17% | 0.21% | 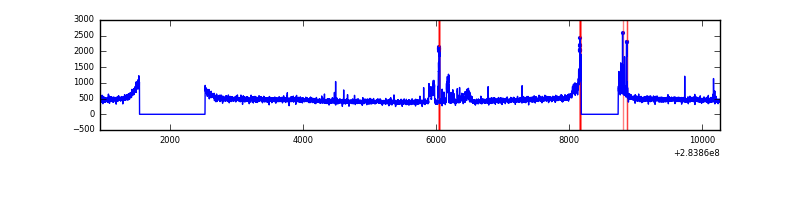 |
Top three noisy pixels from each quadrant. If the there are fewer than three noisy pixels in the level2.evt file, extra rows are filled as -1
| Pixel properties | Quadrant properties | ||||||
|---|---|---|---|---|---|---|---|
| Quadrant | DetID | PixID | Counts | Sigma | Mean | Median | Sigma |
| A | 15 | 191 | 12762 | 59.68 | 980 | 960 | 197.7 |
| A | 0 | 226 | 8357 | 37.41 | 980 | 960 | 197.7 |
| A | 14 | 237 | 7789 | 34.53 | 980 | 960 | 197.7 |
| B | 12 | 111 | 23193 | 116.72 | 978 | 952 | 190.6 |
| B | 11 | 111 | 20405 | 102.09 | 978 | 952 | 190.6 |
| B | 14 | 111 | 17648 | 87.62 | 978 | 952 | 190.6 |
| C | 3 | 233 | 512500 | 2334.96 | 940 | 945 | 219.1 |
| C | 14 | 238 | 144497 | 655.23 | 940 | 945 | 219.1 |
| C | 5 | 218 | 59664 | 268.02 | 940 | 945 | 219.1 |
| D | 7 | 223 | 139117 | 594.18 | 956 | 927 | 232.6 |
| D | 12 | 227 | 86620 | 368.46 | 956 | 927 | 232.6 |
| D | 2 | 234 | 30055 | 125.24 | 956 | 927 | 232.6 |
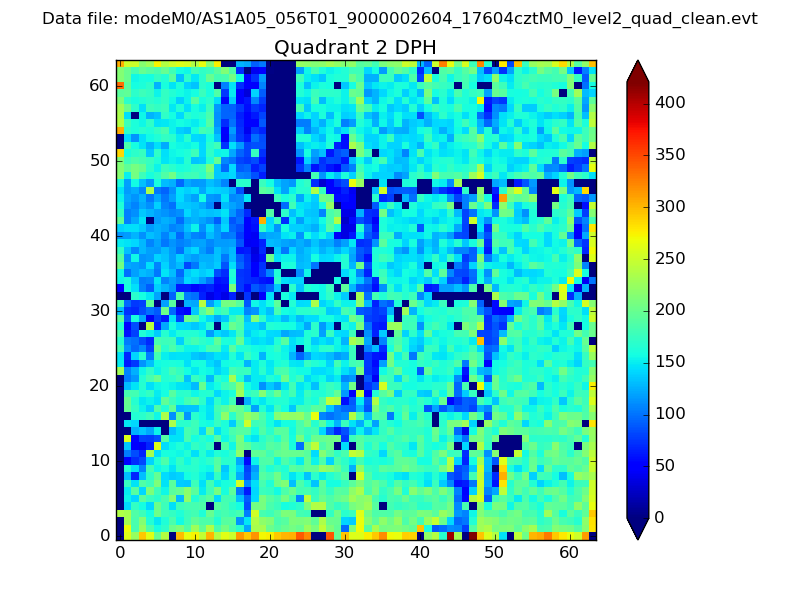
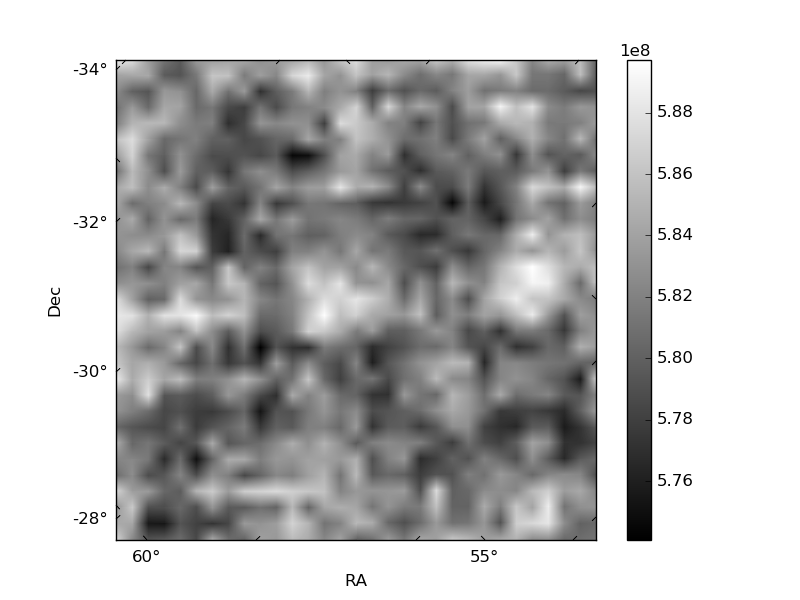
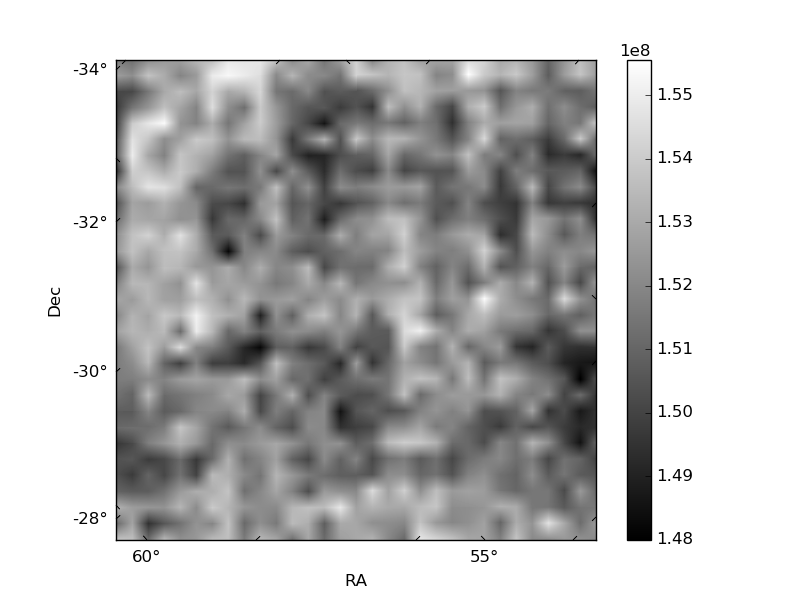
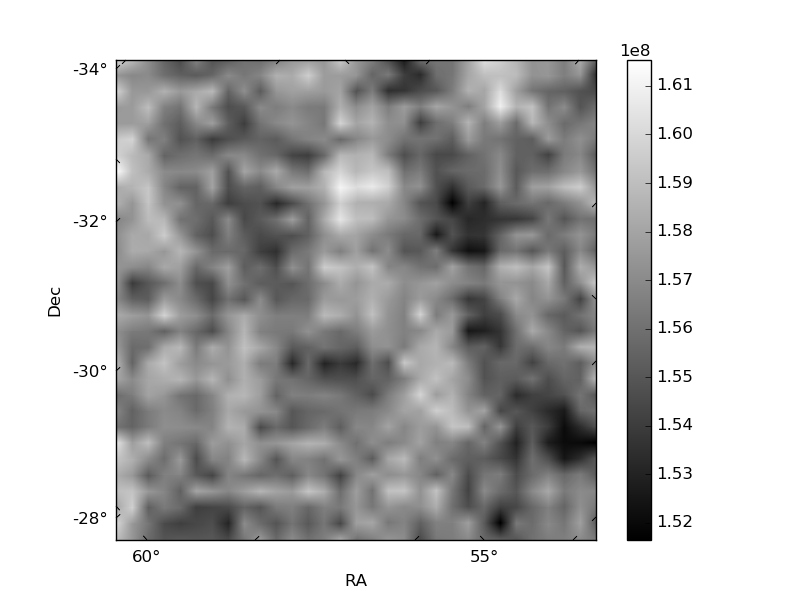
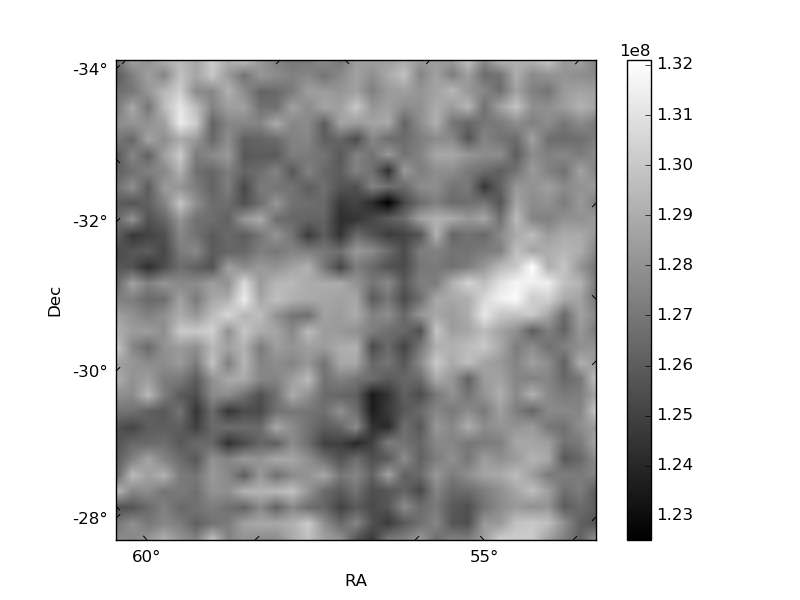
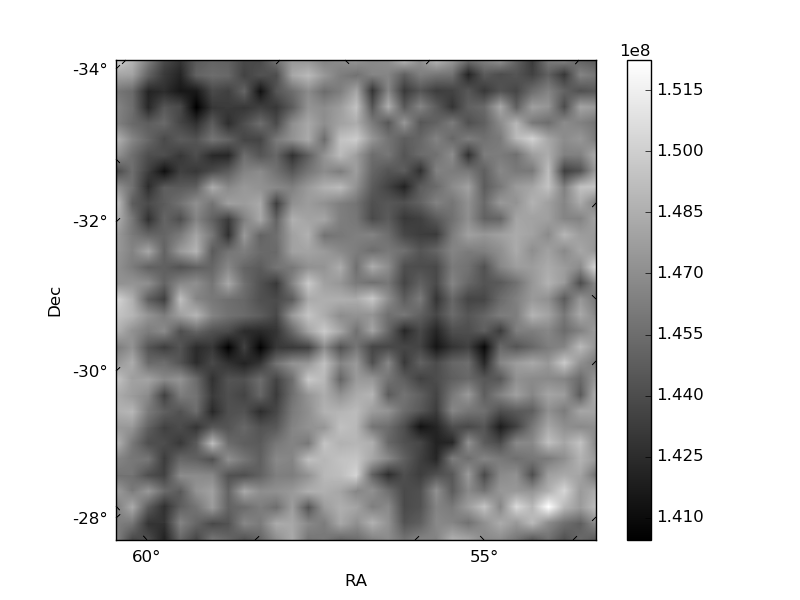
Histogram calculated using DETX and DETY for each event in the final _common_clean file
| Quadrant A | 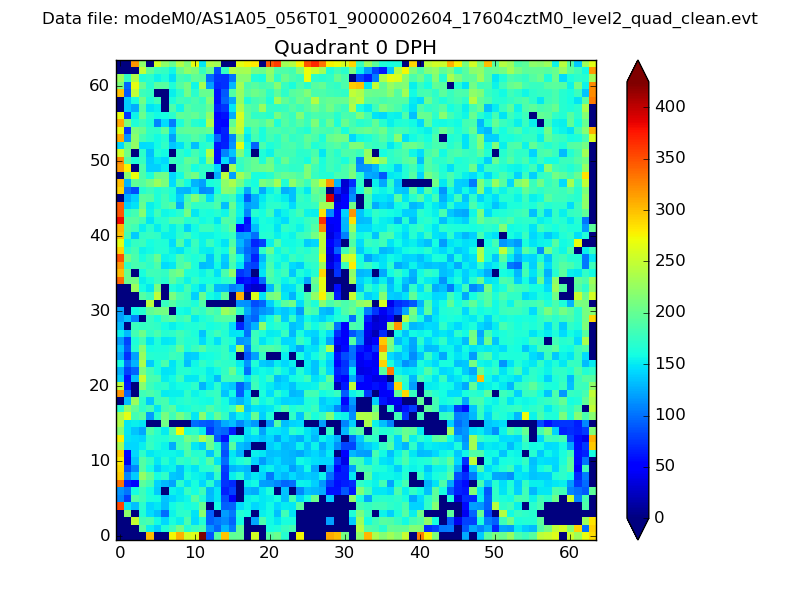 |
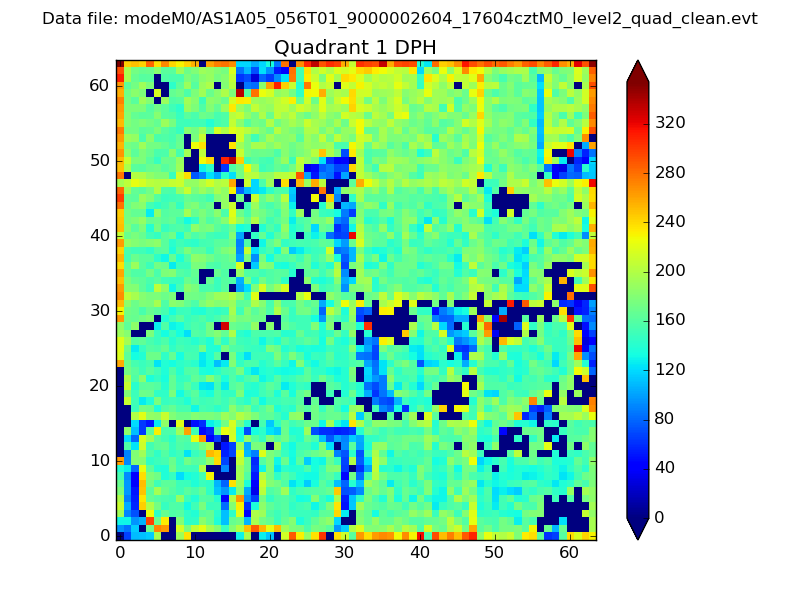 |
Quadrant B |
|---|---|---|---|
| Quadrant D | 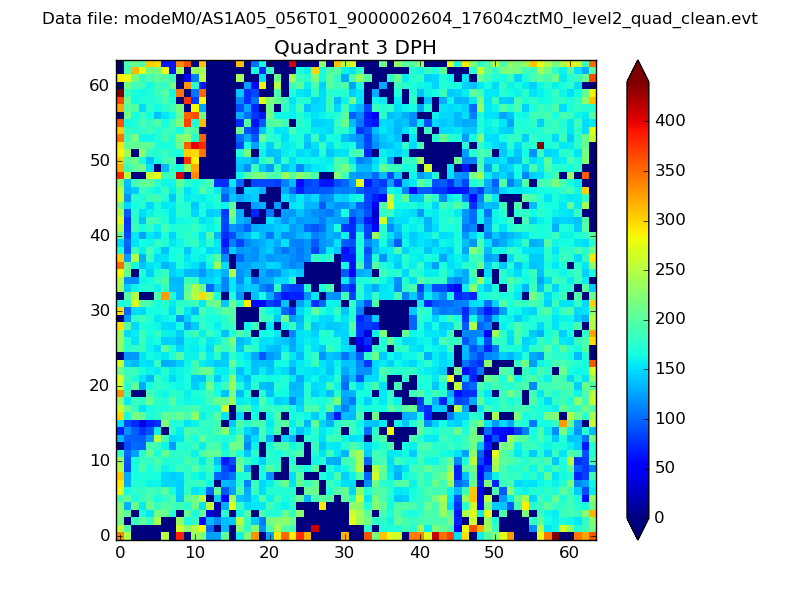 |
 |
Quadrant C |
| Plot type | Count rate plots | Images |
|---|---|---|
| Comparison with Poisson distribution Blue bars denote a histogram of data divided into 1 sec bins. Red curve is a Poisson curve with rate = median count rate of data. |
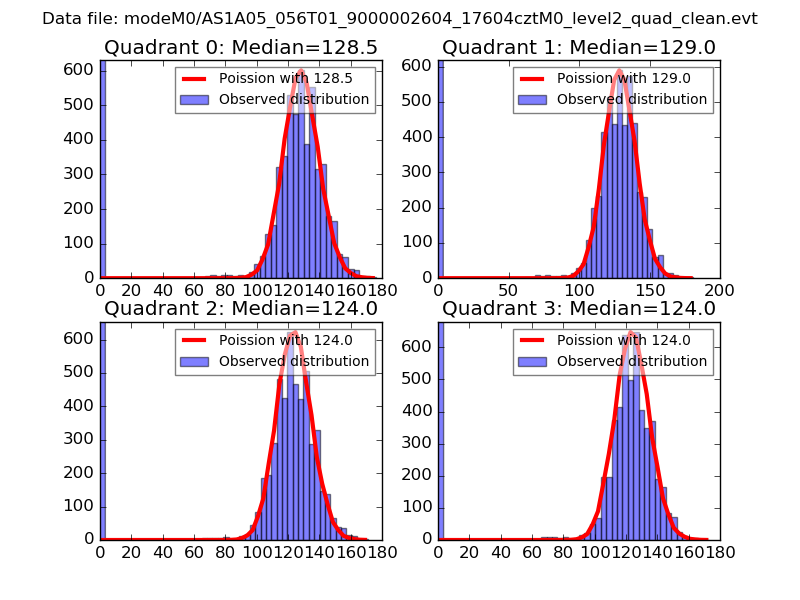 |
 |
| Quadrant-wise count rates Data is divided into 100 sec bins |
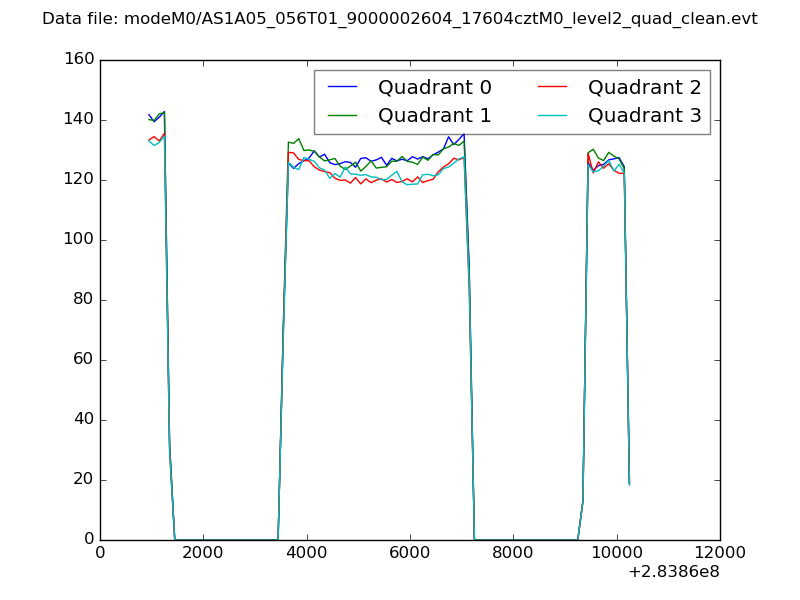 |
|
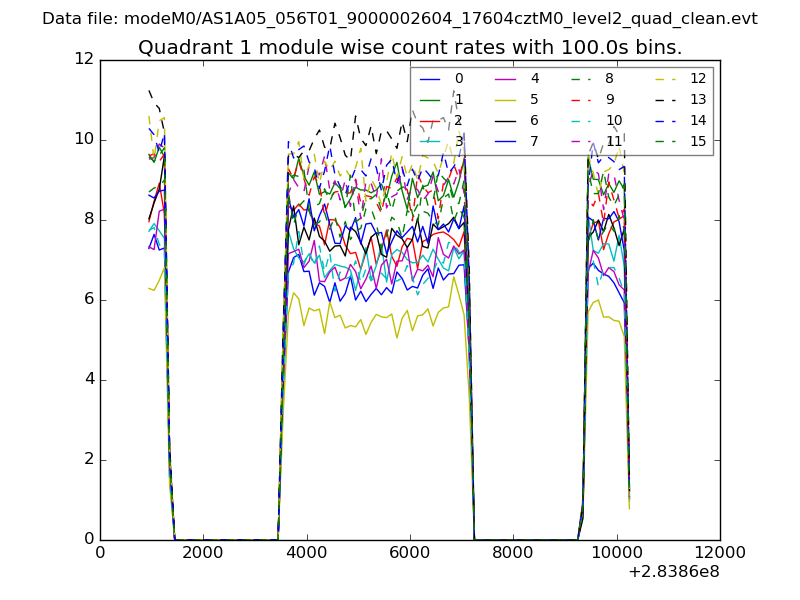
| Module-wise count rates for Quadrant A Data is divided into 100 sec bins |
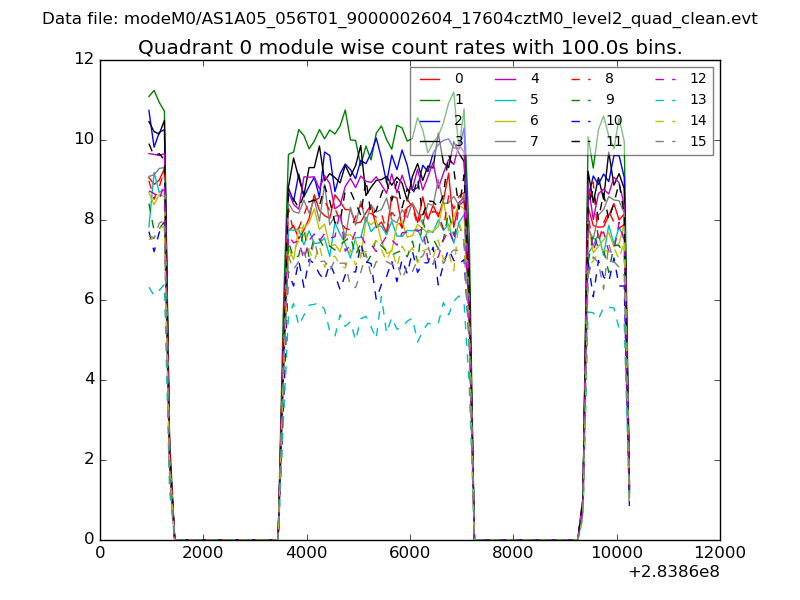 |
 |
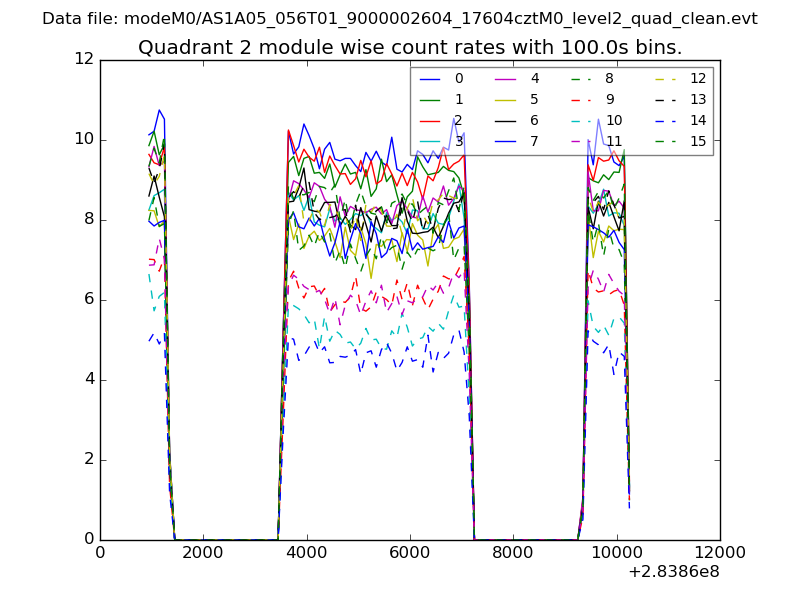
| Module-wise count rates for Quadrant B Data is divided into 100 sec bins |
 |
 |
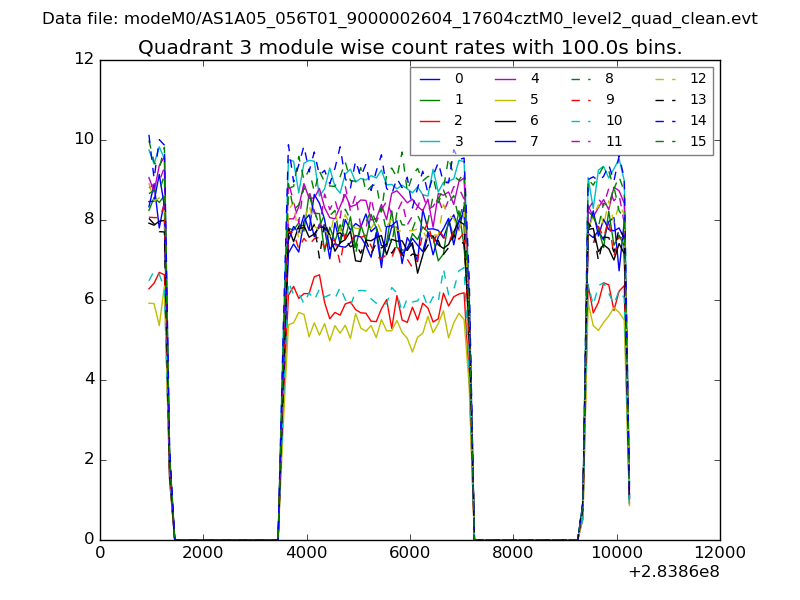
| Module-wise count rates for Quadrant C Data is divided into 100 sec bins |
 |
 |
| Module-wise count rates for Quadrant D Data is divided into 100 sec bins |
 |
 |
| Parameter | Plot |
|---|---|
| CZT HV Monitor | 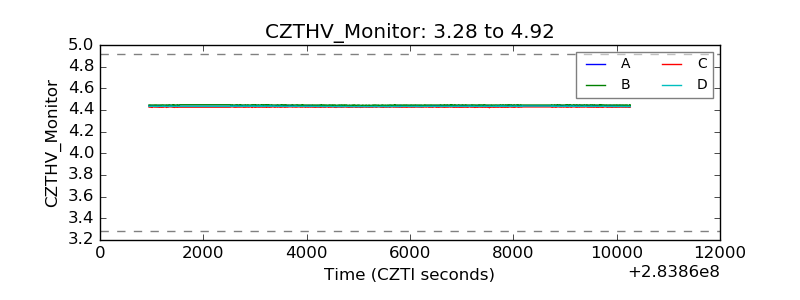 |
| D_VDD | 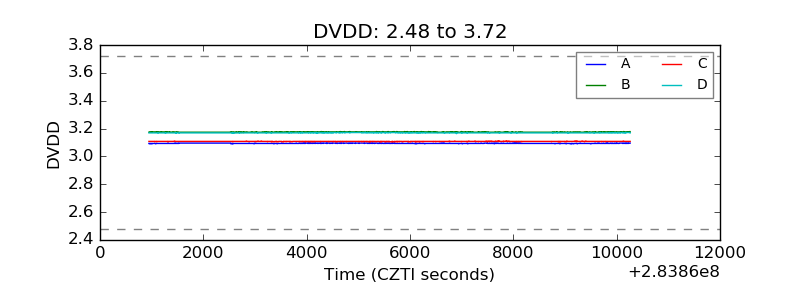 |
| Temperature 1 |  |
| Veto HV Monitor | 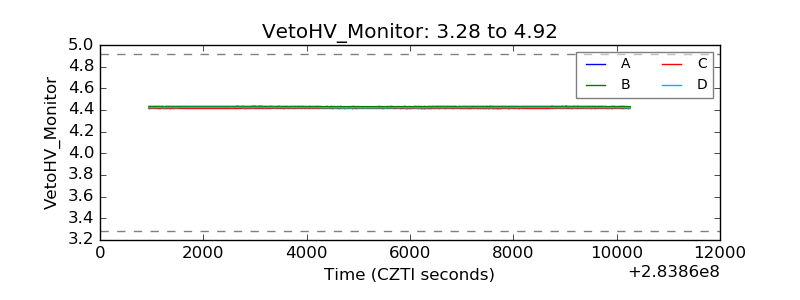 |
| Veto LLD |  |
| Alpha Counter | 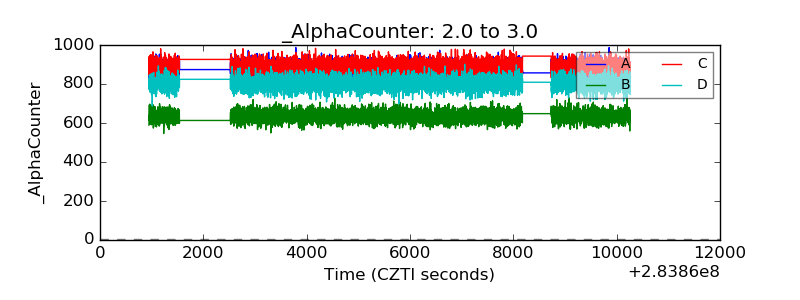 |
| _CPM_Rate | 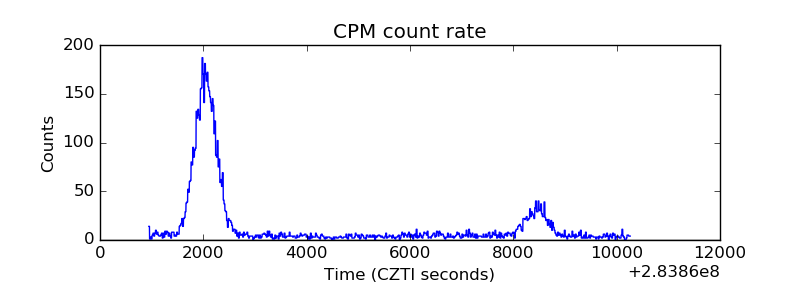 |
| CZT Counter | 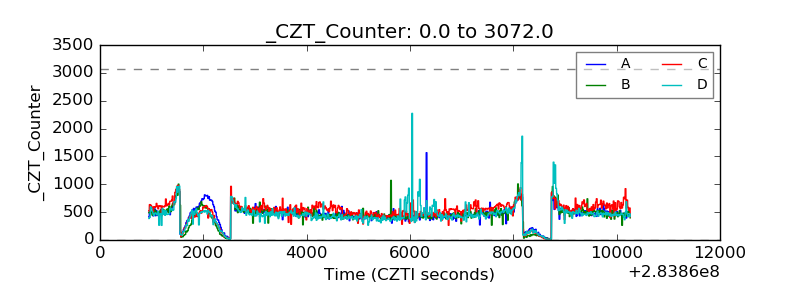 |
| +2.5 Volts monitor |  |
| +5 Volts monitor | 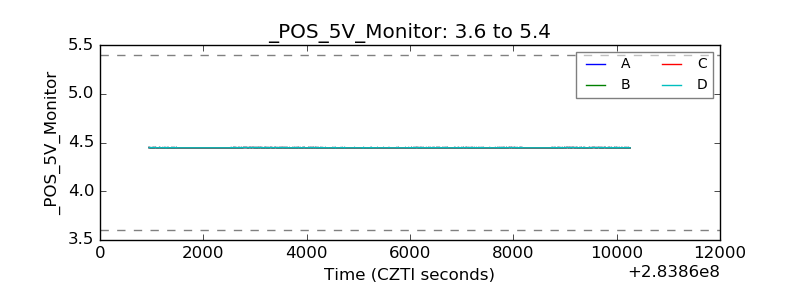 |
| _ROLL_ROT | 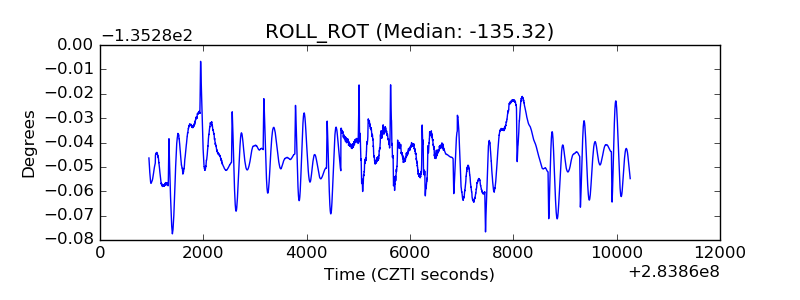 |
| _Roll_DEC | 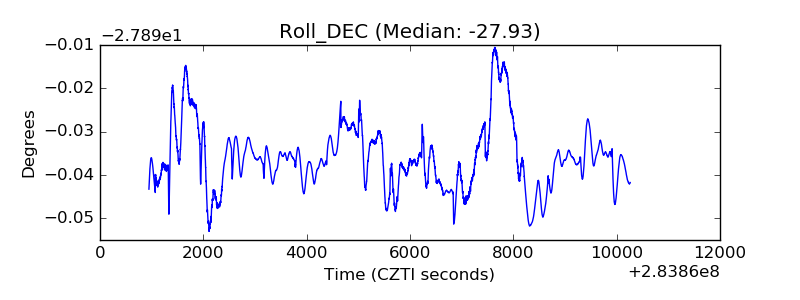 |
| _Roll_RA |  |
| Veto Counter | 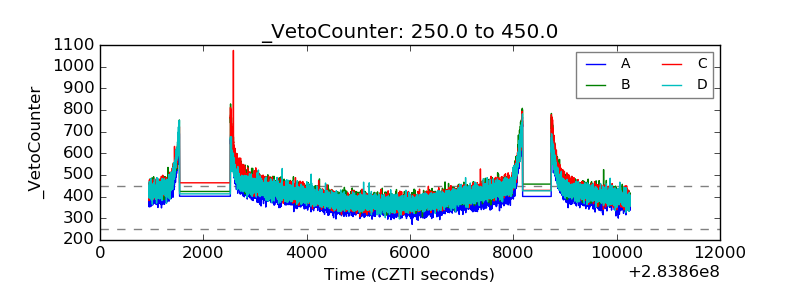 |