| Param | Original file | Final file |
|---|---|---|
| Filename | modeM0/AS1A05_056T01_9000002604_17605cztM0_level2.evt | modeM0/AS1A05_056T01_9000002604_17605cztM0_level2_quad_clean.evt |
| Size (bytes) | 561,280,320 | 95,915,520 |
| Size | 535.3 MB | 91.5 MB |
| Events in quadrant A | 3,754,611 | 603,113 |
| Events in quadrant B | 3,815,798 | 604,119 |
| Events in quadrant C | 5,191,740 | 576,325 |
| Events in quadrant D | 3,710,719 | 582,665 |
| Mode M9 | |||
|---|---|---|---|
| Quadrant | BADHDUFLAG | Total packets | Discarded packets |
| A | 0 | 8 | 0 |
| B | 0 | 8 | 0 |
| C | 0 | 8 | 0 |
| D | 0 | 8 | 0 |
| Mode M0 | |||
|---|---|---|---|
| Quadrant | BADHDUFLAG | Total packets | Discarded packets |
| A | 0 | 16244 | 3 |
| B | 0 | 16304 | 2 |
| C | 0 | 21057 | 2 |
| D | 0 | 16429 | 2 |
| Mode SS | |||
|---|---|---|---|
| Quadrant | BADHDUFLAG | Total packets | Discarded packets |
| A | 0 | 160 | 0 |
| B | 0 | 160 | 0 |
| C | 0 | 160 | 0 |
| D | 0 | 160 | 0 |
| Quadrant | Total seconds | Saturated seconds | Saturation percentage |
|---|---|---|---|
| A | 7737 | 252 | 3.257076% |
| B | 7738 | 287 | 3.708969% |
| C | 7738 | 388 | 5.014216% |
| D | 7738 | 166 | 2.145257% |
Noise dominated data is calculated using 1-second bins in cleaned event files. If a bin has >2000 counts, and if more than 50% of those come from <1% of pixels, then it is considered to be noise-dominated and hence unusable.
| Quadrant | # 1 sec bins | Bins with >0 counts | Bins with >2000 counts | High rate bins dominated by noise | Noise dominated (total time) | Noise dominated (detector-on time) | Marked lightcurve |
|---|---|---|---|---|---|---|---|
| A | 8527 | 7737 | 0 | 0 | 0.00% | 0.00% | 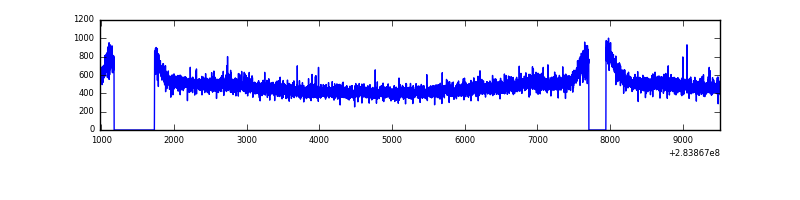 |
| B | 8528 | 7738 | 2 | 2 | 0.02% | 0.03% | 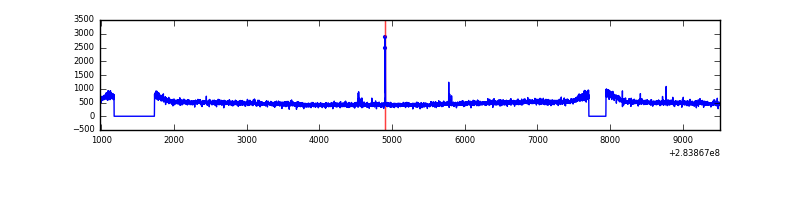 |
| C | 8528 | 7739 | 1 | 1 | 0.01% | 0.01% | 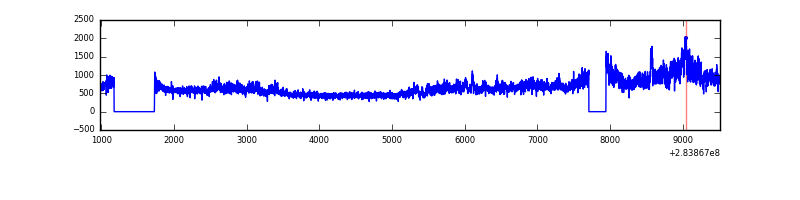 |
| D | 8528 | 7739 | 16 | 16 | 0.19% | 0.21% | 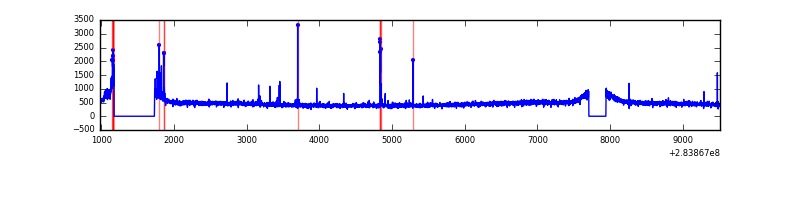 |
Top three noisy pixels from each quadrant. If the there are fewer than three noisy pixels in the level2.evt file, extra rows are filled as -1
| Pixel properties | Quadrant properties | ||||||
|---|---|---|---|---|---|---|---|
| Quadrant | DetID | PixID | Counts | Sigma | Mean | Median | Sigma |
| A | 15 | 191 | 12591 | 58.9 | 972 | 952 | 197.6 |
| A | 0 | 226 | 8374 | 37.56 | 972 | 952 | 197.6 |
| A | 3 | 137 | 7840 | 34.86 | 972 | 952 | 197.6 |
| B | 12 | 111 | 23701 | 120.99 | 967 | 944 | 188.1 |
| B | 11 | 111 | 20382 | 103.35 | 967 | 944 | 188.1 |
| B | 14 | 111 | 17539 | 88.23 | 967 | 944 | 188.1 |
| C | 3 | 233 | 1384989 | 6382.98 | 924 | 926 | 216.8 |
| C | 14 | 238 | 140821 | 645.16 | 924 | 926 | 216.8 |
| C | 5 | 218 | 61929 | 281.33 | 924 | 926 | 216.8 |
| D | 12 | 227 | 92275 | 394.44 | 948 | 920 | 231.6 |
| D | 2 | 234 | 28834 | 120.52 | 948 | 920 | 231.6 |
| D | 15 | 145 | 25896 | 107.84 | 948 | 920 | 231.6 |
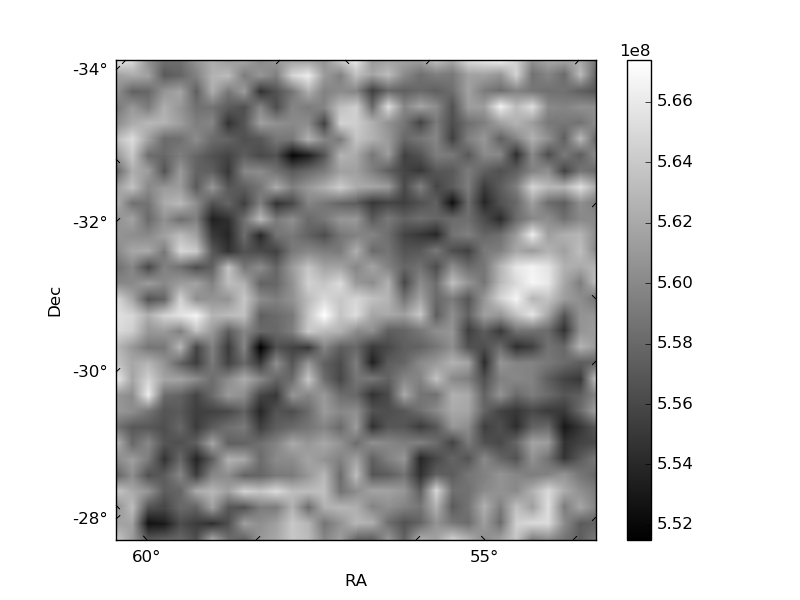
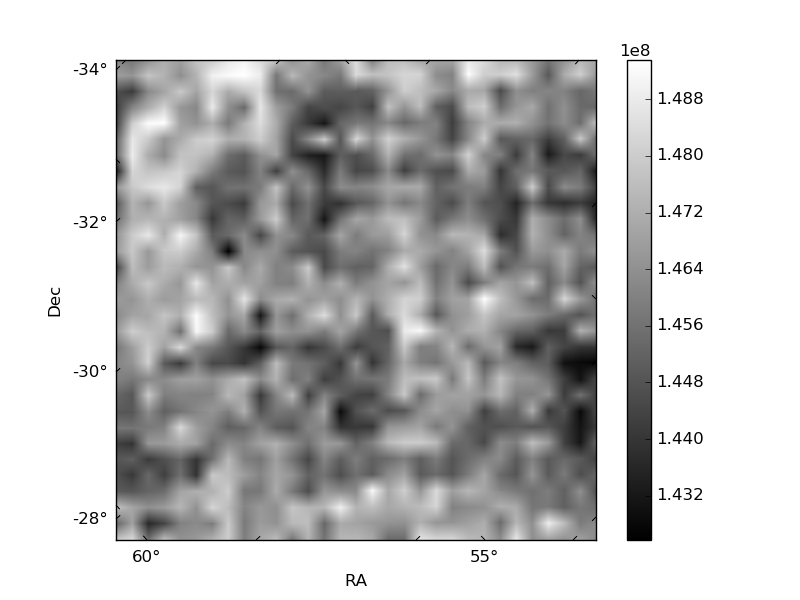
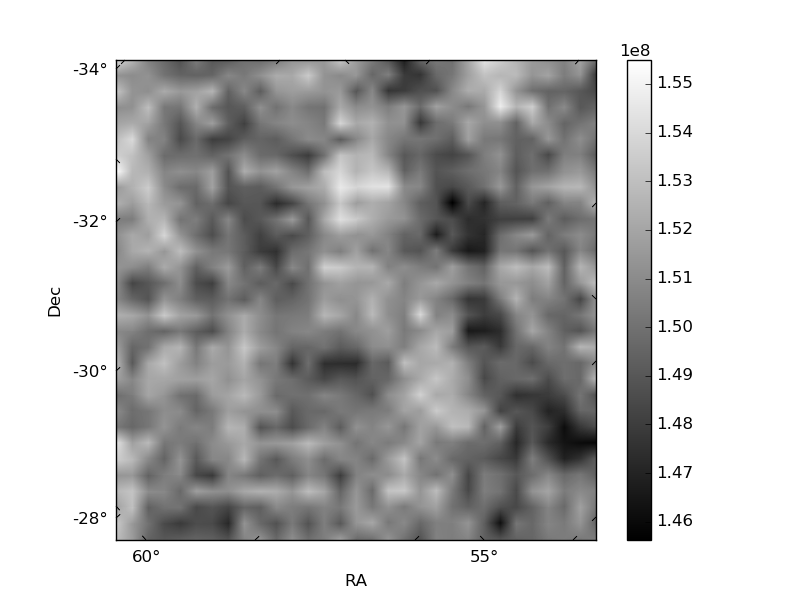
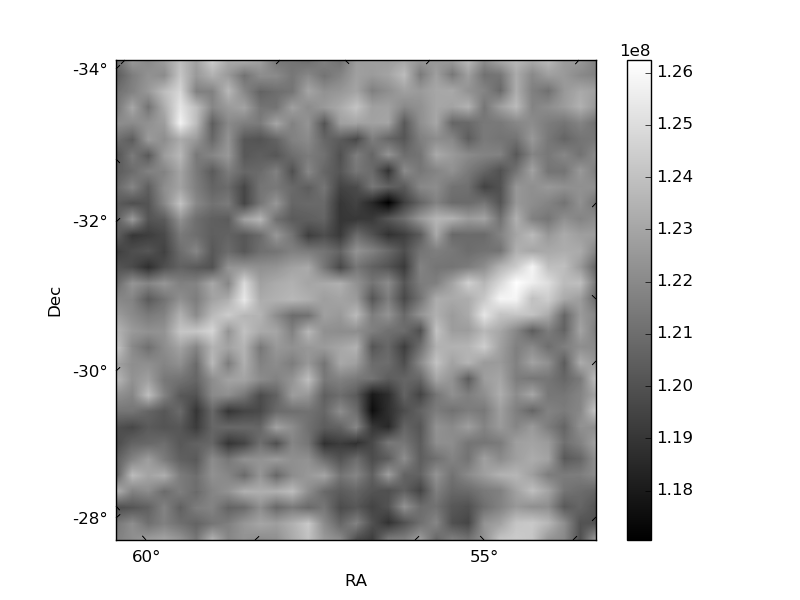
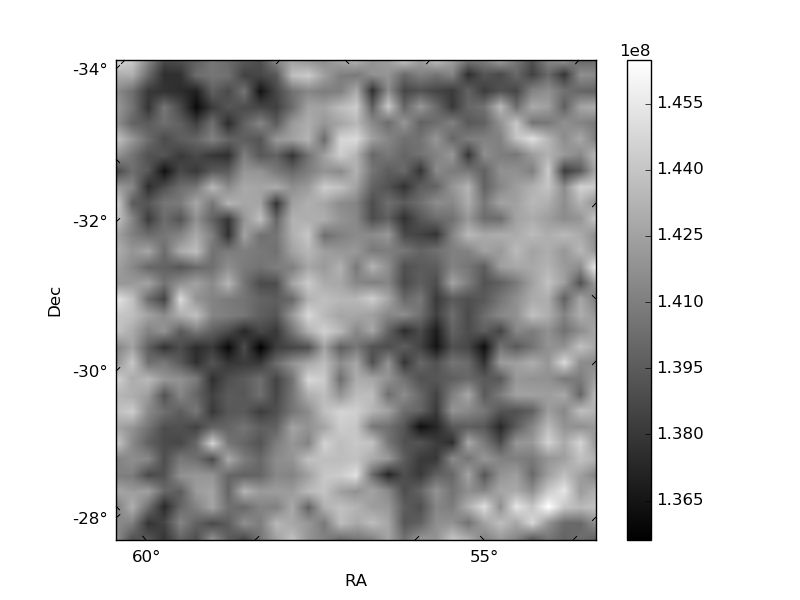
Histogram calculated using DETX and DETY for each event in the final _common_clean file
| Quadrant A | 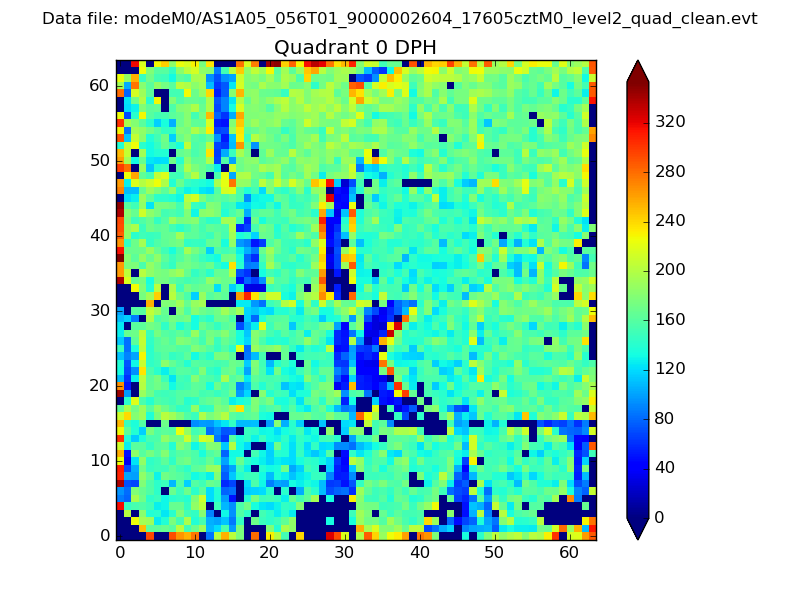 |
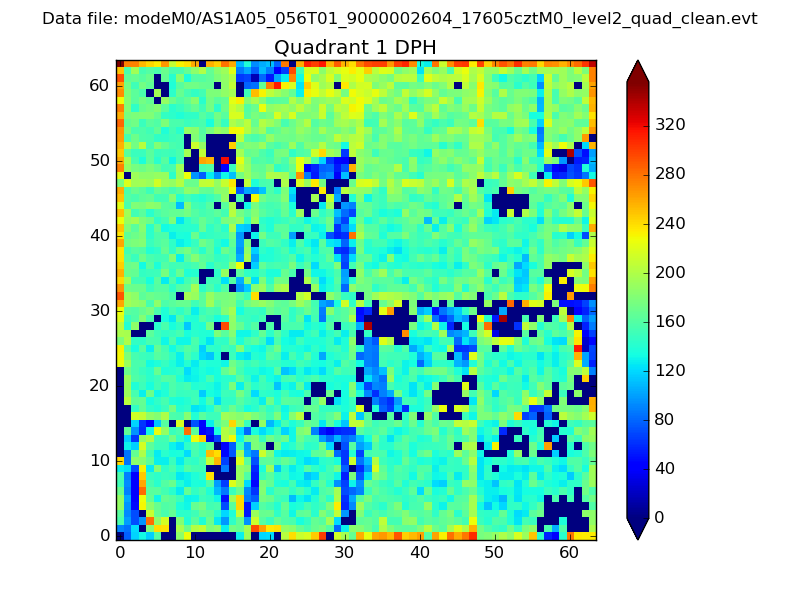 |
Quadrant B |
|---|---|---|---|
| Quadrant D | 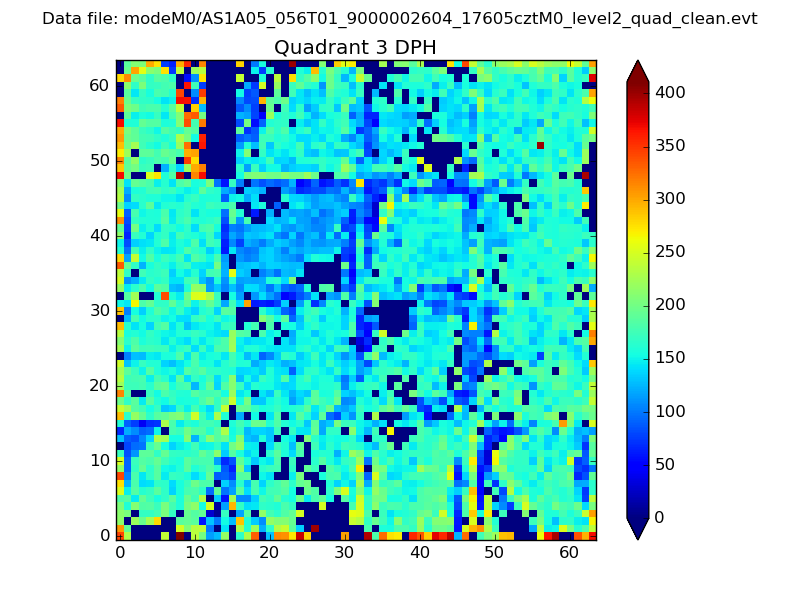 |
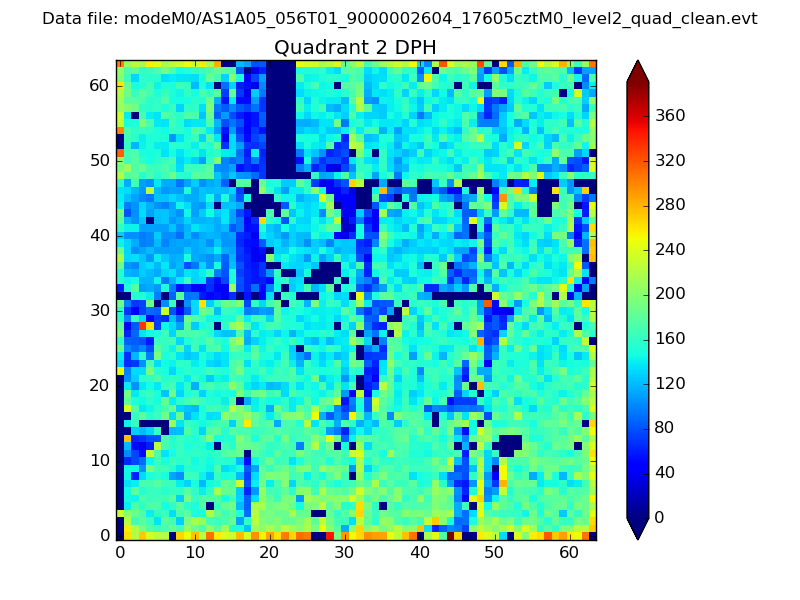 |
Quadrant C |
| Plot type | Count rate plots | Images |
|---|---|---|
| Comparison with Poisson distribution Blue bars denote a histogram of data divided into 1 sec bins. Red curve is a Poisson curve with rate = median count rate of data. |
 |
 |
| Quadrant-wise count rates Data is divided into 100 sec bins |
 |
|
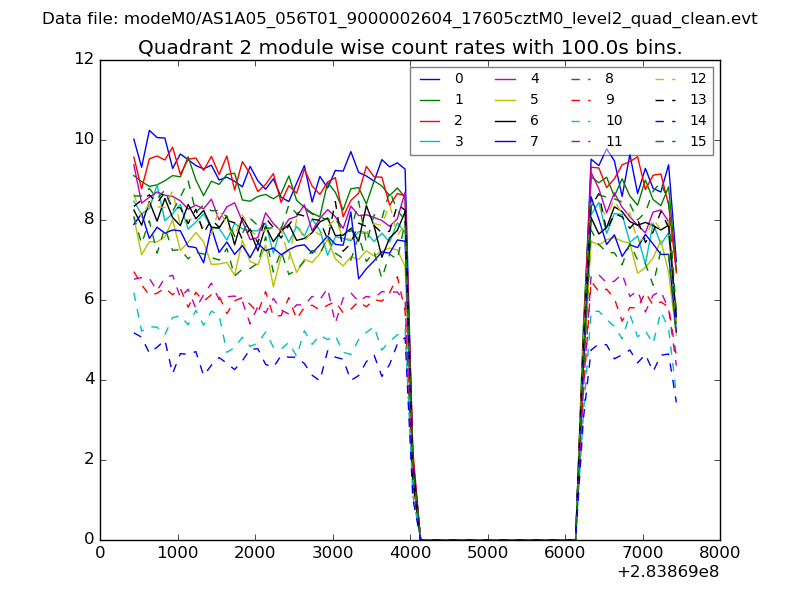
| Module-wise count rates for Quadrant A Data is divided into 100 sec bins |
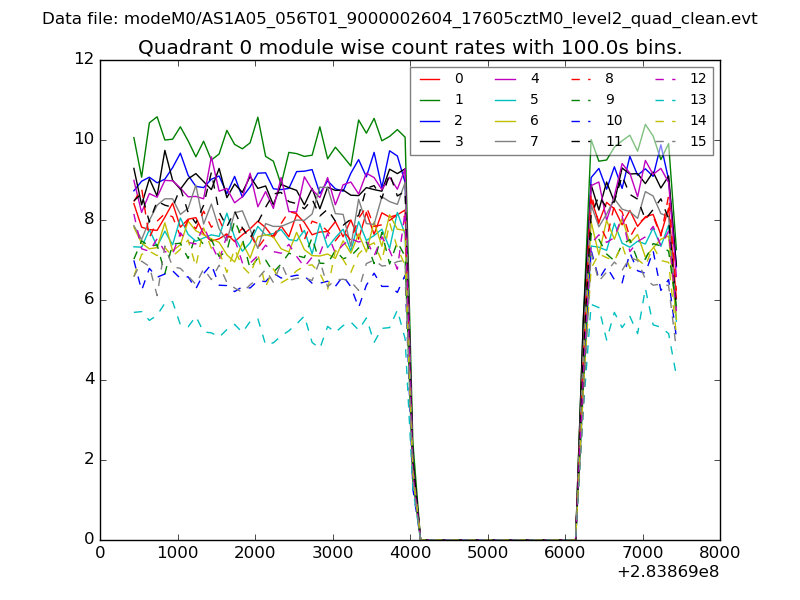 |
 |
| Module-wise count rates for Quadrant B Data is divided into 100 sec bins |
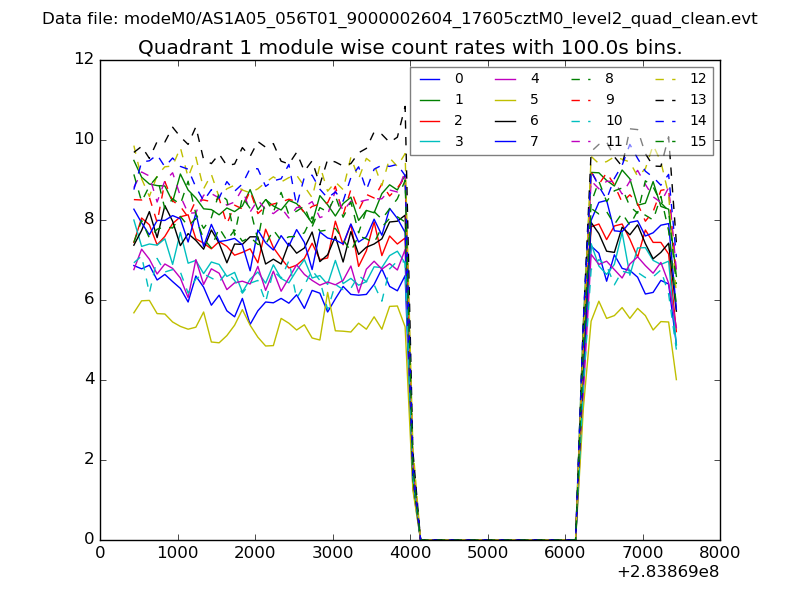 |
 |
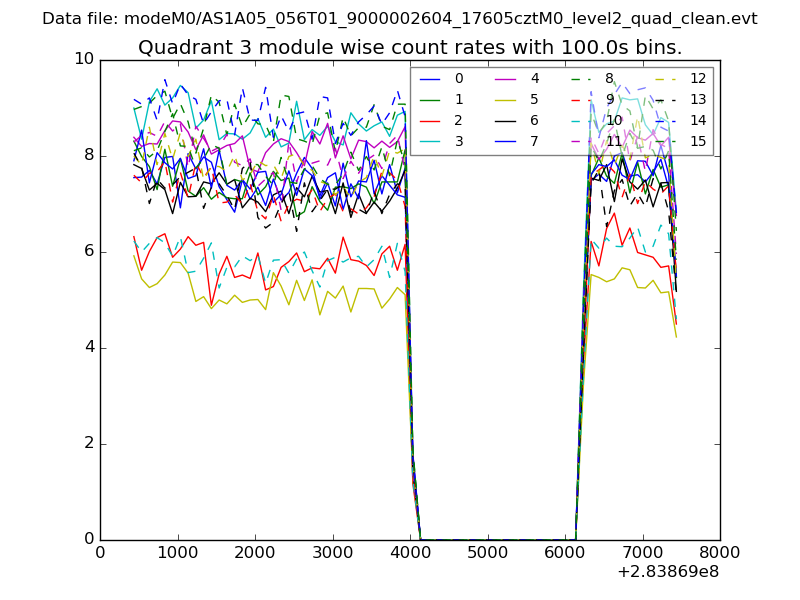
| Module-wise count rates for Quadrant C Data is divided into 100 sec bins |
 |
 |
| Module-wise count rates for Quadrant D Data is divided into 100 sec bins |
 |
 |
| Parameter | Plot |
|---|---|
| CZT HV Monitor | 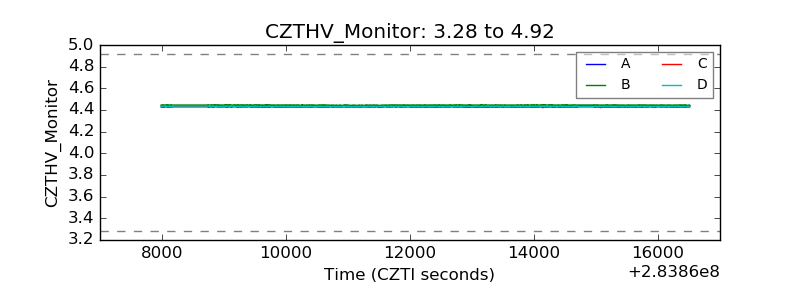 |
| D_VDD | 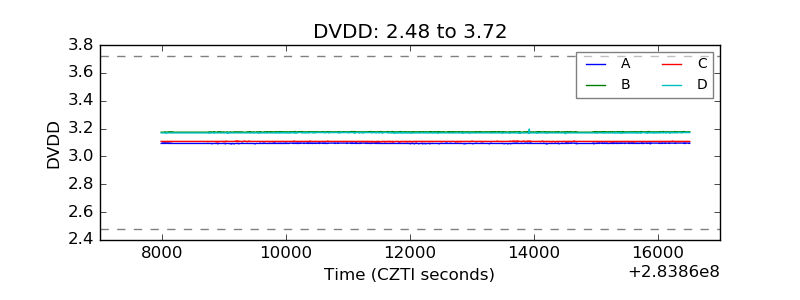 |
| Temperature 1 | 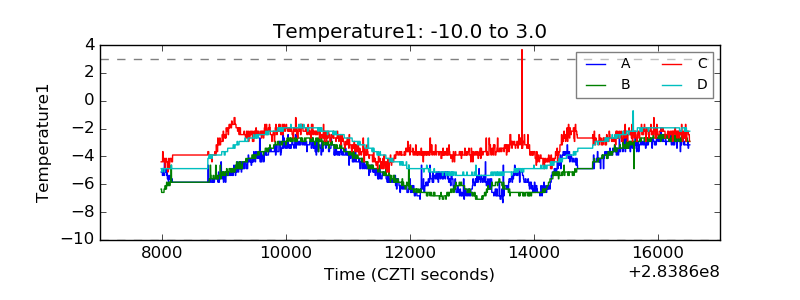 |
| Veto HV Monitor | 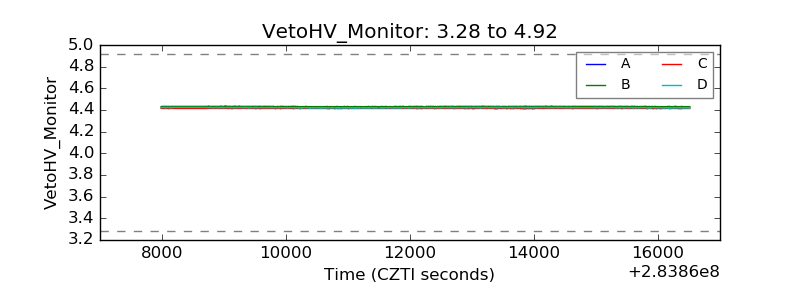 |
| Veto LLD | 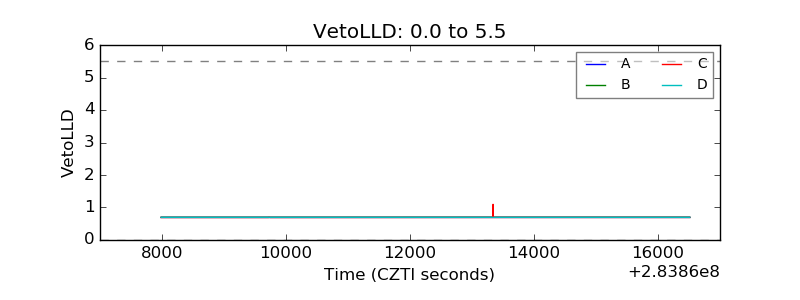 |
| Alpha Counter | 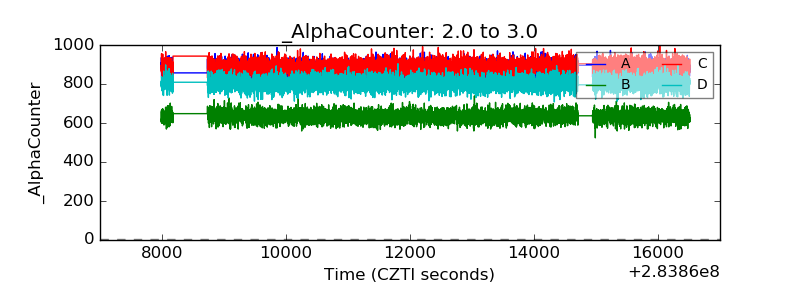 |
| _CPM_Rate |  |
| CZT Counter | 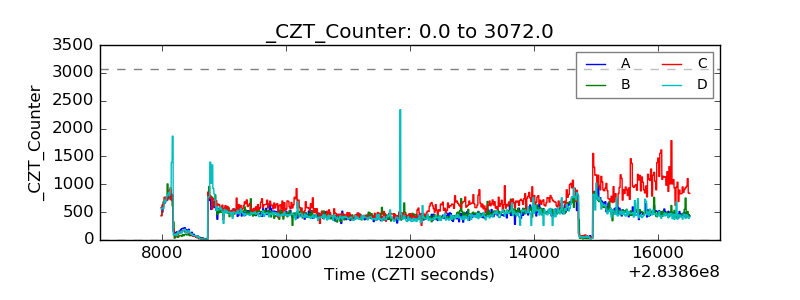 |
| +2.5 Volts monitor |  |
| +5 Volts monitor | 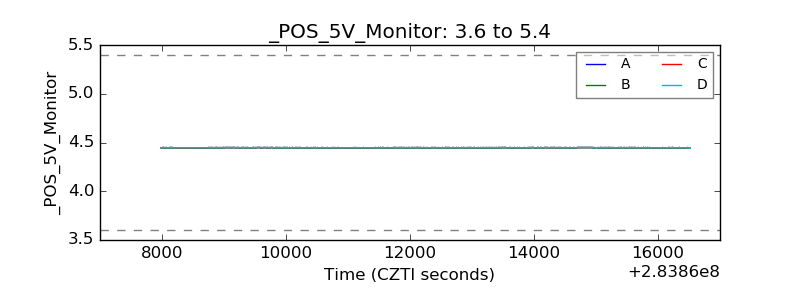 |
| _ROLL_ROT | 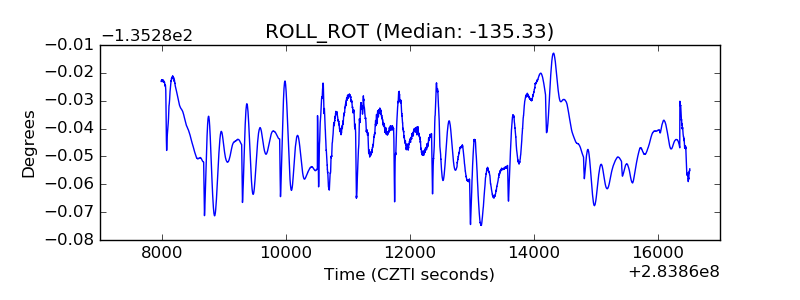 |
| _Roll_DEC | 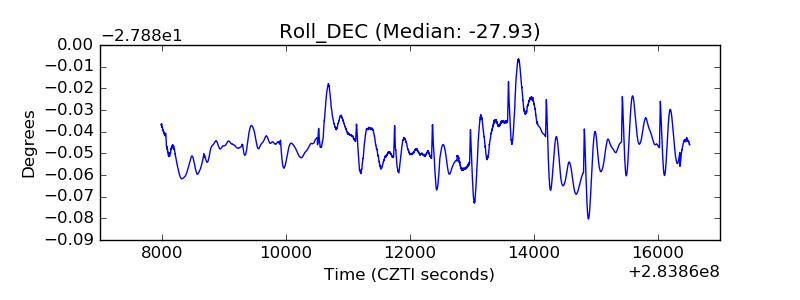 |
| _Roll_RA | 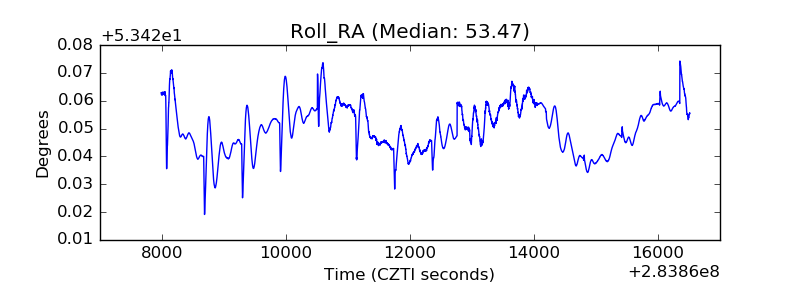 |
| Veto Counter | 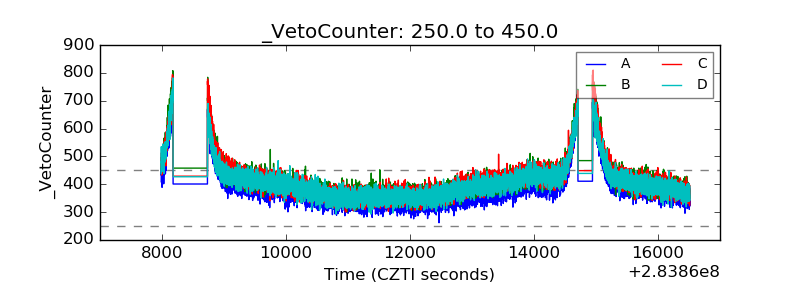 |