| Param | Original file | Final file |
|---|---|---|
| Filename | modeM0/AS1A05_056T01_9000002604_17606cztM0_level2.evt | modeM0/AS1A05_056T01_9000002604_17606cztM0_level2_quad_clean.evt |
| Size (bytes) | 528,972,480 | 100,301,760 |
| Size | 504.5 MB | 95.7 MB |
| Events in quadrant A | 3,451,423 | 648,024 |
| Events in quadrant B | 3,480,826 | 645,609 |
| Events in quadrant C | 5,304,565 | 612,289 |
| Events in quadrant D | 3,284,812 | 620,490 |
| Mode M9 | |||
|---|---|---|---|
| Quadrant | BADHDUFLAG | Total packets | Discarded packets |
| A | 0 | 4 | 0 |
| B | 0 | 4 | 0 |
| C | 0 | 4 | 0 |
| D | 0 | 4 | 0 |
| Mode M0 | |||
|---|---|---|---|
| Quadrant | BADHDUFLAG | Total packets | Discarded packets |
| A | 0 | 15107 | 1 |
| B | 0 | 15063 | 1 |
| C | 0 | 21451 | 1 |
| D | 0 | 15026 | 1 |
| Mode SS | |||
|---|---|---|---|
| Quadrant | BADHDUFLAG | Total packets | Discarded packets |
| A | 0 | 148 | 0 |
| B | 0 | 148 | 0 |
| C | 0 | 148 | 0 |
| D | 0 | 148 | 0 |
| Quadrant | Total seconds | Saturated seconds | Saturation percentage |
|---|---|---|---|
| A | 7347 | 24 | 0.326664% |
| B | 7348 | 46 | 0.626021% |
| C | 7348 | 151 | 2.054981% |
| D | 7348 | 16 | 0.217746% |
Noise dominated data is calculated using 1-second bins in cleaned event files. If a bin has >2000 counts, and if more than 50% of those come from <1% of pixels, then it is considered to be noise-dominated and hence unusable.
| Quadrant | # 1 sec bins | Bins with >0 counts | Bins with >2000 counts | High rate bins dominated by noise | Noise dominated (total time) | Noise dominated (detector-on time) | Marked lightcurve |
|---|---|---|---|---|---|---|---|
| A | 7722 | 7349 | 1 | 1 | 0.01% | 0.01% | 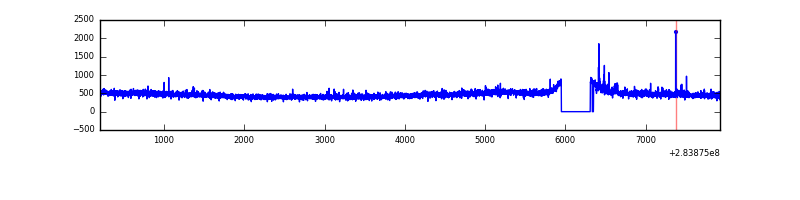 |
| B | 7723 | 7350 | 0 | 0 | 0.00% | 0.00% | 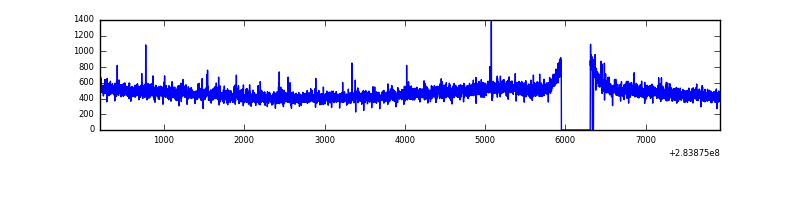 |
| C | 7723 | 7350 | 1 | 1 | 0.01% | 0.01% | 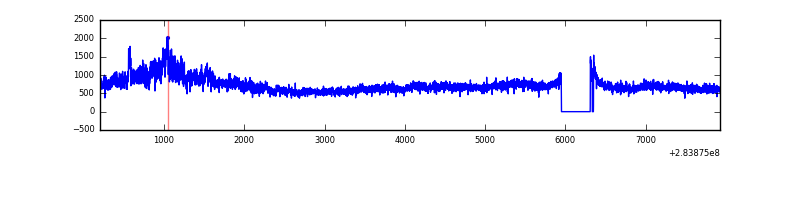 |
| D | 7723 | 7350 | 6 | 6 | 0.08% | 0.08% | 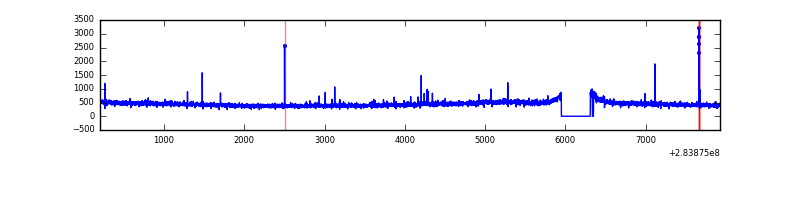 |
Top three noisy pixels from each quadrant. If the there are fewer than three noisy pixels in the level2.evt file, extra rows are filled as -1
| Pixel properties | Quadrant properties | ||||||
|---|---|---|---|---|---|---|---|
| Quadrant | DetID | PixID | Counts | Sigma | Mean | Median | Sigma |
| A | 14 | 237 | 35589 | 193.3 | 885 | 865 | 179.6 |
| A | 0 | 13 | 12526 | 64.91 | 885 | 865 | 179.6 |
| A | 0 | 226 | 7805 | 38.63 | 885 | 865 | 179.6 |
| B | 12 | 111 | 20879 | 116.42 | 881 | 860 | 172.0 |
| B | 11 | 111 | 18041 | 99.92 | 881 | 860 | 172.0 |
| B | 14 | 111 | 15467 | 84.95 | 881 | 860 | 172.0 |
| C | 3 | 233 | 1840588 | 9346.13 | 838 | 842 | 196.8 |
| C | 14 | 238 | 130456 | 658.45 | 838 | 842 | 196.8 |
| C | 5 | 218 | 60779 | 304.49 | 838 | 842 | 196.8 |
| D | 2 | 234 | 28451 | 131.28 | 857 | 832 | 210.4 |
| D | 7 | 223 | 18335 | 83.2 | 857 | 832 | 210.4 |
| D | 2 | 120 | 8965 | 38.66 | 857 | 832 | 210.4 |
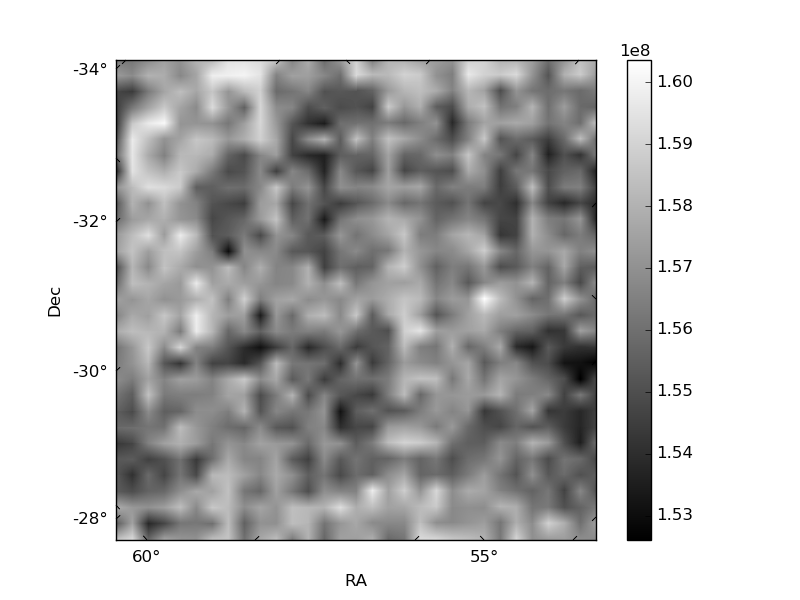
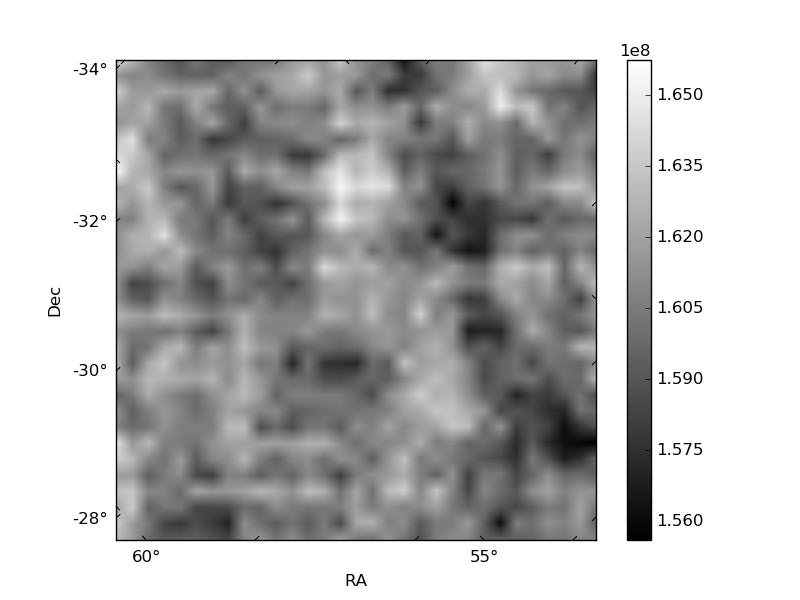
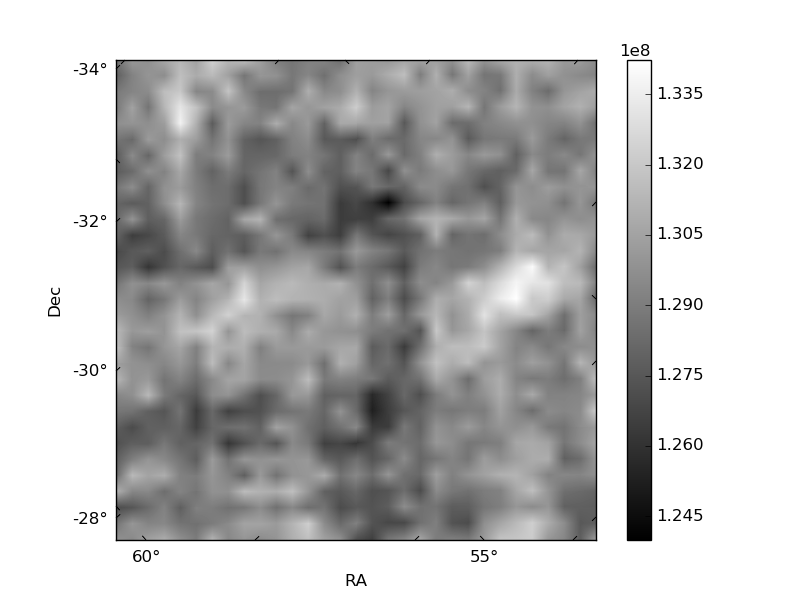
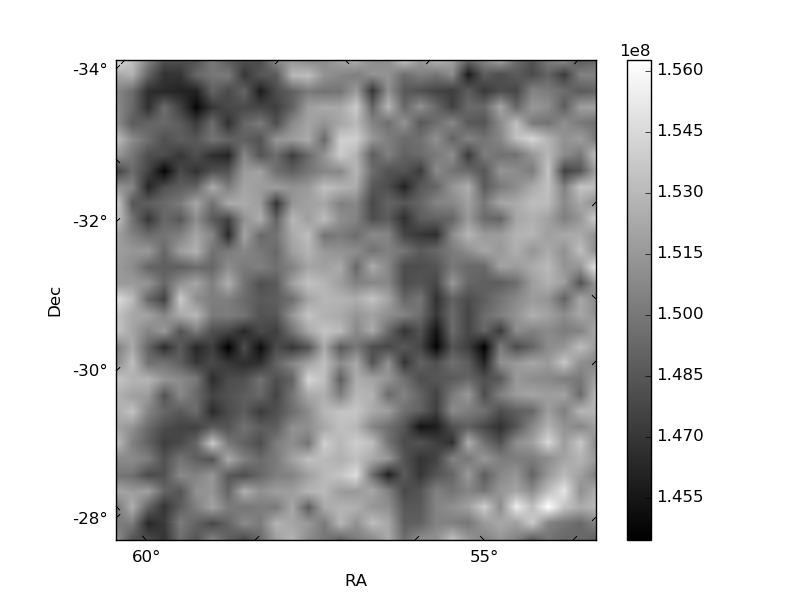
Histogram calculated using DETX and DETY for each event in the final _common_clean file
| Quadrant A | 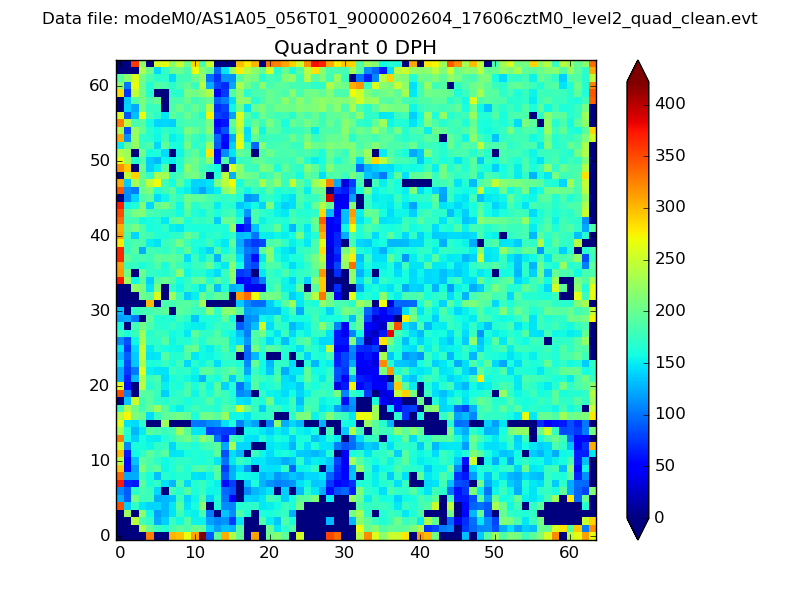 |
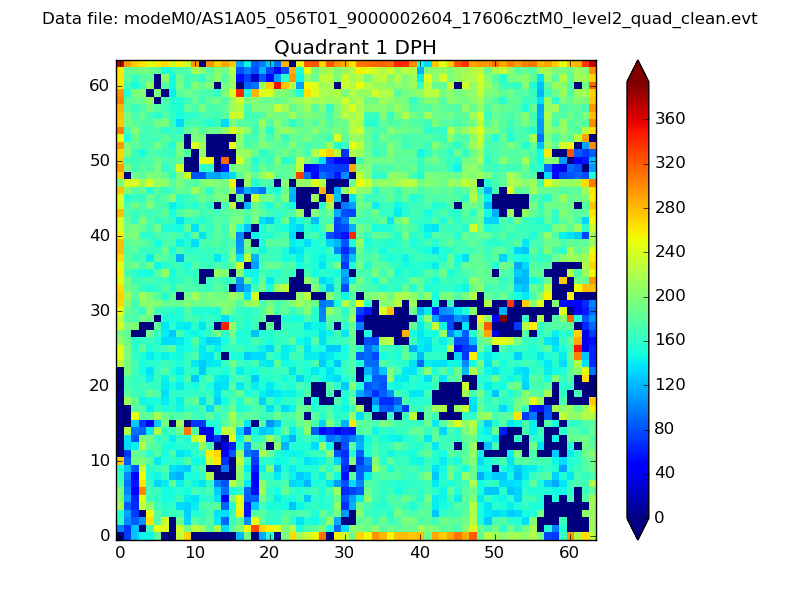 |
Quadrant B |
|---|---|---|---|
| Quadrant D |  |
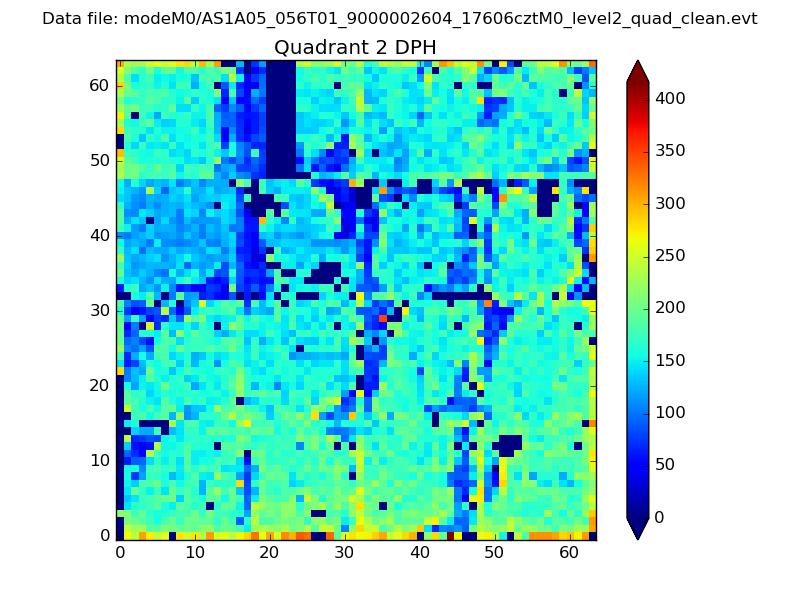 |
Quadrant C |
| Plot type | Count rate plots | Images |
|---|---|---|
| Comparison with Poisson distribution Blue bars denote a histogram of data divided into 1 sec bins. Red curve is a Poisson curve with rate = median count rate of data. |
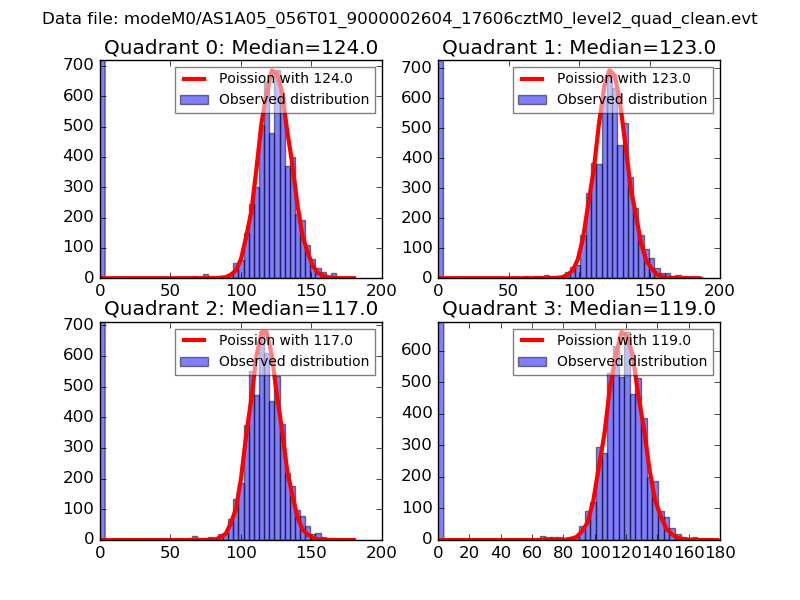 |
 |
| Quadrant-wise count rates Data is divided into 100 sec bins |
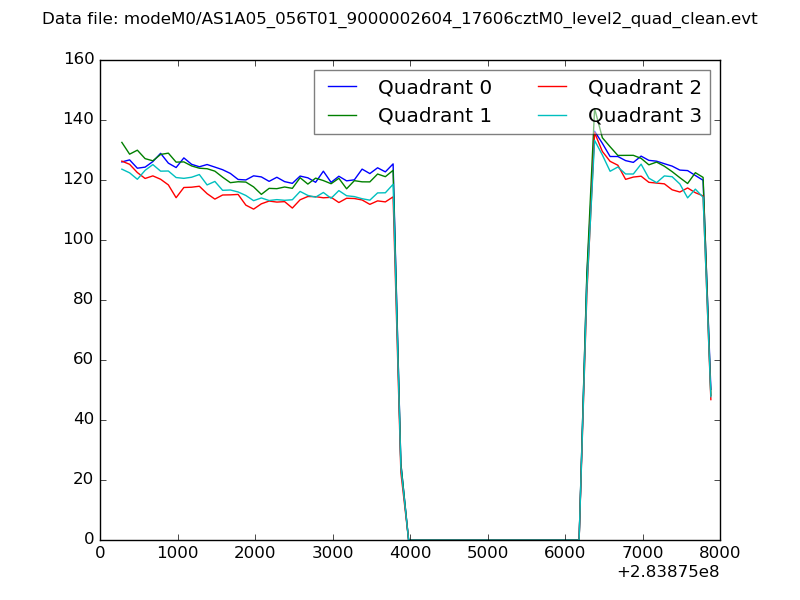 |
|
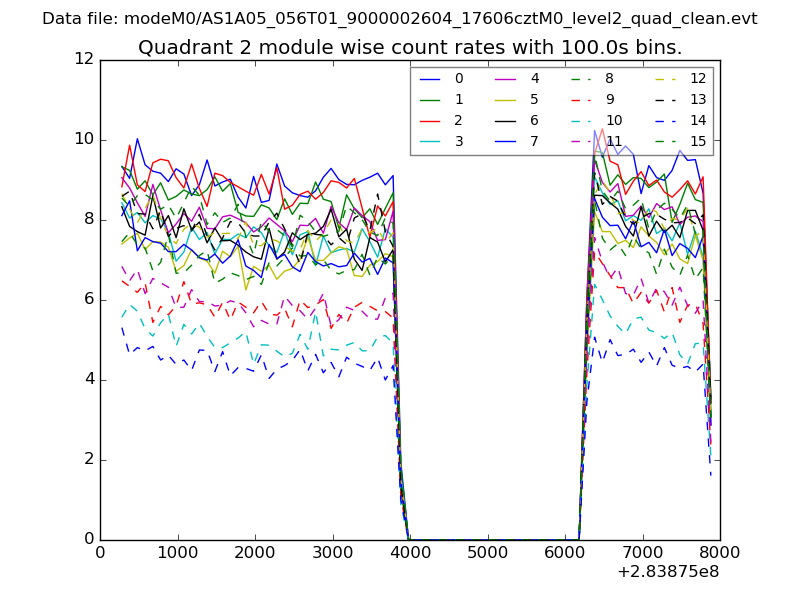
| Module-wise count rates for Quadrant A Data is divided into 100 sec bins |
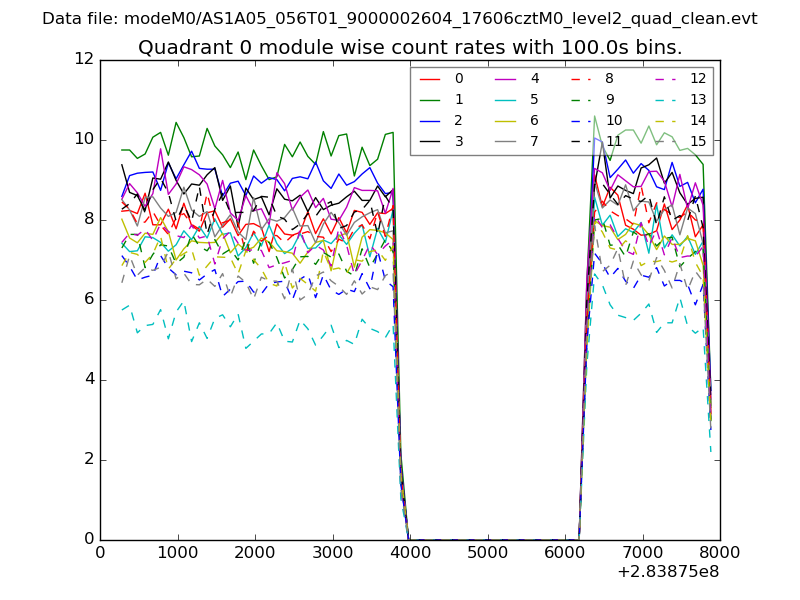 |
 |
| Module-wise count rates for Quadrant B Data is divided into 100 sec bins |
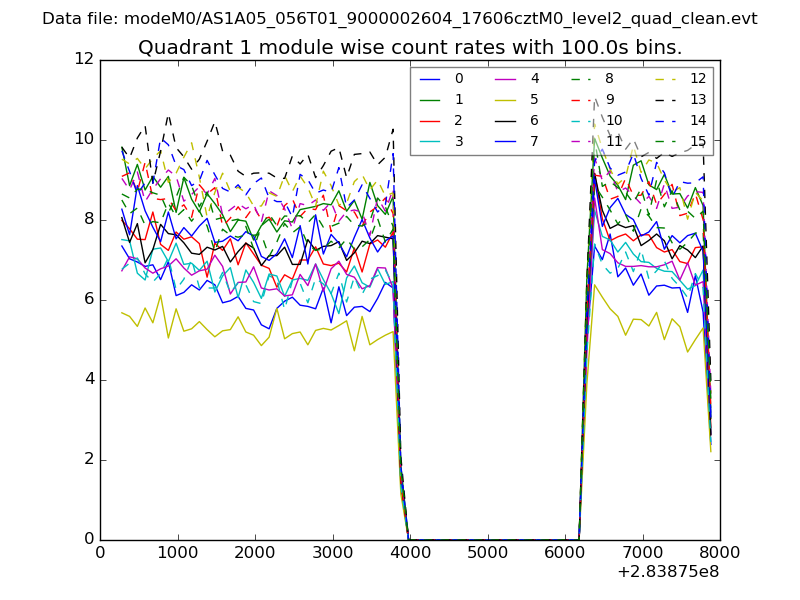 |
 |
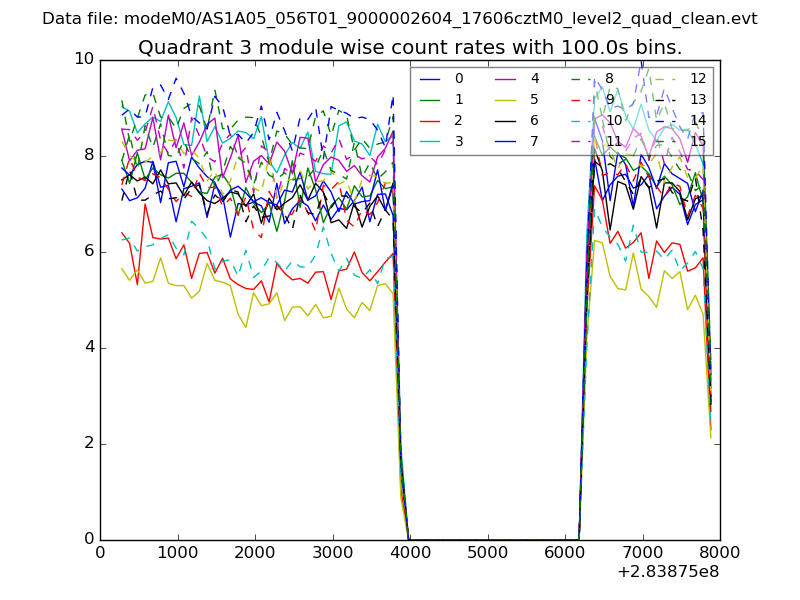
| Module-wise count rates for Quadrant C Data is divided into 100 sec bins |
 |
 |
| Module-wise count rates for Quadrant D Data is divided into 100 sec bins |
 |
 |
| Parameter | Plot |
|---|---|
| CZT HV Monitor | 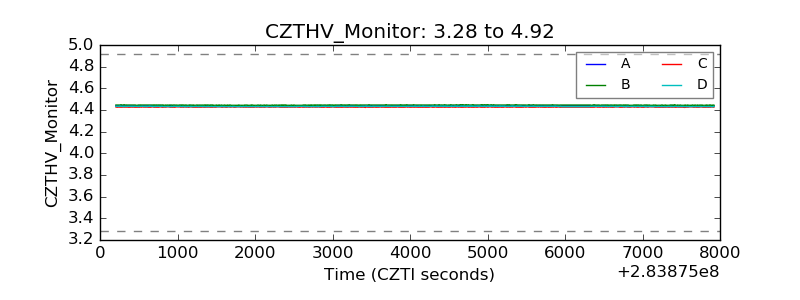 |
| D_VDD | 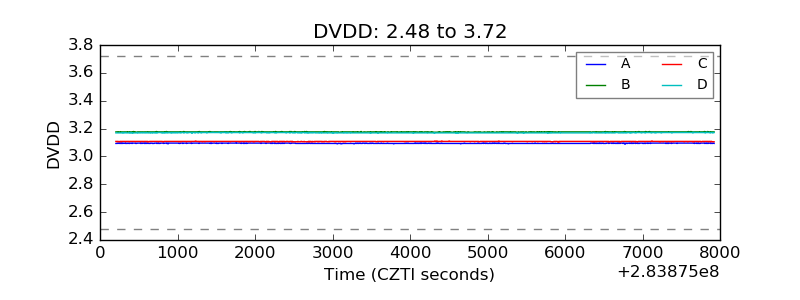 |
| Temperature 1 | 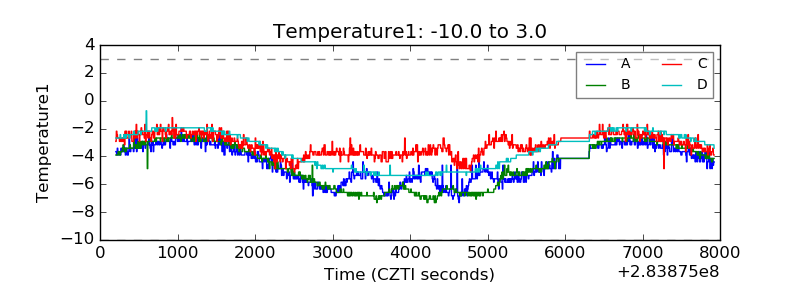 |
| Veto HV Monitor |  |
| Veto LLD | 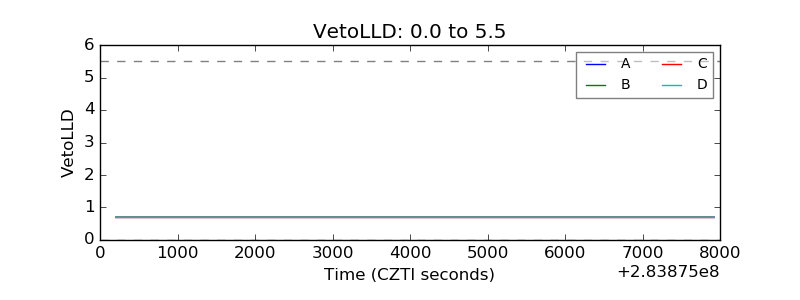 |
| Alpha Counter | 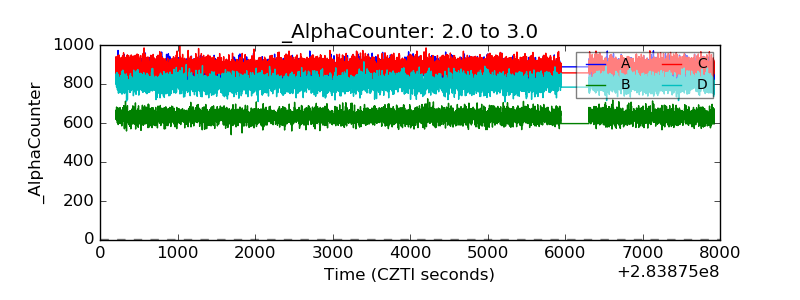 |
| _CPM_Rate |  |
| CZT Counter | 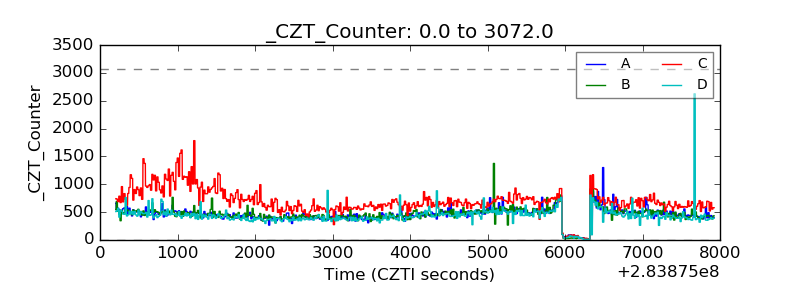 |
| +2.5 Volts monitor |  |
| +5 Volts monitor |  |
| _ROLL_ROT | 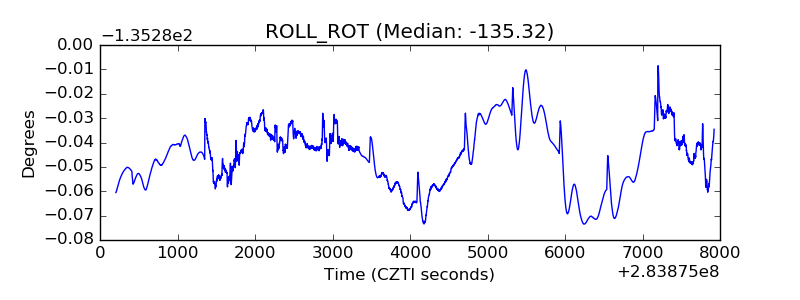 |
| _Roll_DEC | 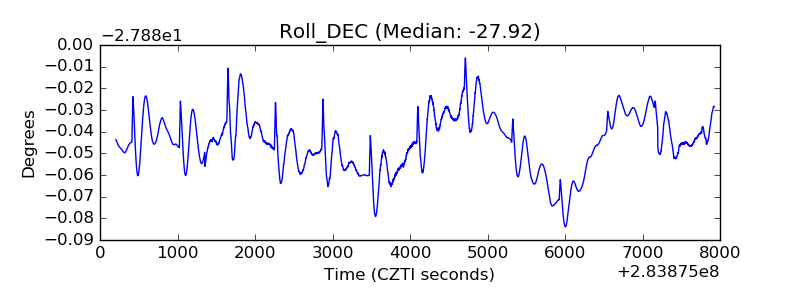 |
| _Roll_RA | 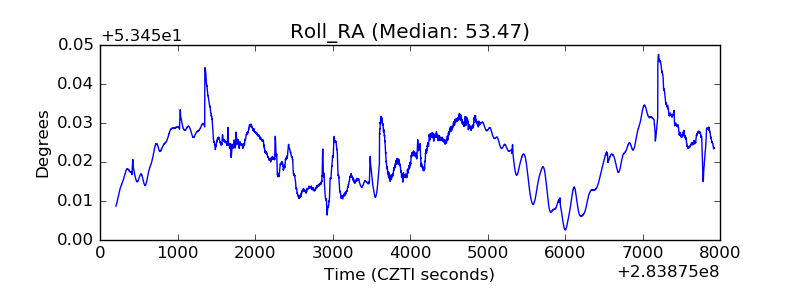 |
| Veto Counter | 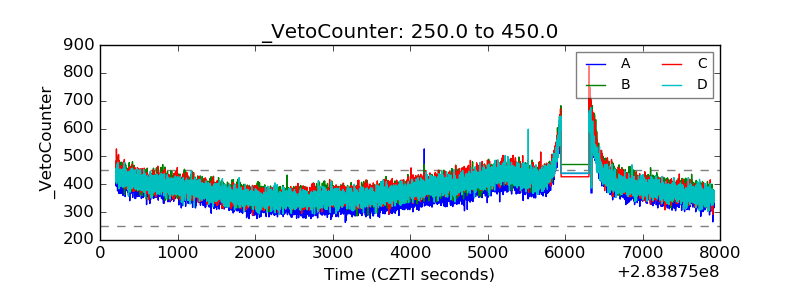 |