| Param | Original file | Final file |
|---|---|---|
| Filename | modeM0/AS1A05_056T01_9000002604_17613cztM0_level2.evt | modeM0/AS1A05_056T01_9000002604_17613cztM0_level2_quad_clean.evt |
| Size (bytes) | 141,995,520 | 40,982,400 |
| Size | 135.4 MB | 39.1 MB |
| Events in quadrant A | 955,343 | 276,704 |
| Events in quadrant B | 956,623 | 273,633 |
| Events in quadrant C | 1,325,433 | 259,676 |
| Events in quadrant D | 903,449 | 264,503 |
| Mode M0 | |||
|---|---|---|---|
| Quadrant | BADHDUFLAG | Total packets | Discarded packets |
| A | 0 | 4627 | 0 |
| B | 0 | 4612 | 0 |
| C | 0 | 5420 | 0 |
| D | 0 | 4646 | 0 |
| Mode SS | |||
|---|---|---|---|
| Quadrant | BADHDUFLAG | Total packets | Discarded packets |
| A | 0 | 46 | 0 |
| B | 0 | 46 | 0 |
| C | 0 | 46 | 0 |
| D | 0 | 46 | 0 |
| Quadrant | Total seconds | Saturated seconds | Saturation percentage |
|---|---|---|---|
| A | 2304 | 1 | 0.043403% |
| B | 2305 | 0 | 0.000000% |
| C | 2305 | 7 | 0.303688% |
| D | 2305 | 5 | 0.216920% |
Noise dominated data is calculated using 1-second bins in cleaned event files. If a bin has >2000 counts, and if more than 50% of those come from <1% of pixels, then it is considered to be noise-dominated and hence unusable.
| Quadrant | # 1 sec bins | Bins with >0 counts | Bins with >2000 counts | High rate bins dominated by noise | Noise dominated (total time) | Noise dominated (detector-on time) | Marked lightcurve |
|---|---|---|---|---|---|---|---|
| A | 2304 | 2304 | 1 | 1 | 0.04% | 0.04% | 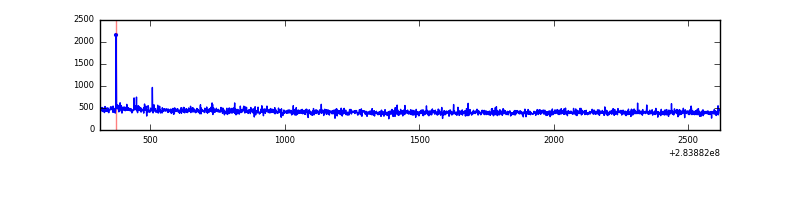 |
| B | 2305 | 2305 | 0 | 0 | 0.00% | 0.00% | 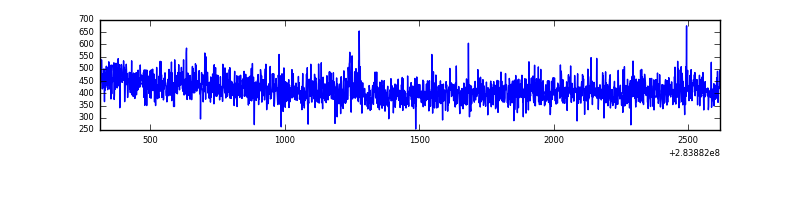 |
| C | 2305 | 2305 | 0 | 0 | 0.00% | 0.00% | 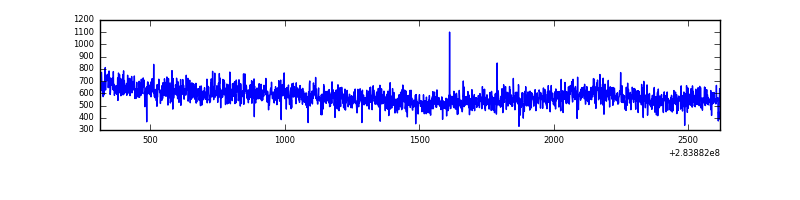 |
| D | 2305 | 2305 | 5 | 5 | 0.22% | 0.22% | 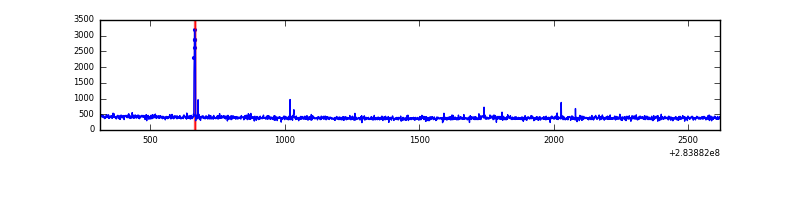 |
Top three noisy pixels from each quadrant. If the there are fewer than three noisy pixels in the level2.evt file, extra rows are filled as -1
| Pixel properties | Quadrant properties | ||||||
|---|---|---|---|---|---|---|---|
| Quadrant | DetID | PixID | Counts | Sigma | Mean | Median | Sigma |
| A | 0 | 13 | 7677 | 143.68 | 245 | 240 | 51.8 |
| A | 14 | 237 | 7282 | 136.05 | 245 | 240 | 51.8 |
| A | 0 | 226 | 2109 | 36.11 | 245 | 240 | 51.8 |
| B | 12 | 111 | 5756 | 112.23 | 243 | 237 | 49.2 |
| B | 11 | 111 | 4792 | 92.62 | 243 | 237 | 49.2 |
| B | 14 | 111 | 4199 | 80.57 | 243 | 237 | 49.2 |
| C | 3 | 233 | 372418 | 6644.26 | 230 | 231 | 56.0 |
| C | 14 | 238 | 35264 | 625.41 | 230 | 231 | 56.0 |
| C | 5 | 218 | 19368 | 341.63 | 230 | 231 | 56.0 |
| D | 7 | 223 | 15014 | 254.99 | 234 | 228 | 58.0 |
| D | 2 | 234 | 8551 | 143.53 | 234 | 228 | 58.0 |
| D | 14 | 226 | 2247 | 34.82 | 234 | 228 | 58.0 |
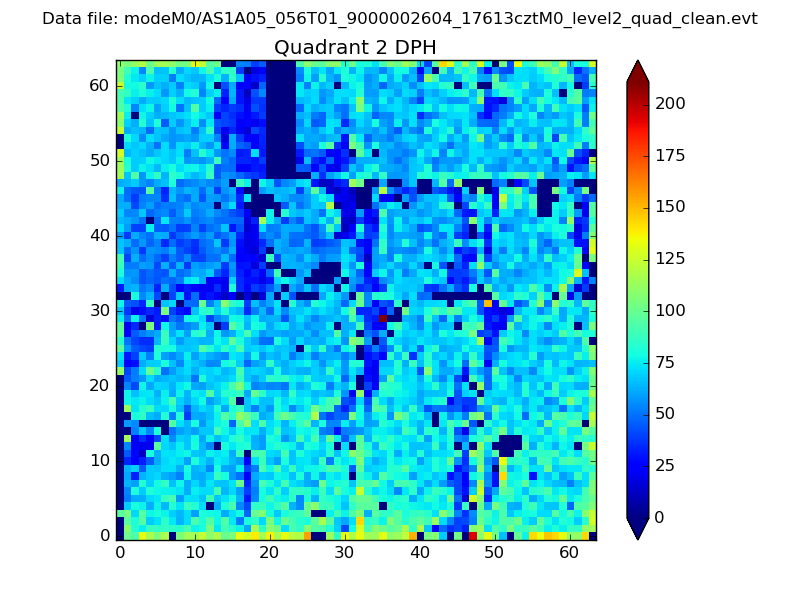
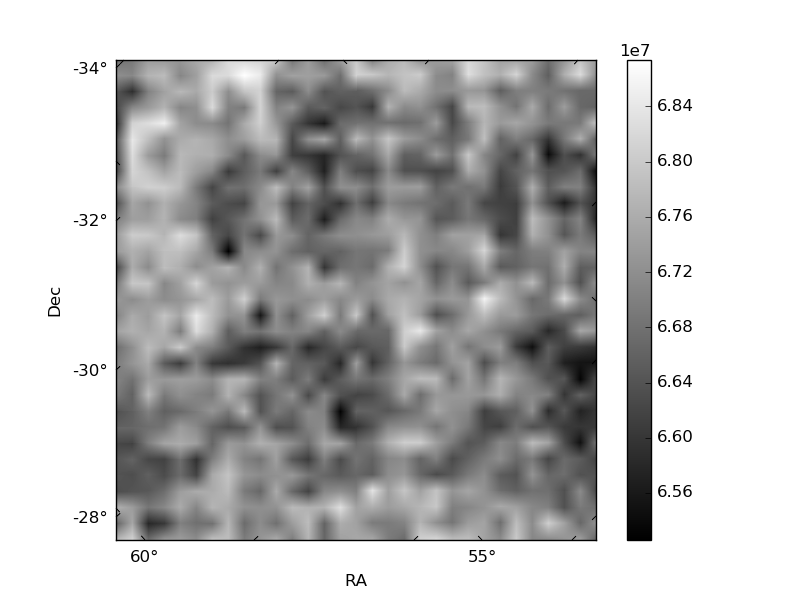
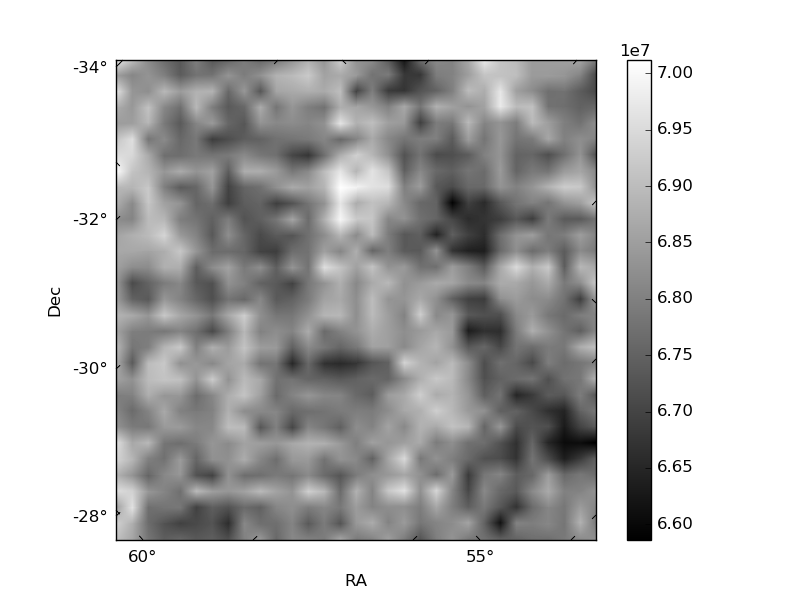
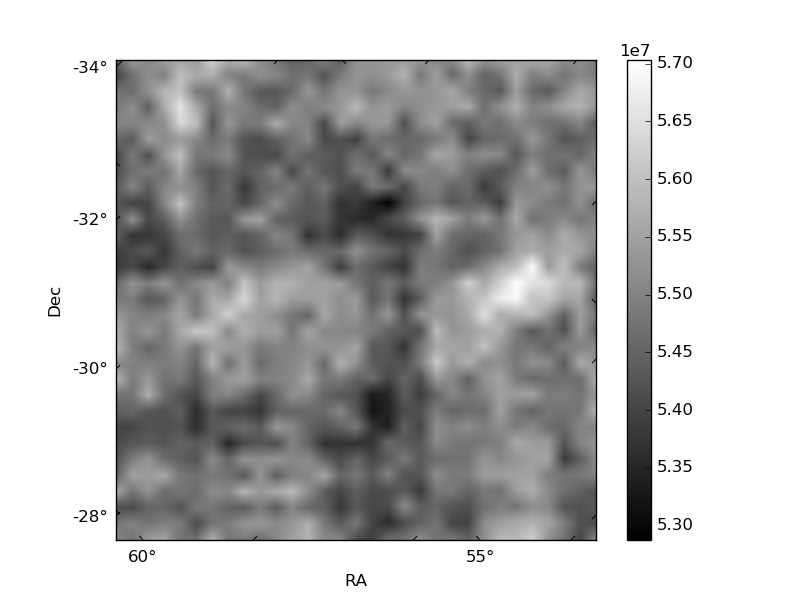
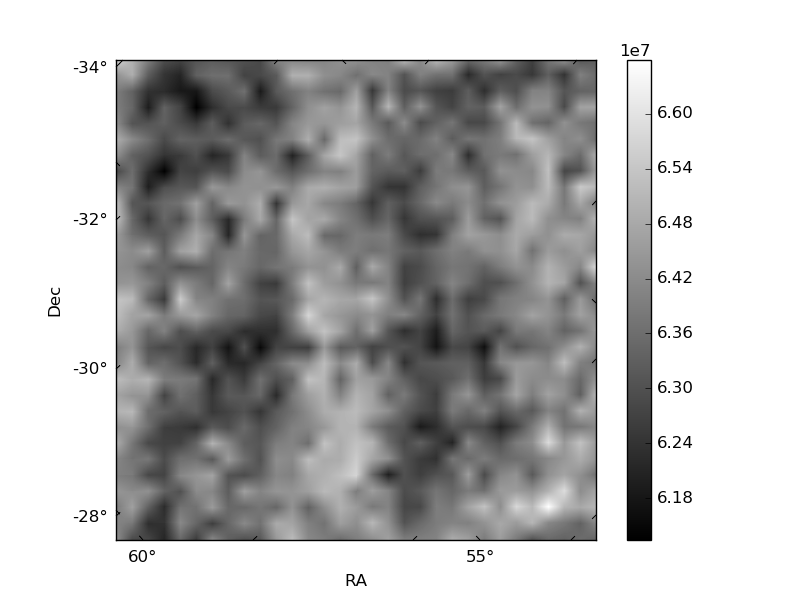
Histogram calculated using DETX and DETY for each event in the final _common_clean file
| Quadrant A | 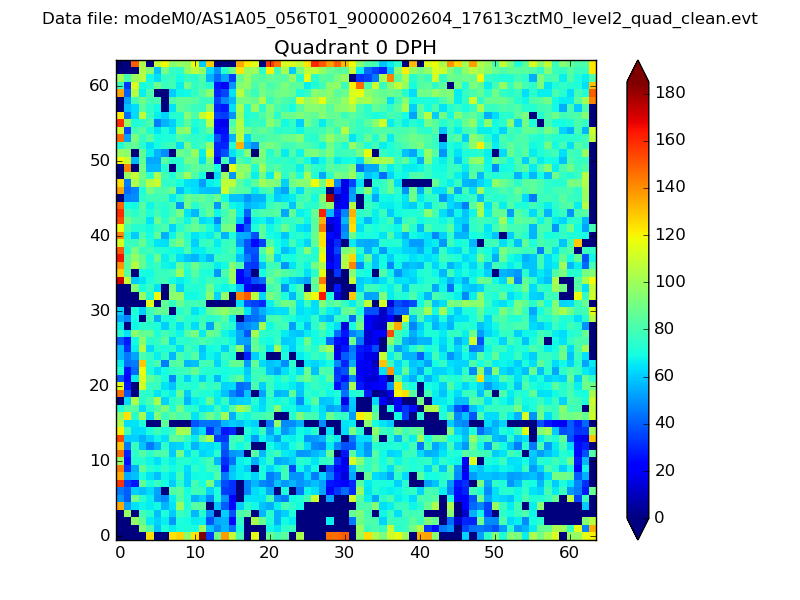 |
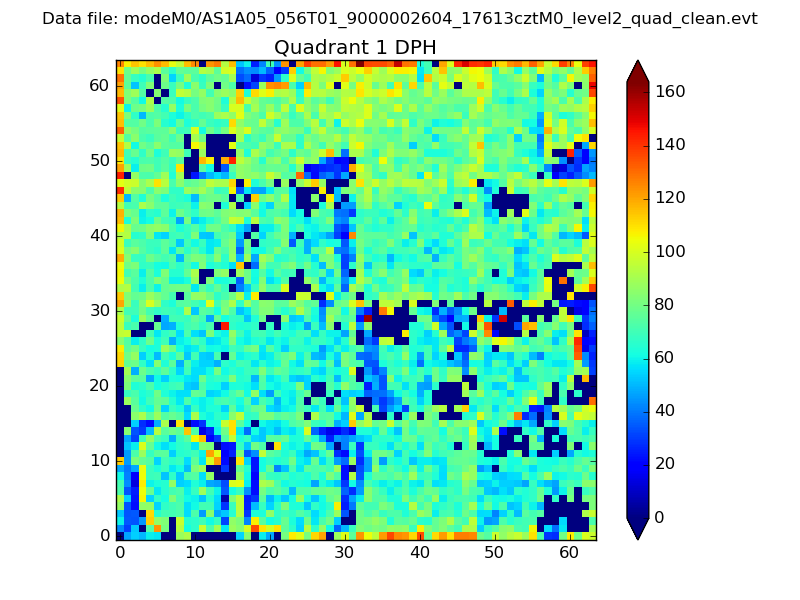 |
Quadrant B |
|---|---|---|---|
| Quadrant D | 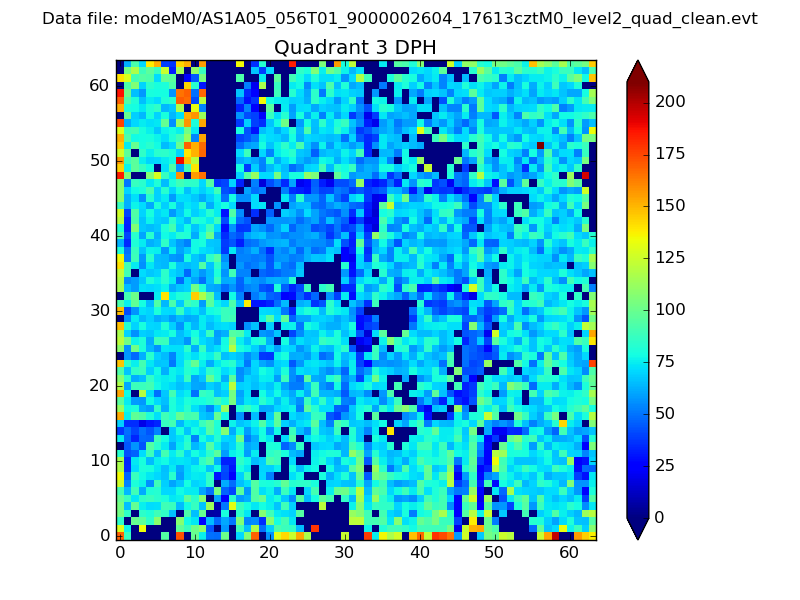 |
 |
Quadrant C |
| Plot type | Count rate plots | Images |
|---|---|---|
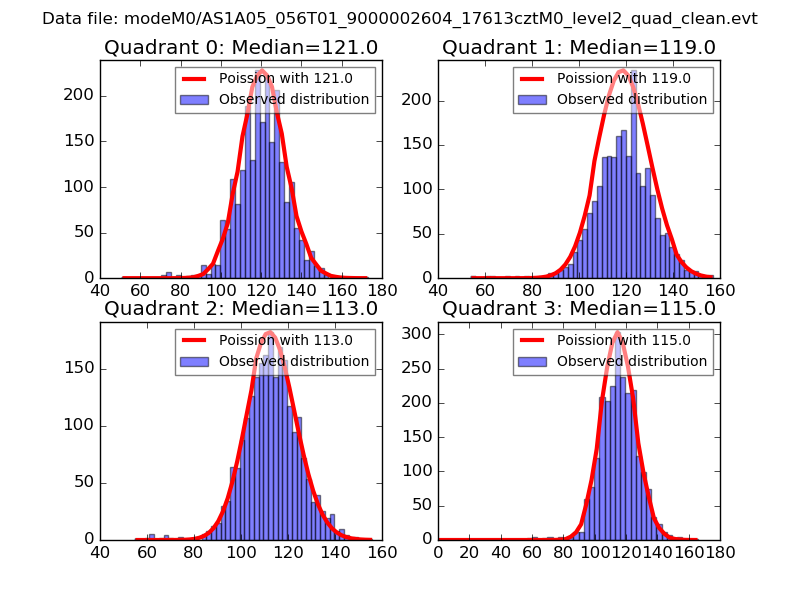
| Comparison with Poisson distribution Blue bars denote a histogram of data divided into 1 sec bins. Red curve is a Poisson curve with rate = median count rate of data. |
 |
 |
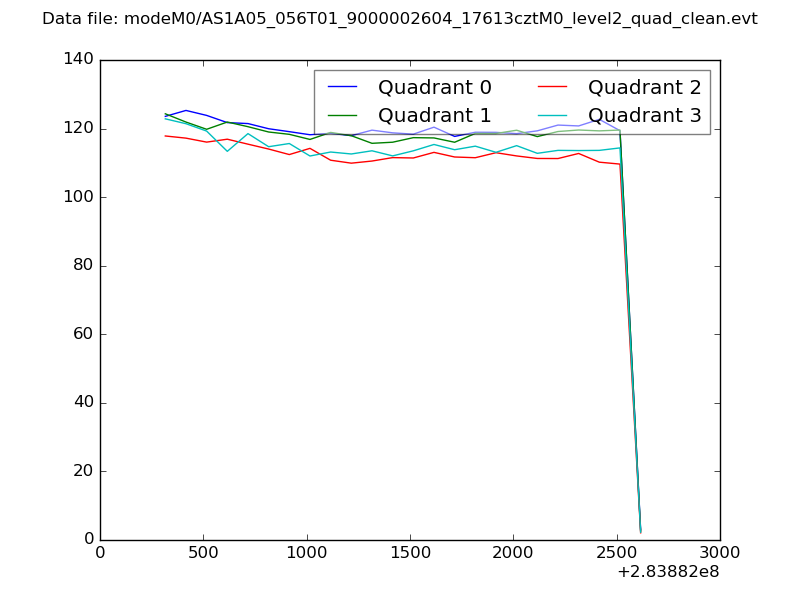
| Quadrant-wise count rates Data is divided into 100 sec bins |
 |
|
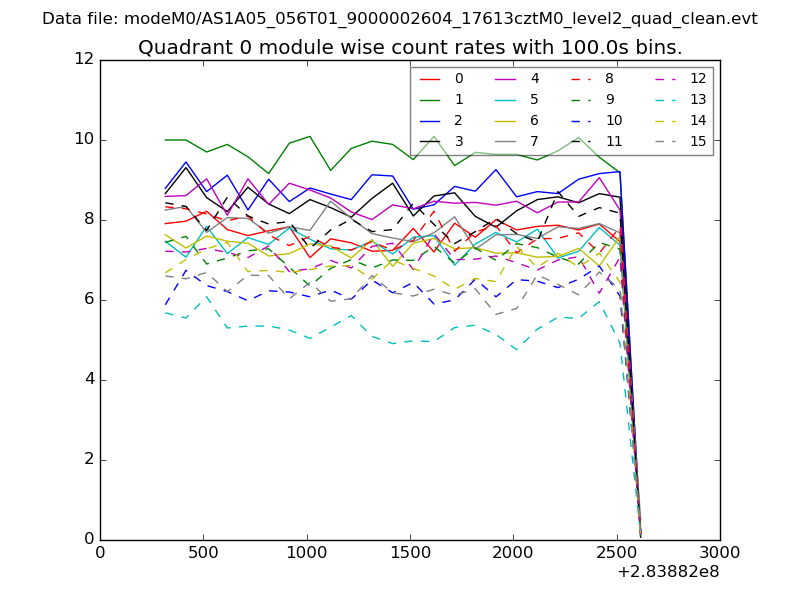
| Module-wise count rates for Quadrant A Data is divided into 100 sec bins |
 |
 |
| Module-wise count rates for Quadrant B Data is divided into 100 sec bins |
 |
 |
| Module-wise count rates for Quadrant C Data is divided into 100 sec bins |
 |
 |
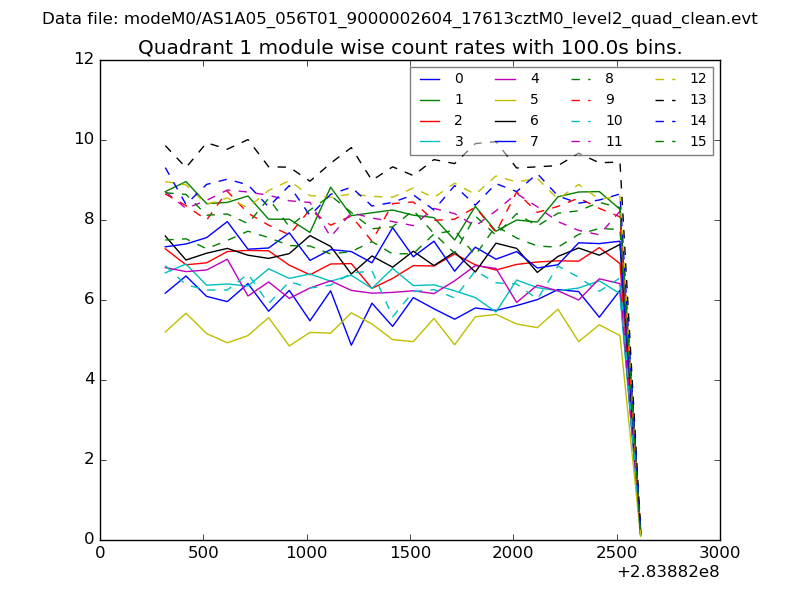
| Module-wise count rates for Quadrant D Data is divided into 100 sec bins |
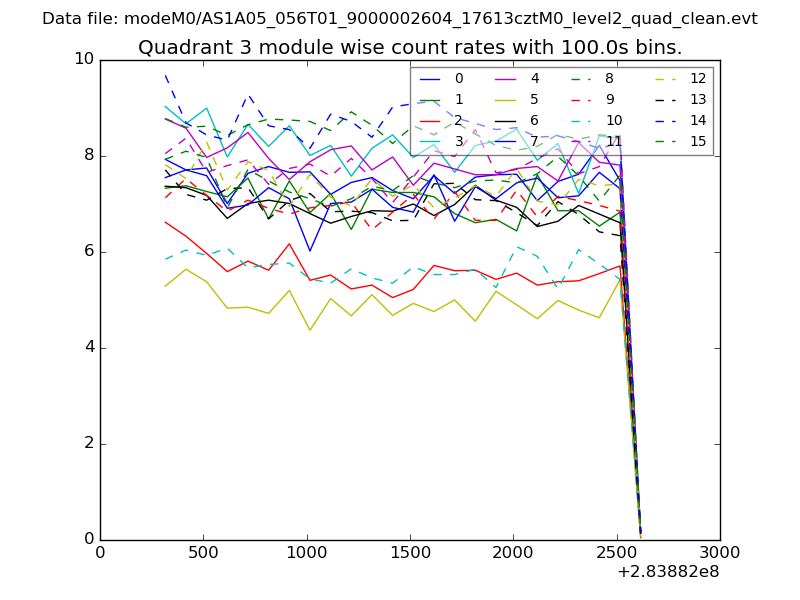 |
 |
| Parameter | Plot |
|---|---|
| CZT HV Monitor | 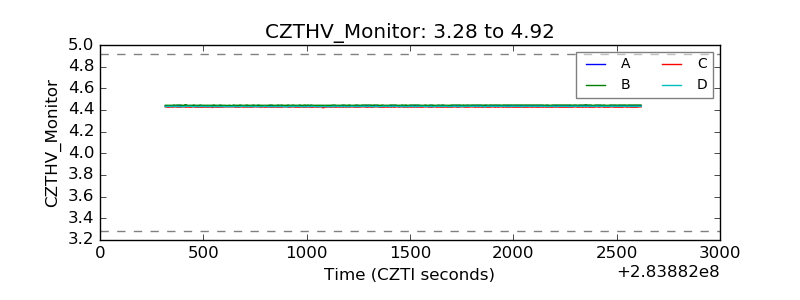 |
| D_VDD |  |
| Temperature 1 | 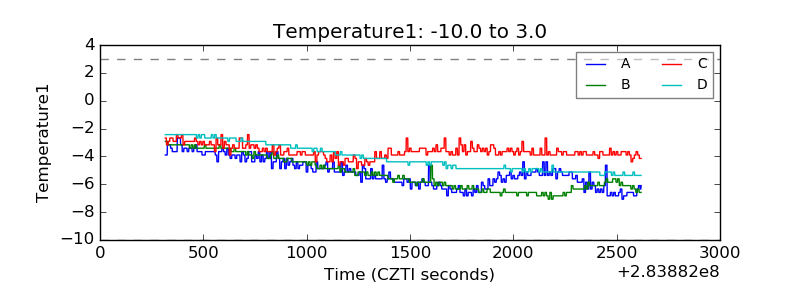 |
| Veto HV Monitor | 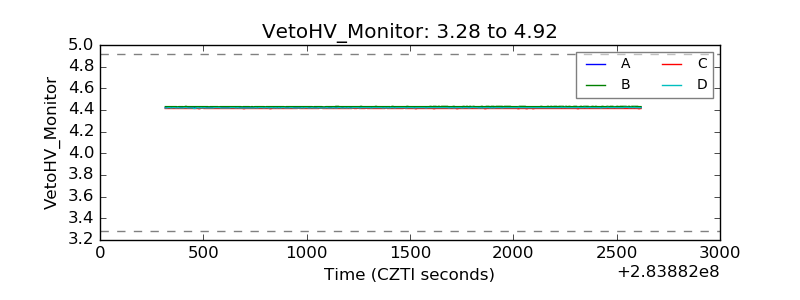 |
| Veto LLD |  |
| Alpha Counter | 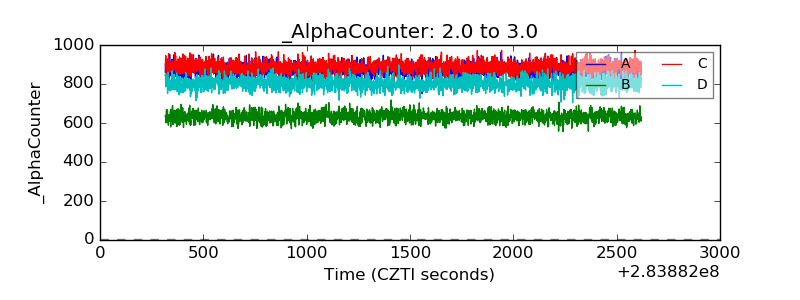 |
| _CPM_Rate | 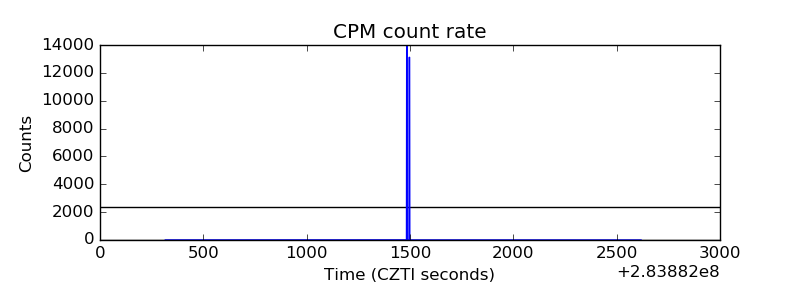 |
| CZT Counter | 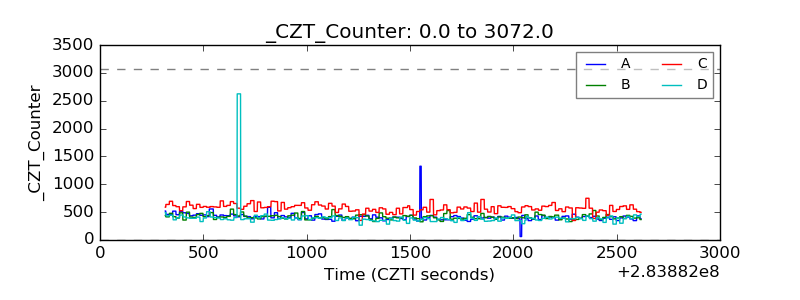 |
| +2.5 Volts monitor |  |
| +5 Volts monitor |  |
| _ROLL_ROT | 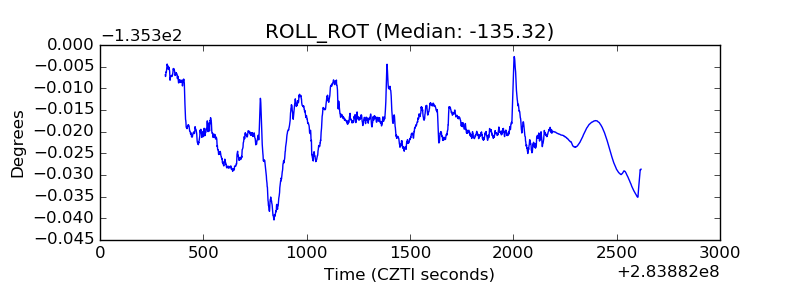 |
| _Roll_DEC | 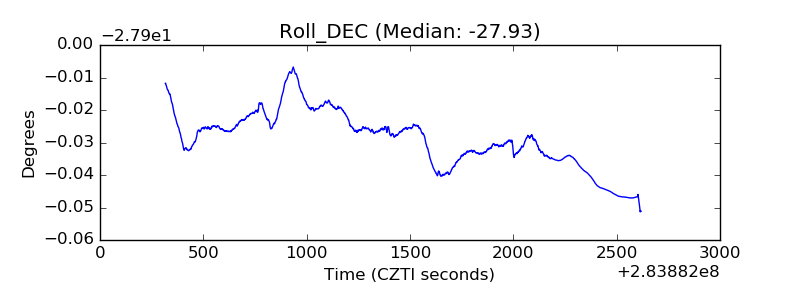 |
| _Roll_RA | 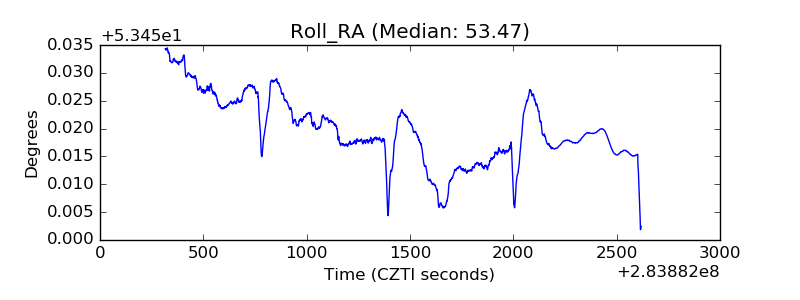 |
| Veto Counter | 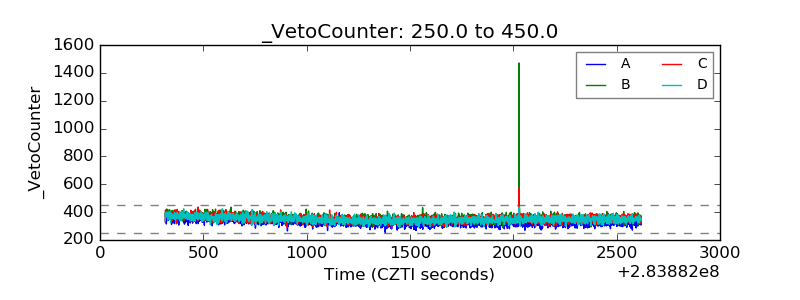 |