| Param | Original file | Final file |
|---|---|---|
| Filename | modeM0/AS1T03_012T01_9000002606cztM0_level2.fits | modeM0/AS1T03_012T01_9000002606cztM0_level2_quad_clean.evt |
| Size (bytes) | 1,078,842,240 | 239,230,080 |
| Size | 1.0 GB | 228.1 MB |
| Events in quadrant A | 8,630,920 | 1,515,007 |
| Events in quadrant B | 8,835,419 | 1,525,211 |
| Events in quadrant C | 12,097,444 | 1,455,570 |
| Events in quadrant D | 8,924,079 | 1,460,247 |
| Mode SS | |||
|---|---|---|---|
| Quadrant | BADHDUFLAG | Total packets | Discarded packets |
| A | 0 | 384 | 0 |
| B | 0 | 384 | 0 |
| C | 0 | 384 | 0 |
| D | 0 | 384 | 0 |
| Mode M0 | |||
|---|---|---|---|
| Quadrant | BADHDUFLAG | Total packets | Discarded packets |
| A | 0 | 38261 | 0 |
| B | 0 | 38649 | 0 |
| C | 0 | 49593 | 0 |
| D | 0 | 40112 | 0 |
| Mode M9 | |||
|---|---|---|---|
| Quadrant | BADHDUFLAG | Total packets | Discarded packets |
| A | 0 | 29 | 0 |
| B | 0 | 29 | 0 |
| C | 0 | 29 | 0 |
| D | 0 | 29 | 0 |
| Quadrant | Total seconds | Saturated seconds | Saturation percentage |
|---|---|---|---|
| A | 18716 | 86 | 0.459500% |
| B | 18716 | 126 | 0.673221% |
| C | 18716 | 335 | 1.789912% |
| D | 18716 | 166 | 0.886942% |
Noise dominated data is calculated using 1-second bins in cleaned event files. If a bin has >2000 counts, and if more than 50% of those come from <1% of pixels, then it is considered to be noise-dominated and hence unusable.
| Quadrant | # 1 sec bins | Bins with >0 counts | Bins with >2000 counts | High rate bins dominated by noise | Noise dominated (total time) | Noise dominated (detector-on time) | Marked lightcurve |
|---|---|---|---|---|---|---|---|
| A | 21631 | 18720 | 1 | 1 | 0.00% | 0.01% |  |
| B | 21631 | 18720 | 3 | 3 | 0.01% | 0.02% | 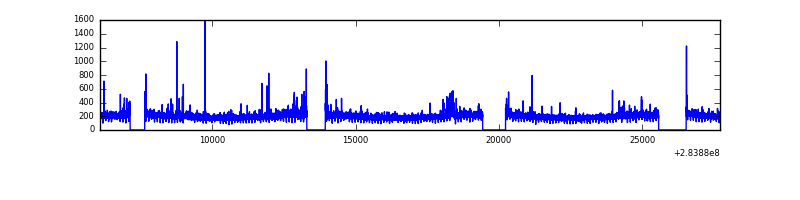 |
| C | 21631 | 18718 | 0 | 0 | 0.00% | 0.00% |  |
| D | 21631 | 18720 | 67 | 67 | 0.31% | 0.36% |  |
Top three noisy pixels from each quadrant. If the there are fewer than three noisy pixels in the level2.evt file, extra rows are filled as -1
| Pixel properties | Quadrant properties | ||||||
|---|---|---|---|---|---|---|---|
| Quadrant | DetID | PixID | Counts | Sigma | Mean | Median | Sigma |
| A | 0 | 13 | 29834 | 61.61 | 2232 | 2184 | 448.8 |
| A | 0 | 226 | 19223 | 37.97 | 2232 | 2184 | 448.8 |
| A | 3 | 137 | 17289 | 33.66 | 2232 | 2184 | 448.8 |
| B | 12 | 111 | 51526 | 116.42 | 2224 | 2169 | 424.0 |
| B | 11 | 111 | 44479 | 99.8 | 2224 | 2169 | 424.0 |
| B | 0 | 189 | 40898 | 91.35 | 2224 | 2169 | 424.0 |
| C | 3 | 233 | 3329140 | 6775.64 | 2126 | 2139 | 491.0 |
| C | 14 | 238 | 330554 | 668.84 | 2126 | 2139 | 491.0 |
| C | 5 | 218 | 134176 | 268.9 | 2126 | 2139 | 491.0 |
| D | 13 | 189 | 466213 | 881.34 | 2161 | 2098 | 526.6 |
| D | 7 | 55 | 114859 | 214.13 | 2161 | 2098 | 526.6 |
| D | 10 | 70 | 75784 | 139.93 | 2161 | 2098 | 526.6 |
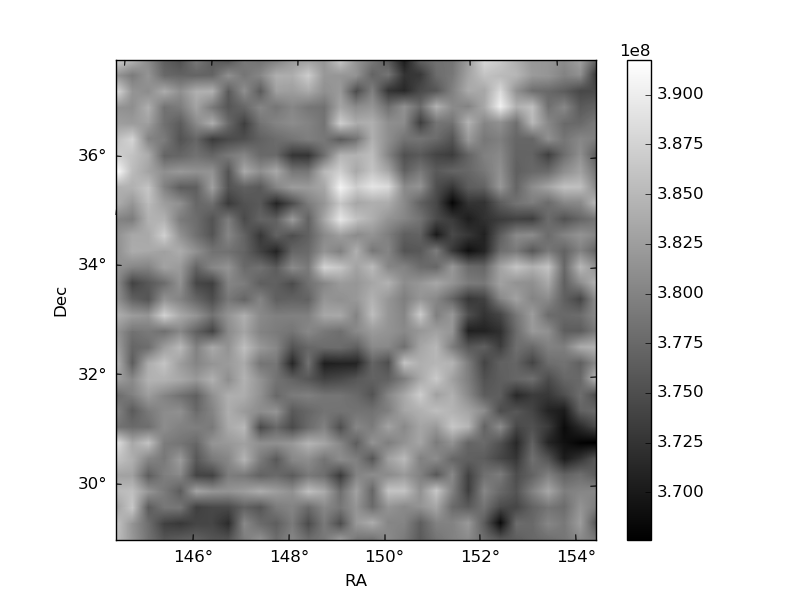
Histogram calculated using DETX and DETY for each event in the final _common_clean file
| Quadrant A | 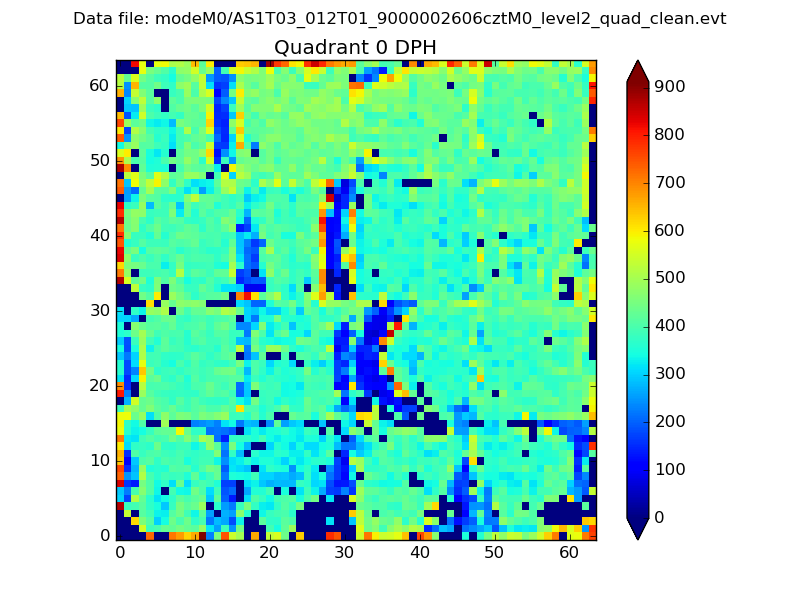 |
 |
Quadrant B |
|---|---|---|---|
| Quadrant D | 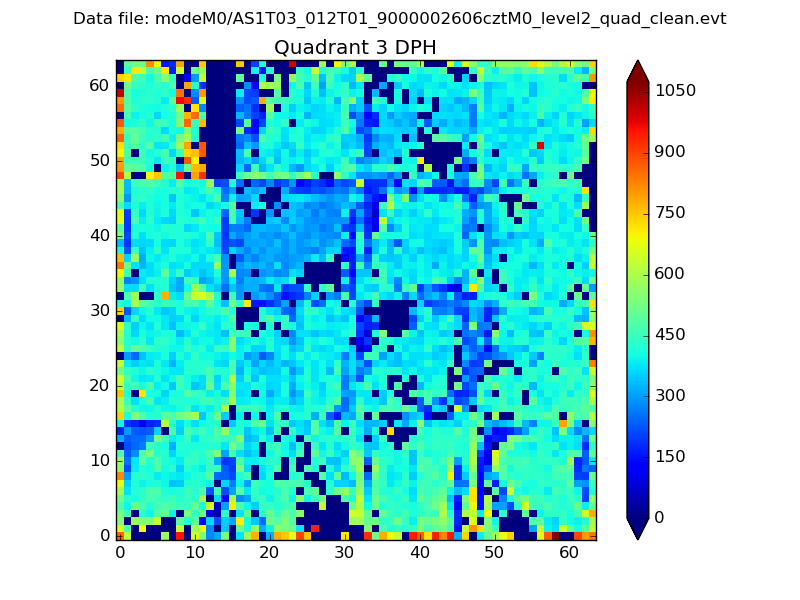 |
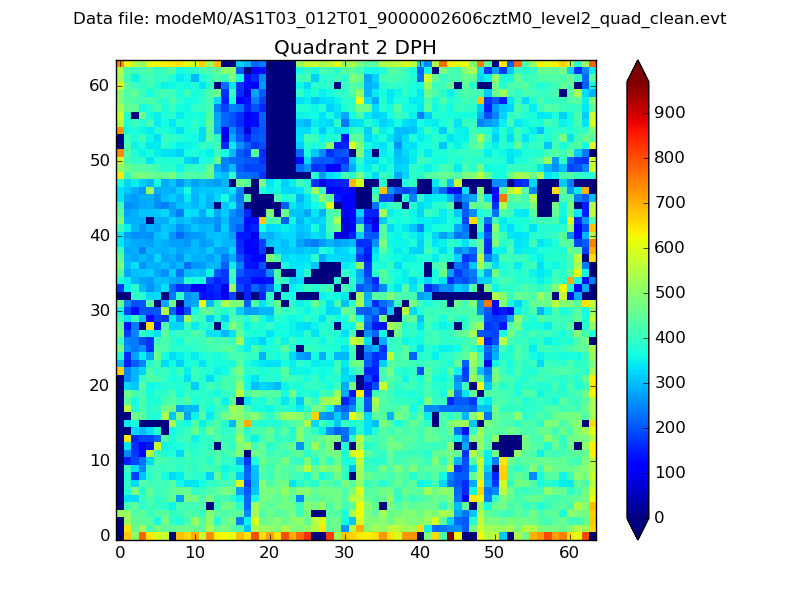 |
Quadrant C |
| Plot type | Count rate plots | Images |
|---|---|---|
| Comparison with Poisson distribution Blue bars denote a histogram of data divided into 1 sec bins. Red curve is a Poisson curve with rate = median count rate of data. |
 |
 |
| Quadrant-wise count rates Data is divided into 100 sec bins |
 |
|
| Module-wise count rates for Quadrant A Data is divided into 100 sec bins |
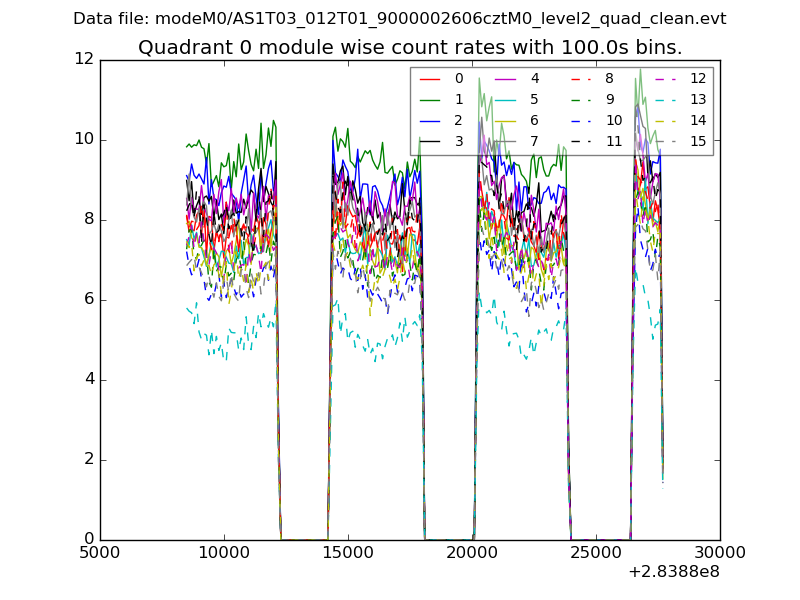 |
 |
| Module-wise count rates for Quadrant B Data is divided into 100 sec bins |
 |
 |
| Module-wise count rates for Quadrant C Data is divided into 100 sec bins |
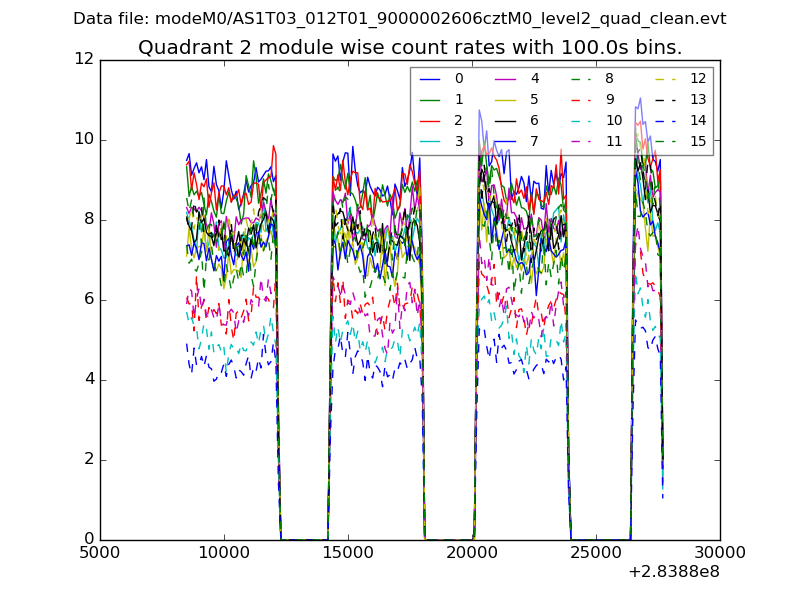 |
 |
| Module-wise count rates for Quadrant D Data is divided into 100 sec bins |
 |
 |
| Parameter | Plot |
|---|---|
| CZT HV Monitor | 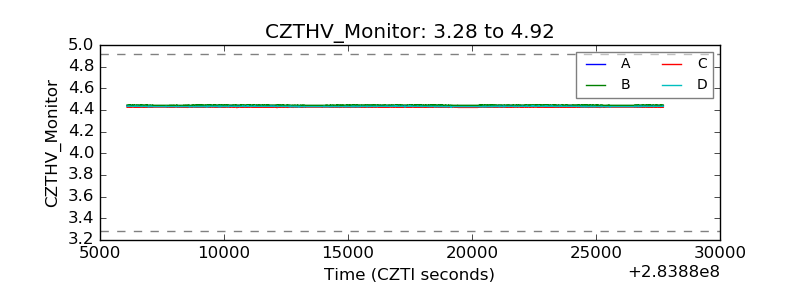 |
| D_VDD |  |
| Temperature 1 |  |
| Veto HV Monitor |  |
| Veto LLD |  |
| Alpha Counter |  |
| _CPM_Rate | 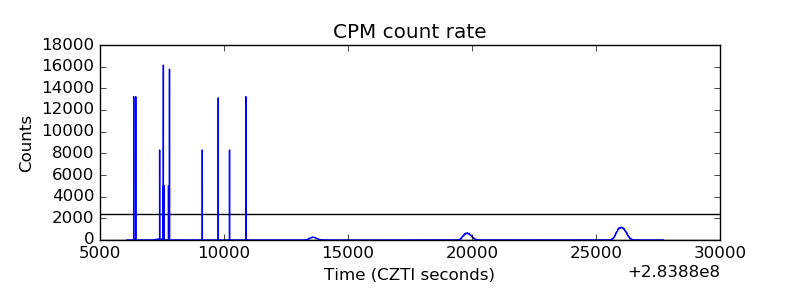 |
| CZT Counter |  |
| +2.5 Volts monitor |  |
| +5 Volts monitor |  |
| _ROLL_ROT | 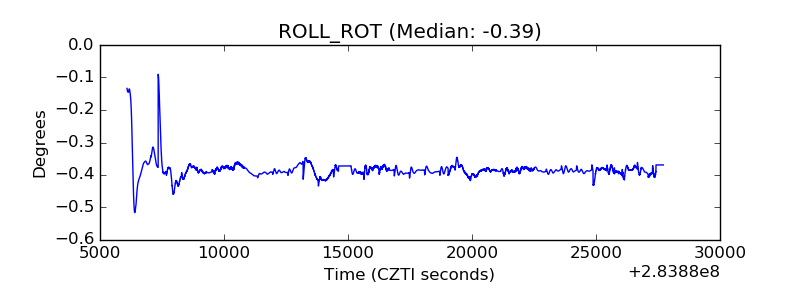 |
| _Roll_DEC |  |
| _Roll_RA |  |
| Veto Counter |  |