| Param | Original file | Final file |
|---|---|---|
| Filename | modeM0/AS1T03_012T01_9000002606_17612cztM0_level2.evt | modeM0/AS1T03_012T01_9000002606_17612cztM0_level2_quad_clean.evt |
| Size (bytes) | 966,556,800 | 180,820,800 |
| Size | 921.8 MB | 172.4 MB |
| Events in quadrant A | 6,390,677 | 1,149,704 |
| Events in quadrant B | 6,546,883 | 1,160,537 |
| Events in quadrant C | 8,938,440 | 1,107,679 |
| Events in quadrant D | 6,463,746 | 1,106,952 |
| Mode SS | |||
|---|---|---|---|
| Quadrant | BADHDUFLAG | Total packets | Discarded packets |
| A | 0 | 282 | 0 |
| B | 0 | 282 | 0 |
| C | 0 | 282 | 0 |
| D | 0 | 282 | 0 |
| Mode M0 | |||
|---|---|---|---|
| Quadrant | BADHDUFLAG | Total packets | Discarded packets |
| A | 0 | 28165 | 3 |
| B | 0 | 28540 | 3 |
| C | 0 | 36313 | 3 |
| D | 0 | 29200 | 3 |
| Mode M9 | |||
|---|---|---|---|
| Quadrant | BADHDUFLAG | Total packets | Discarded packets |
| A | 0 | 24 | 0 |
| B | 0 | 24 | 0 |
| C | 0 | 24 | 0 |
| D | 0 | 24 | 0 |
| Quadrant | Total seconds | Saturated seconds | Saturation percentage |
|---|---|---|---|
| A | 13781 | 63 | 0.457151% |
| B | 13782 | 98 | 0.711072% |
| C | 13782 | 259 | 1.879263% |
| D | 13782 | 132 | 0.957771% |
Noise dominated data is calculated using 1-second bins in cleaned event files. If a bin has >2000 counts, and if more than 50% of those come from <1% of pixels, then it is considered to be noise-dominated and hence unusable.
| Quadrant | # 1 sec bins | Bins with >0 counts | Bins with >2000 counts | High rate bins dominated by noise | Noise dominated (total time) | Noise dominated (detector-on time) | Marked lightcurve |
|---|---|---|---|---|---|---|---|
| A | 16186 | 13784 | 0 | 0 | 0.00% | 0.00% | 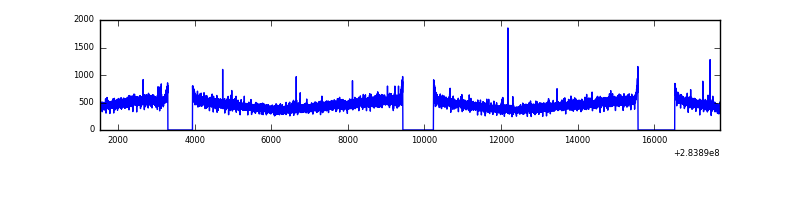 |
| B | 16187 | 13785 | 2 | 2 | 0.01% | 0.01% | 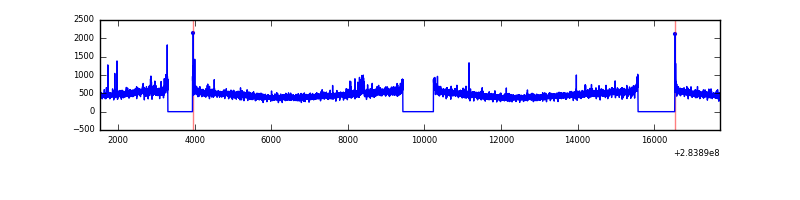 |
| C | 16187 | 13783 | 0 | 0 | 0.00% | 0.00% | 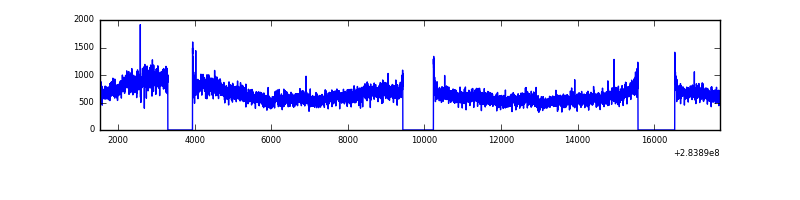 |
| D | 16187 | 13785 | 57 | 57 | 0.35% | 0.41% |  |
Top three noisy pixels from each quadrant. If the there are fewer than three noisy pixels in the level2.evt file, extra rows are filled as -1
| Pixel properties | Quadrant properties | ||||||
|---|---|---|---|---|---|---|---|
| Quadrant | DetID | PixID | Counts | Sigma | Mean | Median | Sigma |
| A | 0 | 13 | 16544 | 44.87 | 1654 | 1616 | 332.7 |
| A | 0 | 226 | 14368 | 38.33 | 1654 | 1616 | 332.7 |
| A | 3 | 137 | 12812 | 33.65 | 1654 | 1616 | 332.7 |
| B | 12 | 111 | 37981 | 116.11 | 1645 | 1607 | 313.3 |
| B | 0 | 230 | 34742 | 105.77 | 1645 | 1607 | 313.3 |
| B | 0 | 189 | 33393 | 101.46 | 1645 | 1607 | 313.3 |
| C | 3 | 233 | 2452571 | 6717.32 | 1574 | 1580 | 364.9 |
| C | 14 | 238 | 245626 | 668.85 | 1574 | 1580 | 364.9 |
| C | 5 | 218 | 89620 | 241.29 | 1574 | 1580 | 364.9 |
| D | 13 | 189 | 285195 | 730.48 | 1598 | 1548 | 388.3 |
| D | 10 | 70 | 70956 | 178.75 | 1598 | 1548 | 388.3 |
| D | 2 | 234 | 49397 | 123.23 | 1598 | 1548 | 388.3 |
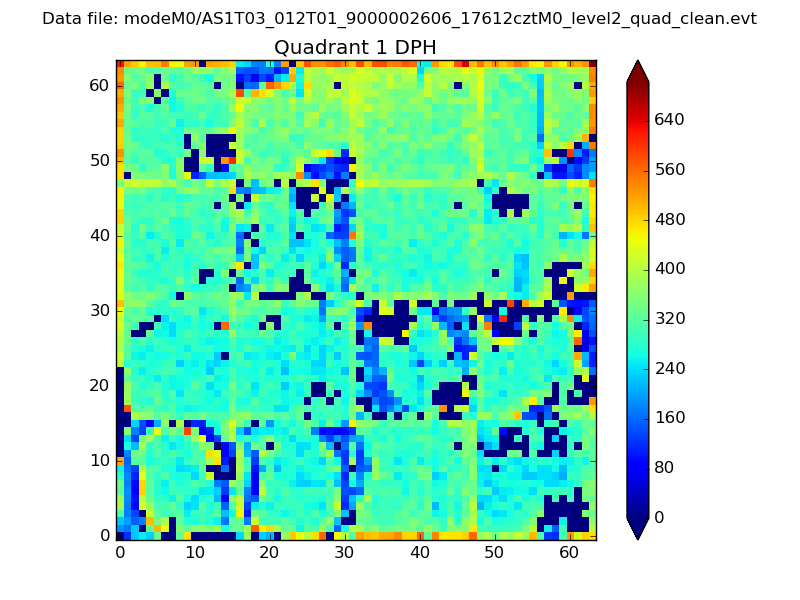
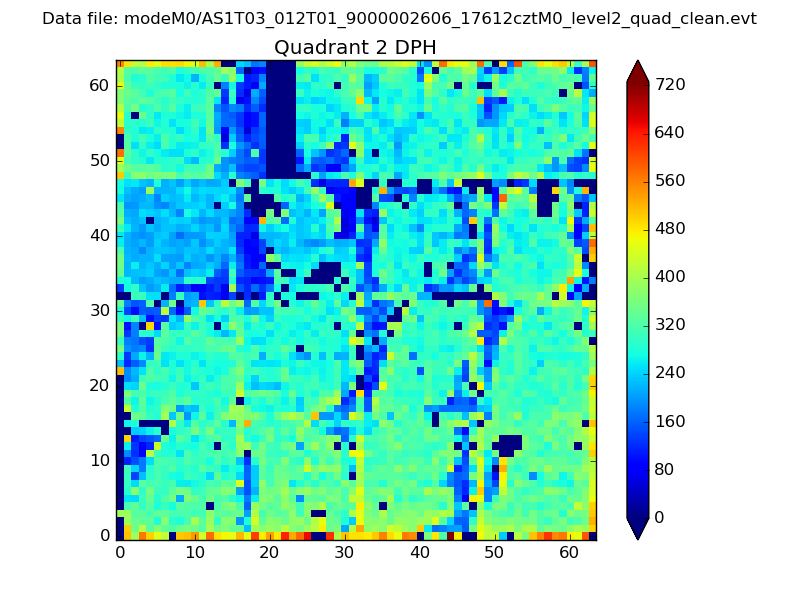
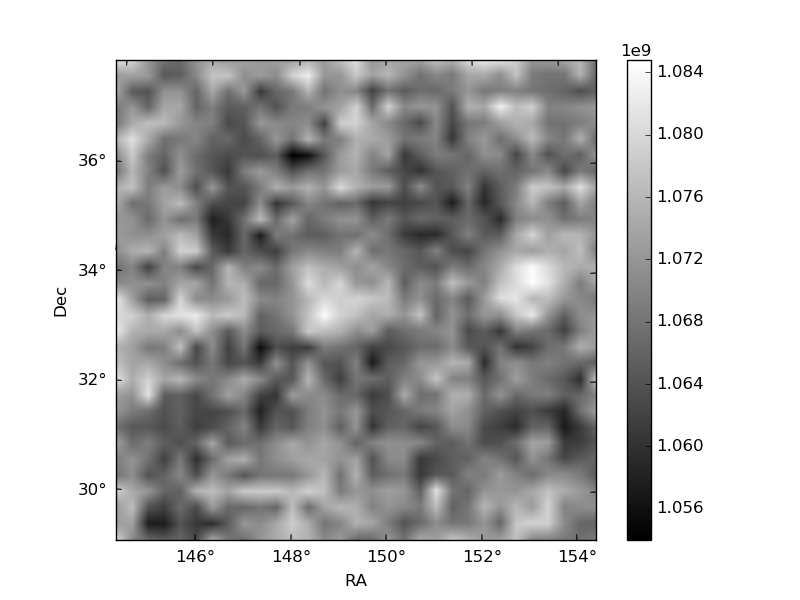
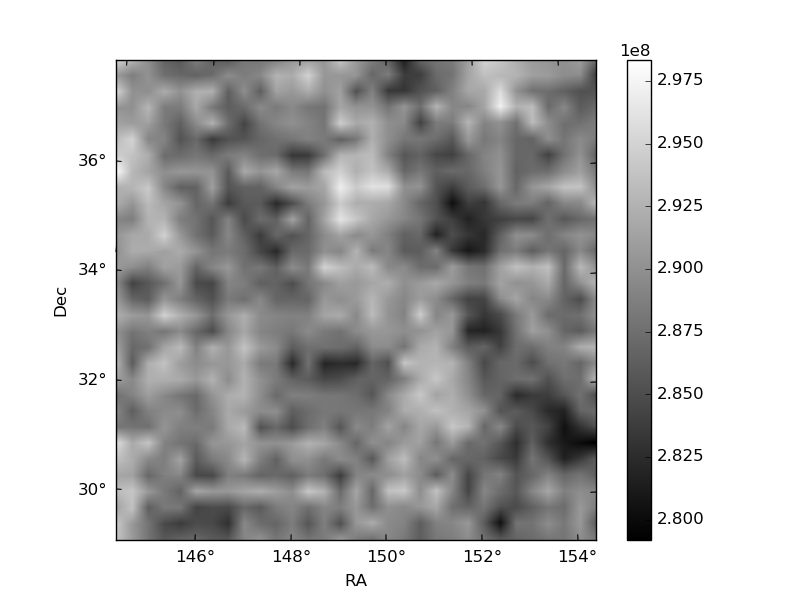
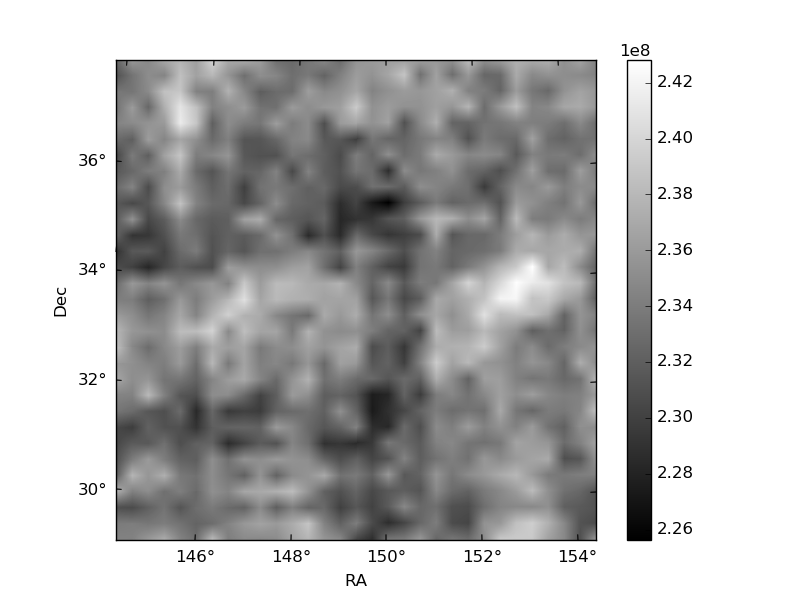
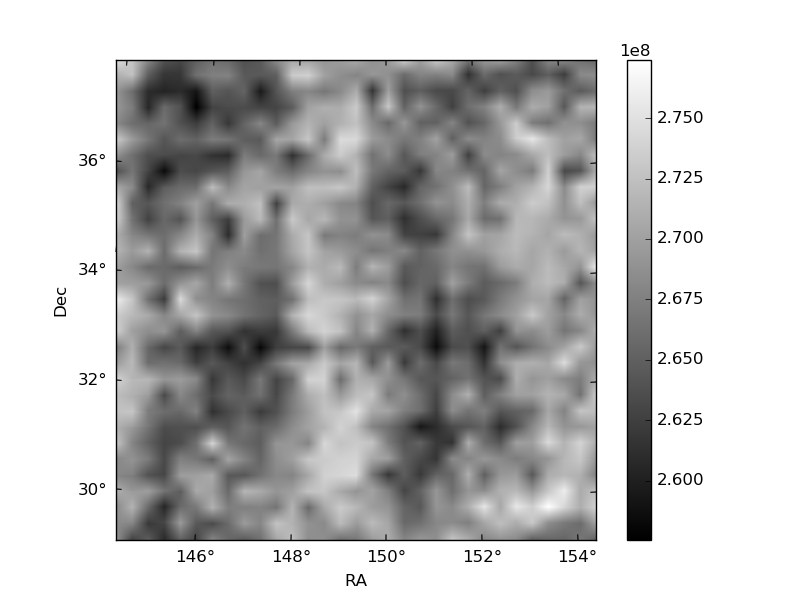
Histogram calculated using DETX and DETY for each event in the final _common_clean file
| Quadrant A | 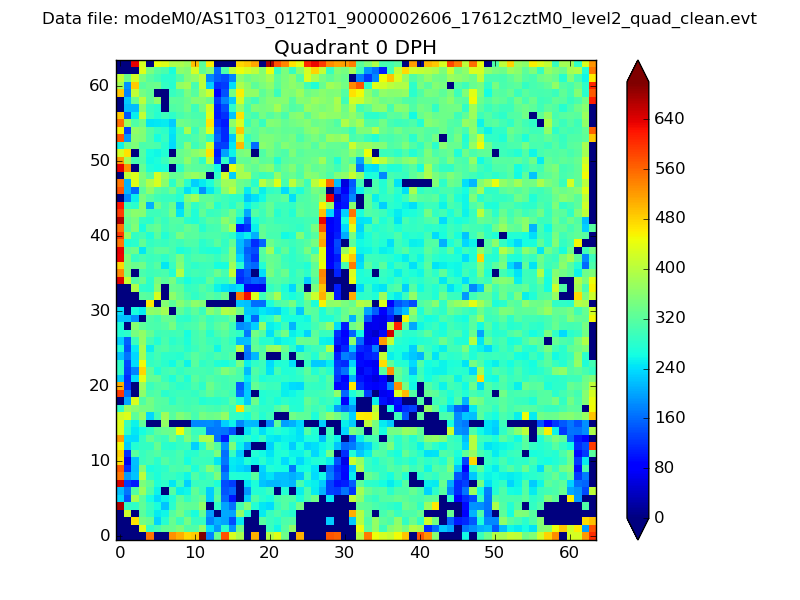 |
 |
Quadrant B |
|---|---|---|---|
| Quadrant D | 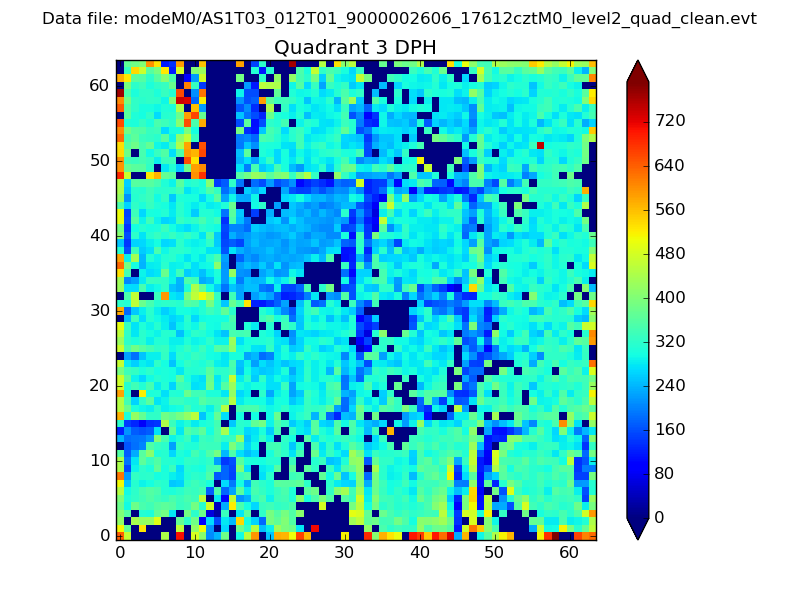 |
 |
Quadrant C |
| Plot type | Count rate plots | Images |
|---|---|---|
| Comparison with Poisson distribution Blue bars denote a histogram of data divided into 1 sec bins. Red curve is a Poisson curve with rate = median count rate of data. |
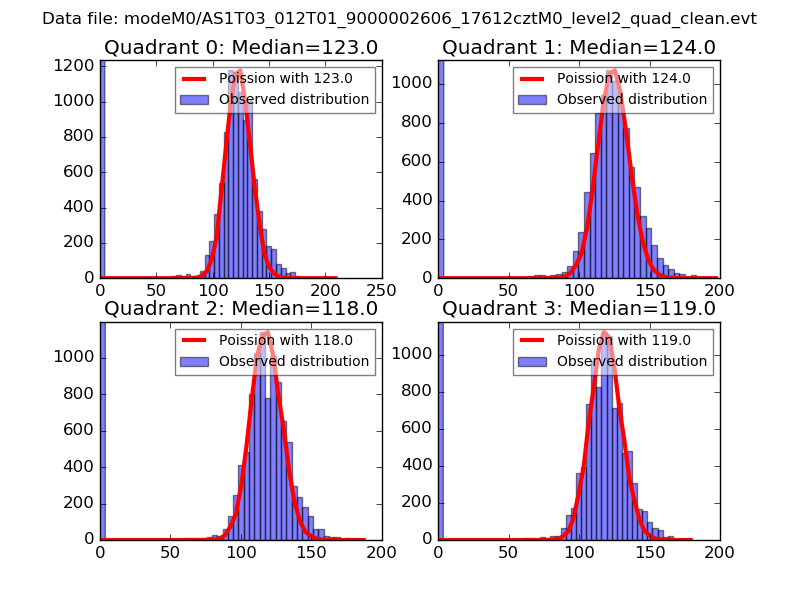 |
 |
| Quadrant-wise count rates Data is divided into 100 sec bins |
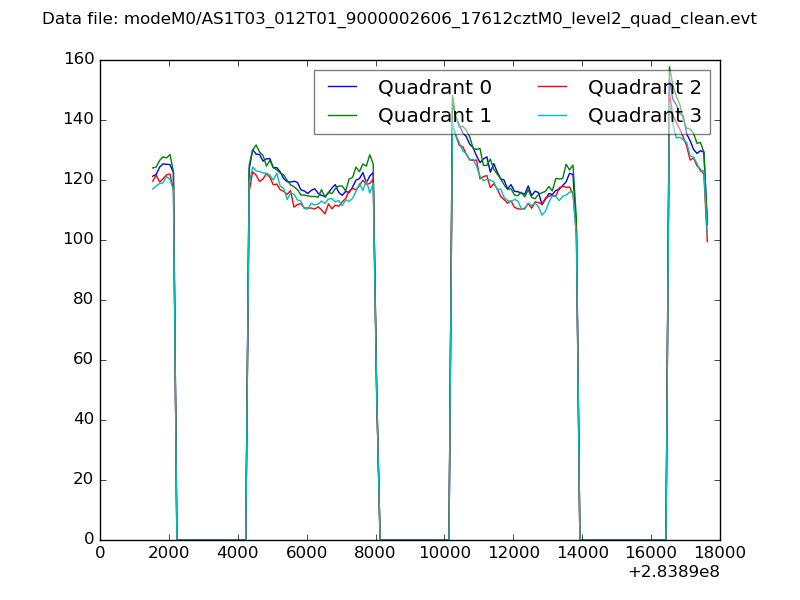 |
|
| Module-wise count rates for Quadrant A Data is divided into 100 sec bins |
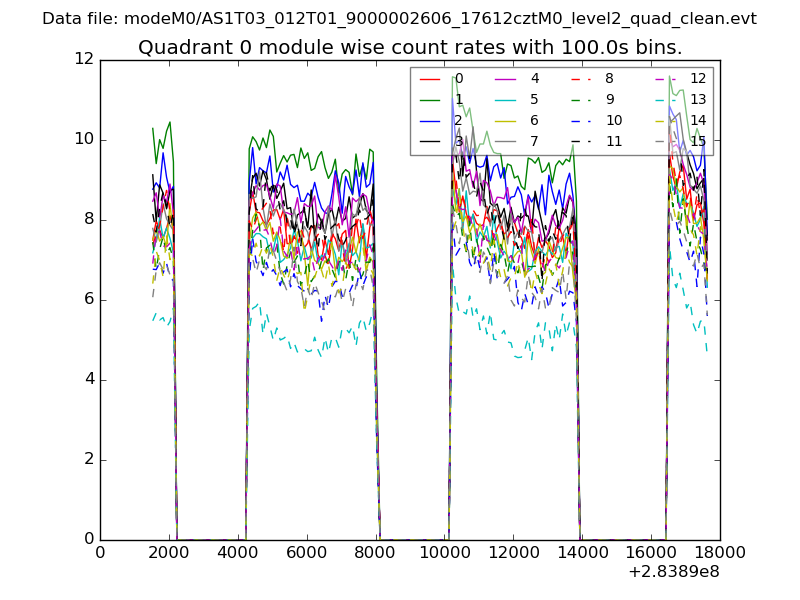 |
 |
| Module-wise count rates for Quadrant B Data is divided into 100 sec bins |
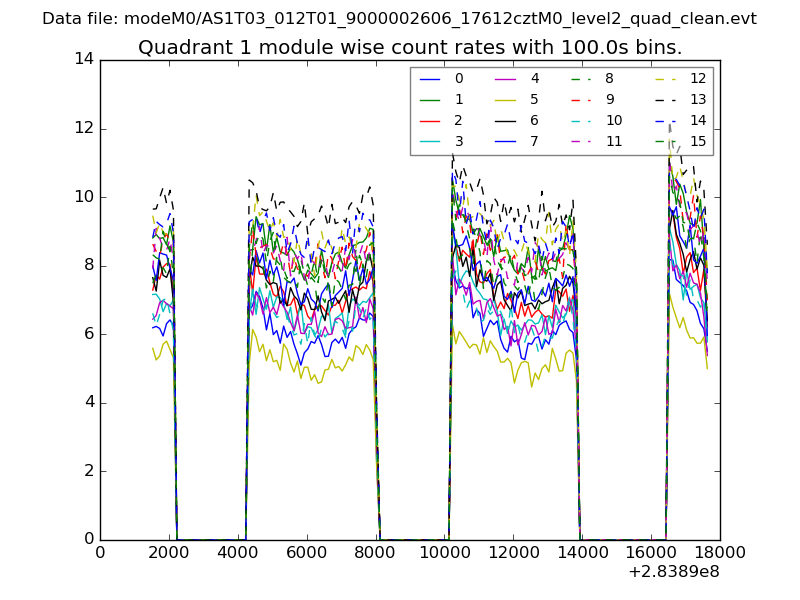 |
 |
| Module-wise count rates for Quadrant C Data is divided into 100 sec bins |
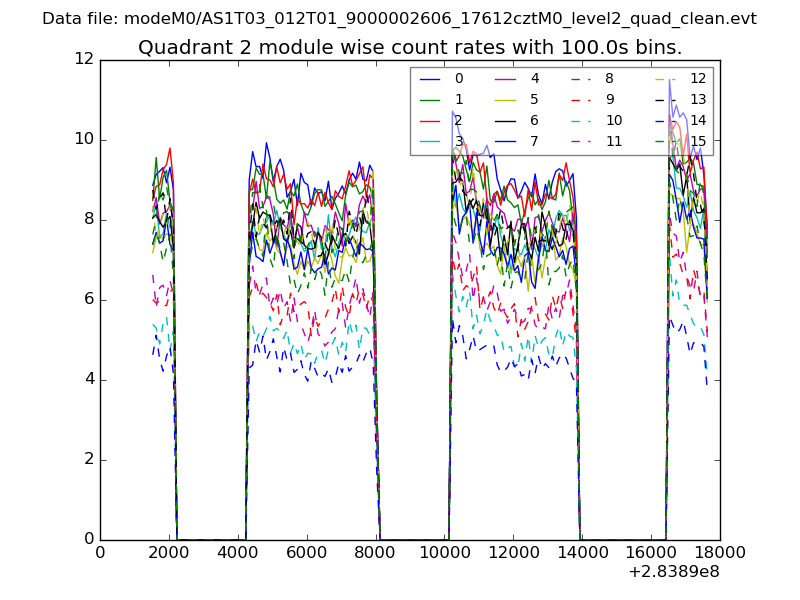 |
 |
| Module-wise count rates for Quadrant D Data is divided into 100 sec bins |
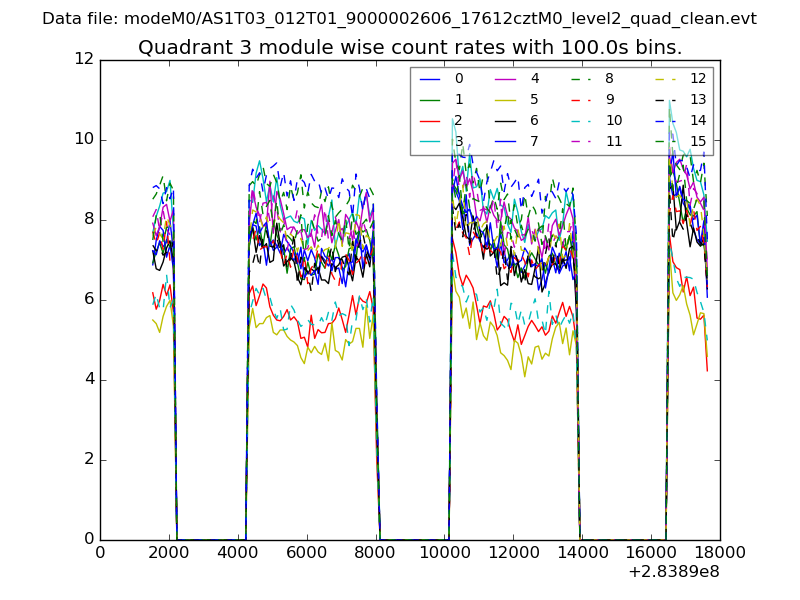 |
 |
| Parameter | Plot |
|---|---|
| CZT HV Monitor | 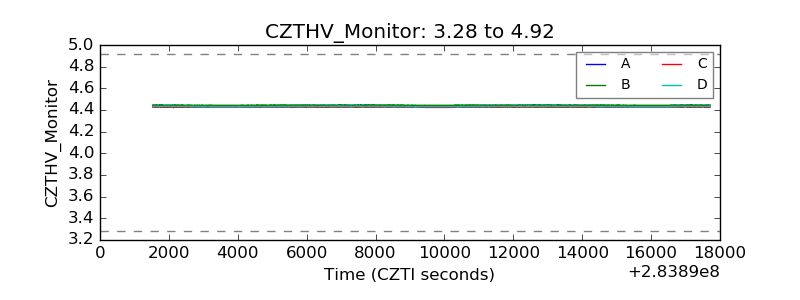 |
| D_VDD | 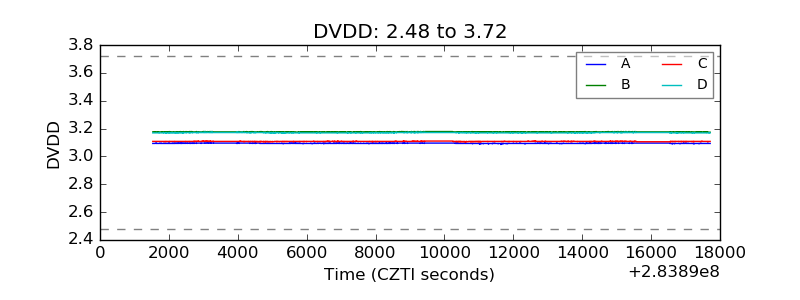 |
| Temperature 1 | 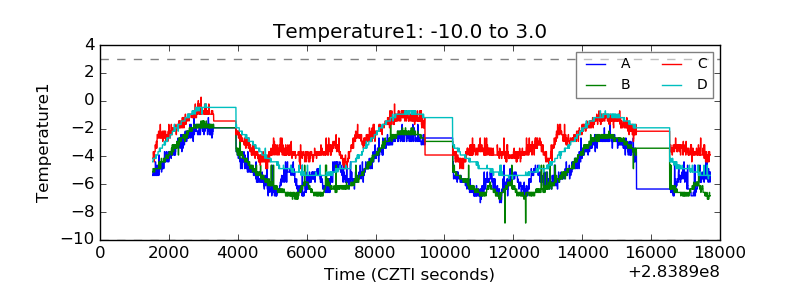 |
| Veto HV Monitor | 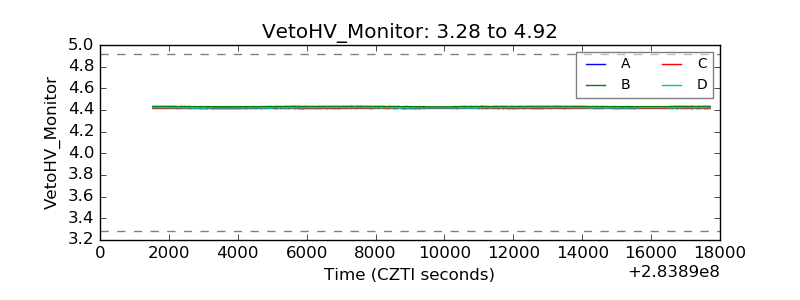 |
| Veto LLD | 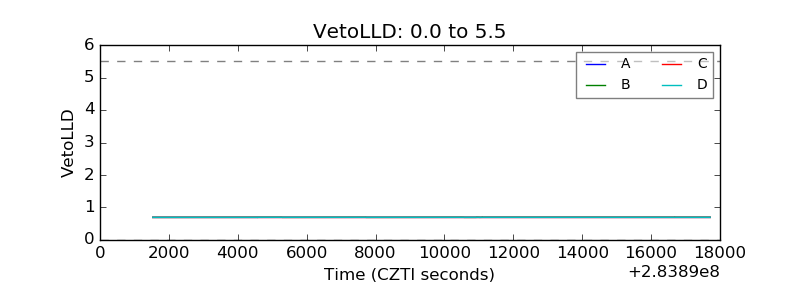 |
| Alpha Counter | 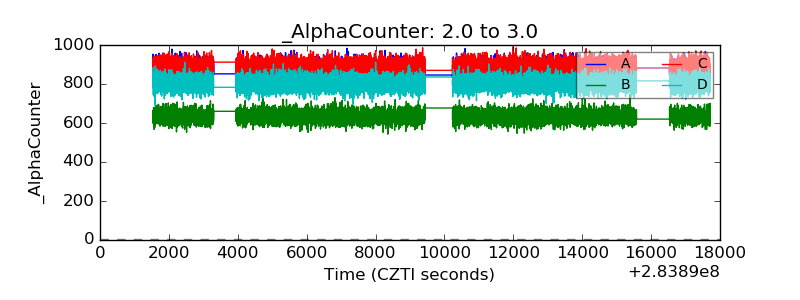 |
| _CPM_Rate | 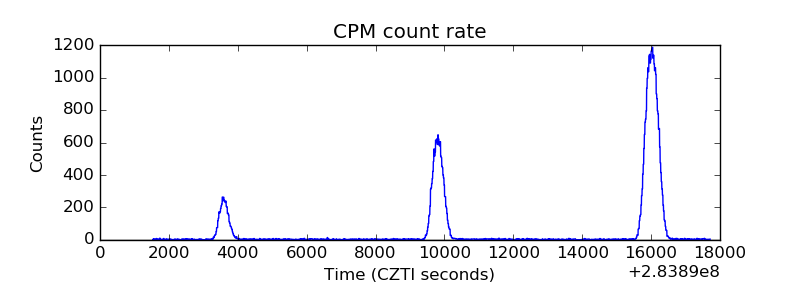 |
| CZT Counter | 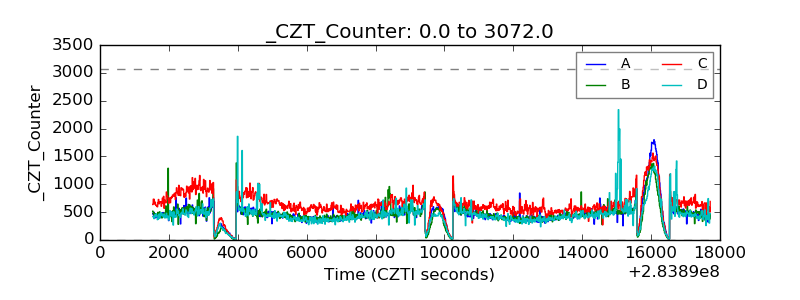 |
| +2.5 Volts monitor |  |
| +5 Volts monitor |  |
| _ROLL_ROT | 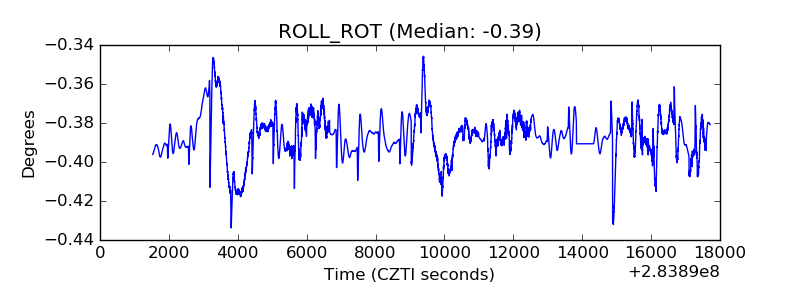 |
| _Roll_DEC | 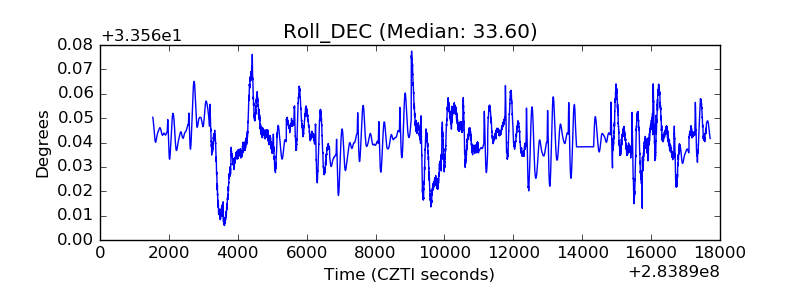 |
| _Roll_RA | 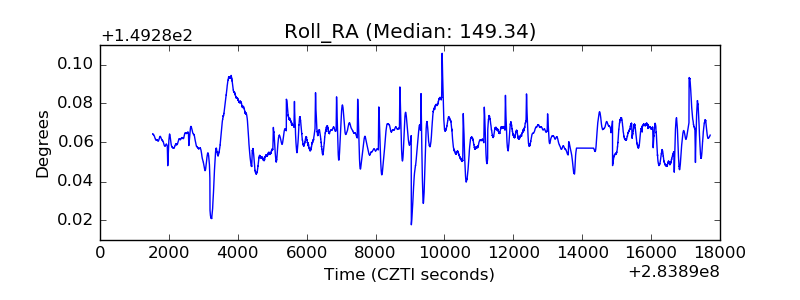 |
| Veto Counter | 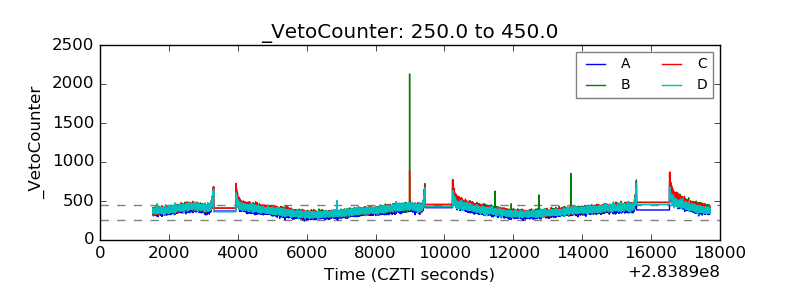 |