| Param | Original file | Final file |
|---|---|---|
| Filename | modeM0/AS1T03_027T01_9000002608_17612cztM0_level2.evt | modeM0/AS1T03_027T01_9000002608_17612cztM0_level2_quad_clean.evt |
| Size (bytes) | 315,547,200 | 55,794,240 |
| Size | 300.9 MB | 53.2 MB |
| Events in quadrant A | 2,118,672 | 350,175 |
| Events in quadrant B | 2,138,054 | 354,562 |
| Events in quadrant C | 2,933,782 | 340,982 |
| Events in quadrant D | 2,071,550 | 339,594 |
| Mode SS | |||
|---|---|---|---|
| Quadrant | BADHDUFLAG | Total packets | Discarded packets |
| A | 0 | 88 | 0 |
| B | 0 | 88 | 0 |
| C | 0 | 88 | 0 |
| D | 0 | 88 | 0 |
| Mode M9 | |||
|---|---|---|---|
| Quadrant | BADHDUFLAG | Total packets | Discarded packets |
| A | 0 | 11 | 0 |
| B | 0 | 11 | 0 |
| C | 0 | 11 | 0 |
| D | 0 | 11 | 0 |
| Mode M0 | |||
|---|---|---|---|
| Quadrant | BADHDUFLAG | Total packets | Discarded packets |
| A | 0 | 8961 | 1 |
| B | 0 | 9020 | 1 |
| C | 0 | 12124 | 2 |
| D | 0 | 9072 | 1 |
| Quadrant | Total seconds | Saturated seconds | Saturation percentage |
|---|---|---|---|
| A | 4319 | 31 | 0.717759% |
| B | 4319 | 38 | 0.879833% |
| C | 4318 | 88 | 2.037981% |
| D | 4318 | 25 | 0.578972% |
Noise dominated data is calculated using 1-second bins in cleaned event files. If a bin has >2000 counts, and if more than 50% of those come from <1% of pixels, then it is considered to be noise-dominated and hence unusable.
| Quadrant | # 1 sec bins | Bins with >0 counts | Bins with >2000 counts | High rate bins dominated by noise | Noise dominated (total time) | Noise dominated (detector-on time) | Marked lightcurve |
|---|---|---|---|---|---|---|---|
| A | 5389 | 4319 | 0 | 0 | 0.00% | 0.00% | 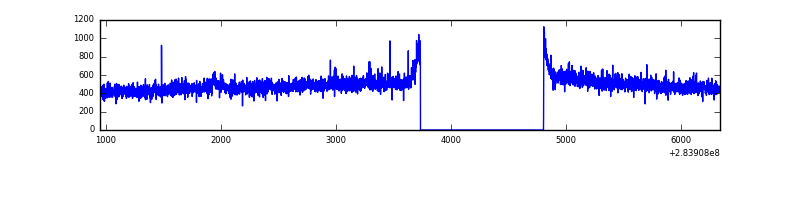 |
| B | 5389 | 4319 | 0 | 0 | 0.00% | 0.00% | 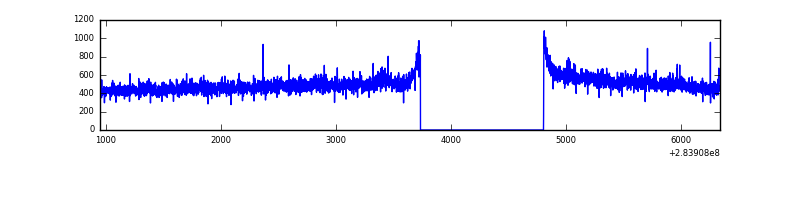 |
| C | 5388 | 4319 | 0 | 0 | 0.00% | 0.00% | 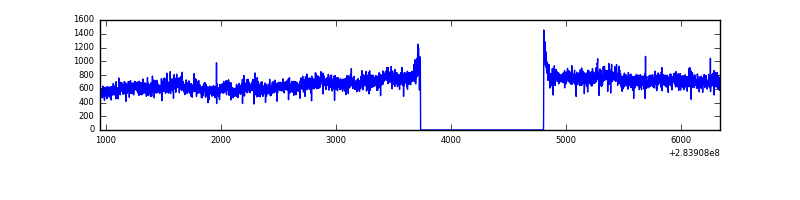 |
| D | 5388 | 4319 | 2 | 2 | 0.04% | 0.05% | 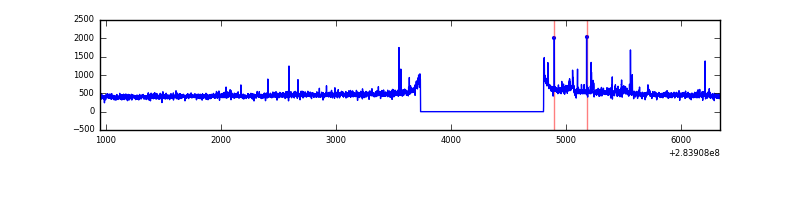 |
Top three noisy pixels from each quadrant. If the there are fewer than three noisy pixels in the level2.evt file, extra rows are filled as -1
| Pixel properties | Quadrant properties | ||||||
|---|---|---|---|---|---|---|---|
| Quadrant | DetID | PixID | Counts | Sigma | Mean | Median | Sigma |
| A | 0 | 13 | 21125 | 186.98 | 542 | 532 | 110.1 |
| A | 15 | 174 | 10767 | 92.93 | 542 | 532 | 110.1 |
| A | 0 | 226 | 4728 | 38.1 | 542 | 532 | 110.1 |
| B | 12 | 111 | 12390 | 112.32 | 541 | 527 | 105.6 |
| B | 11 | 111 | 11140 | 100.48 | 541 | 527 | 105.6 |
| B | 14 | 111 | 9369 | 83.72 | 541 | 527 | 105.6 |
| C | 3 | 233 | 795971 | 6535.34 | 518 | 523 | 121.7 |
| C | 14 | 238 | 80970 | 660.95 | 518 | 523 | 121.7 |
| C | 5 | 218 | 37599 | 304.61 | 518 | 523 | 121.7 |
| D | 13 | 189 | 64986 | 499.96 | 528 | 514 | 129.0 |
| D | 2 | 234 | 14435 | 107.95 | 528 | 514 | 129.0 |
| D | 2 | 152 | 9463 | 69.4 | 528 | 514 | 129.0 |
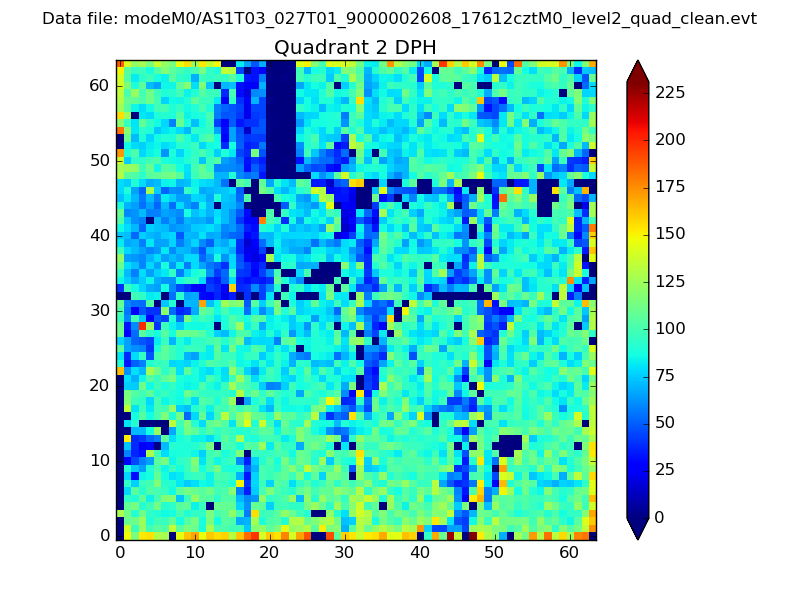
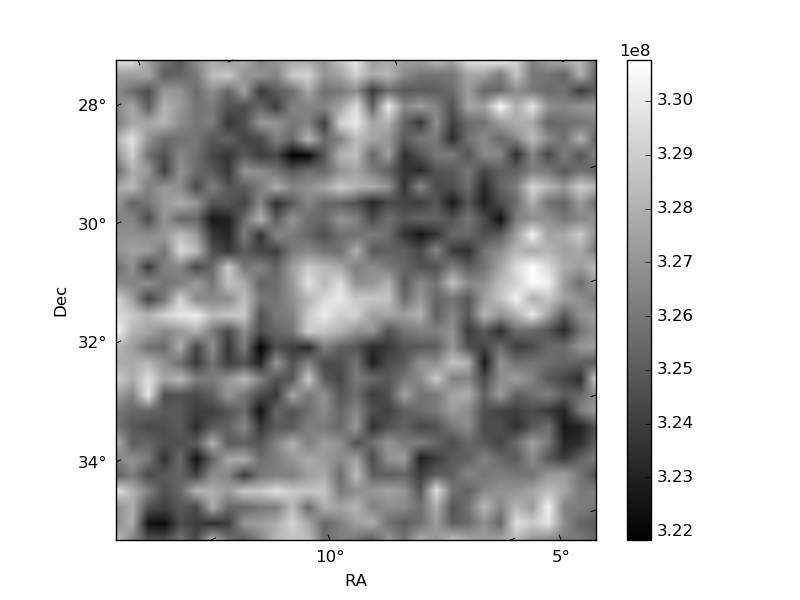
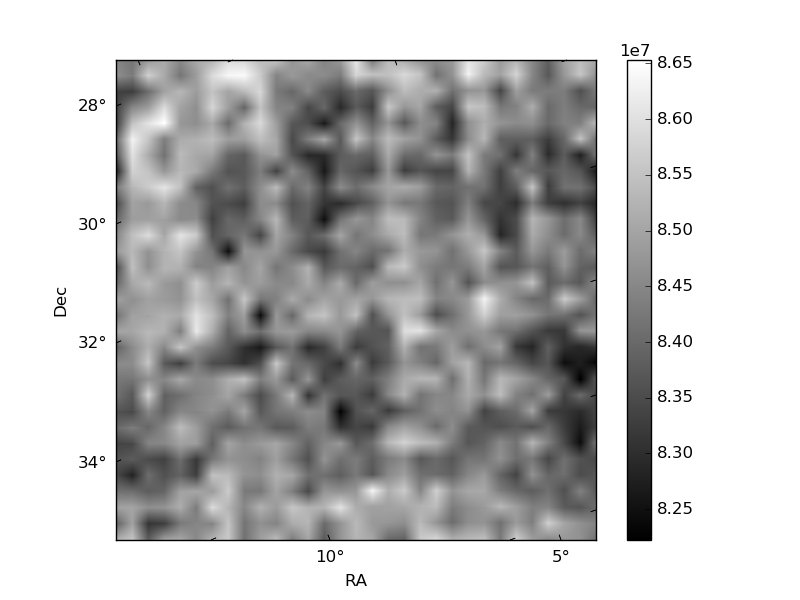
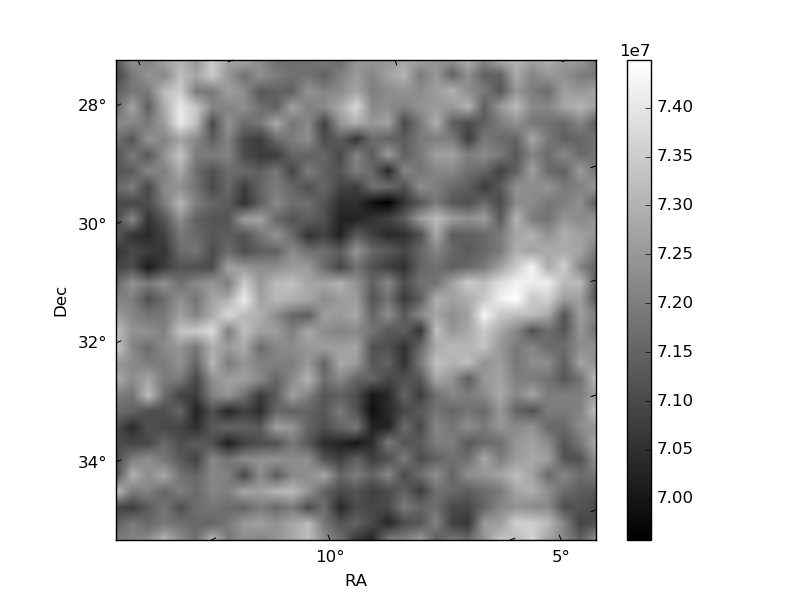
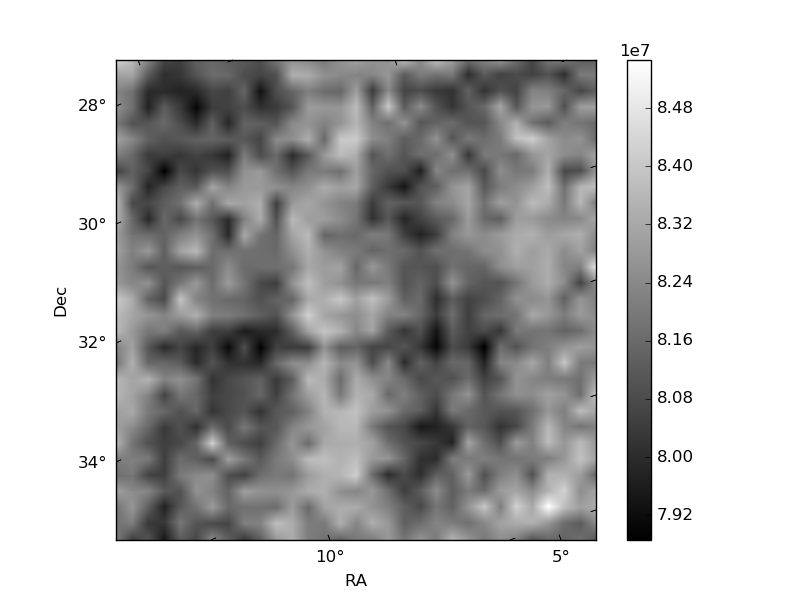
Histogram calculated using DETX and DETY for each event in the final _common_clean file
| Quadrant A | 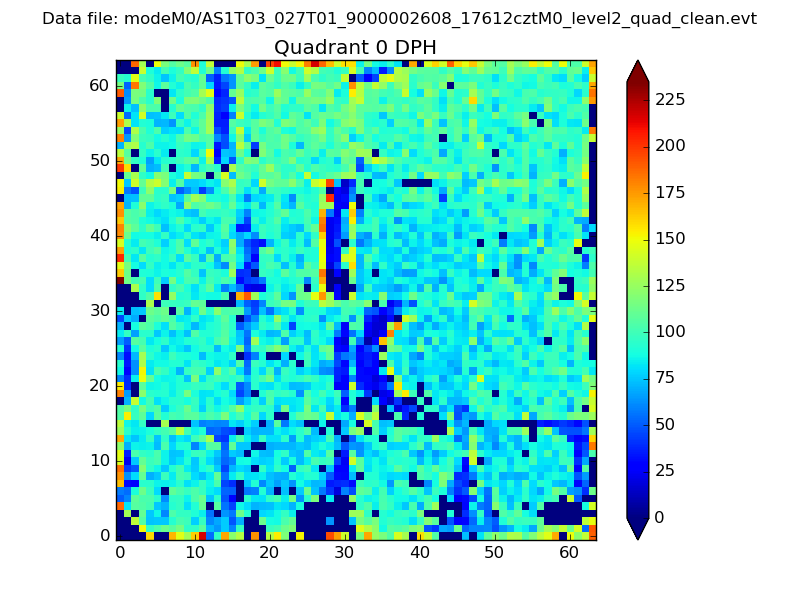 |
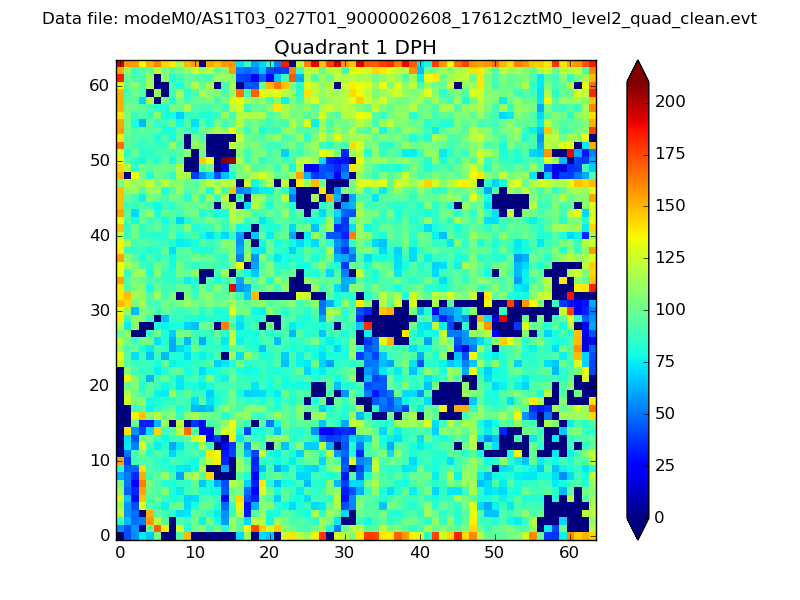 |
Quadrant B |
|---|---|---|---|
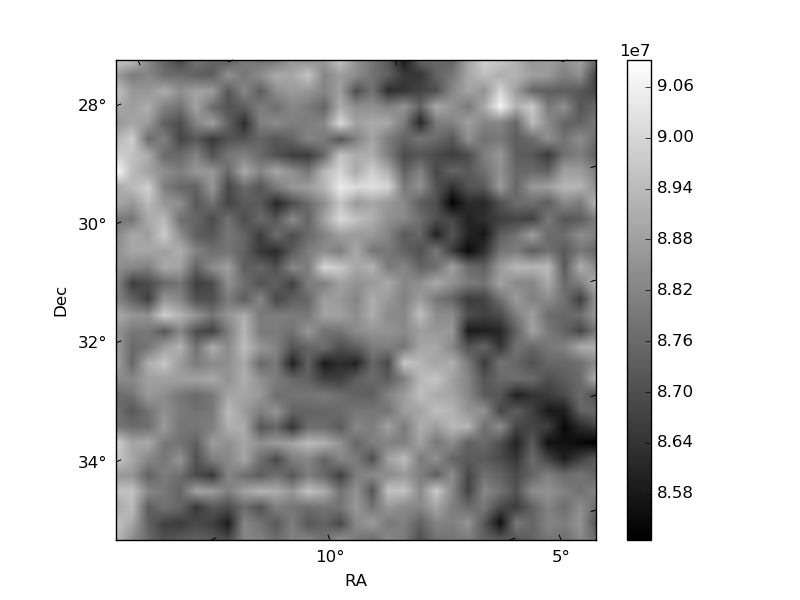
| Quadrant D | 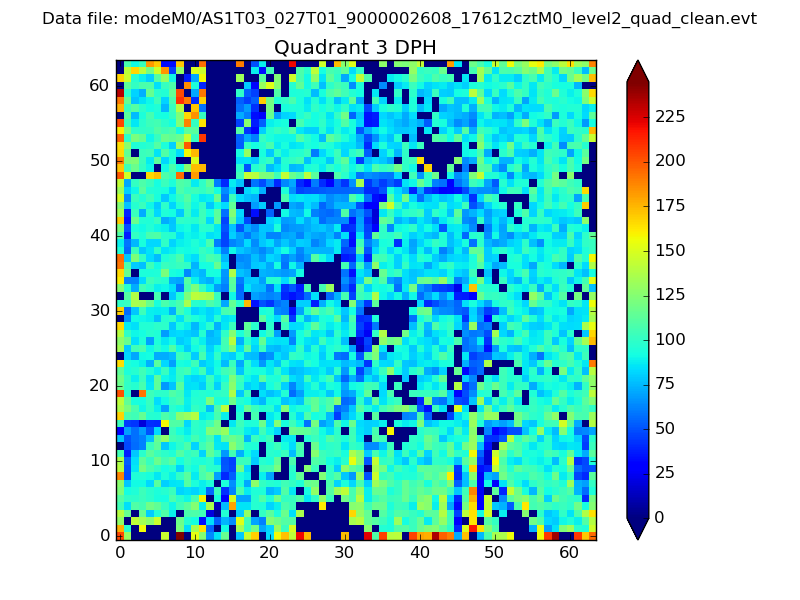 |
 |
Quadrant C |
| Plot type | Count rate plots | Images |
|---|---|---|
| Comparison with Poisson distribution Blue bars denote a histogram of data divided into 1 sec bins. Red curve is a Poisson curve with rate = median count rate of data. |
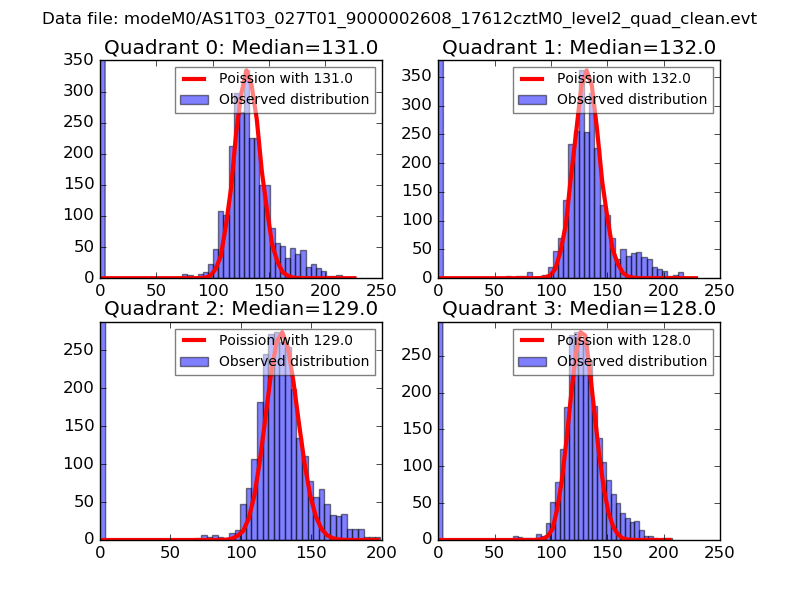 |
 |
| Quadrant-wise count rates Data is divided into 100 sec bins |
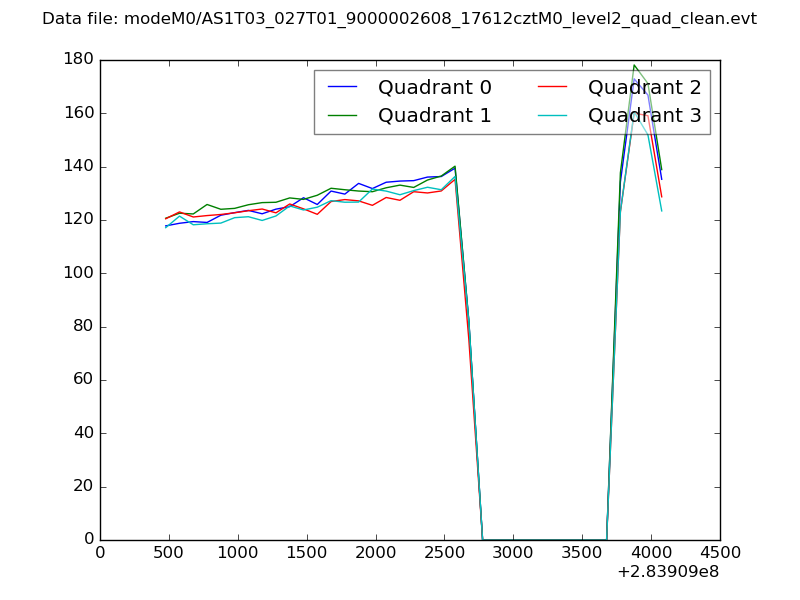 |
|
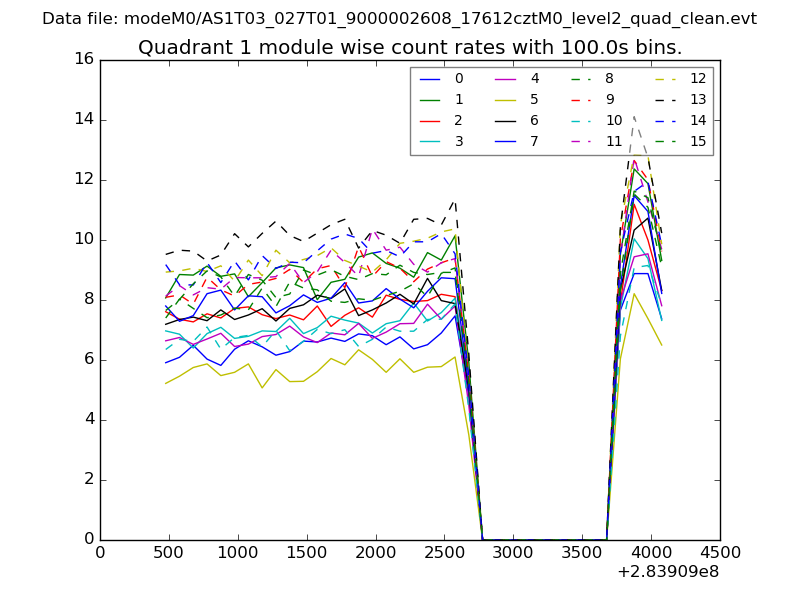
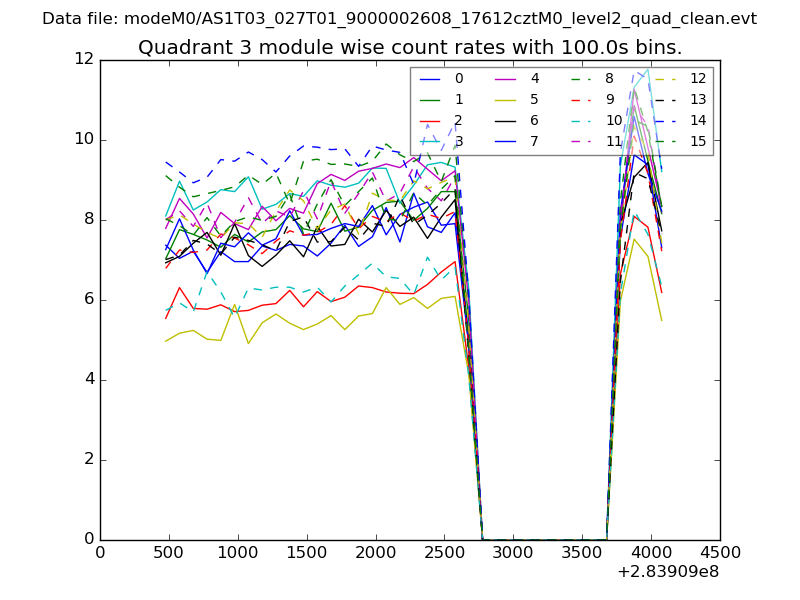
| Module-wise count rates for Quadrant A Data is divided into 100 sec bins |
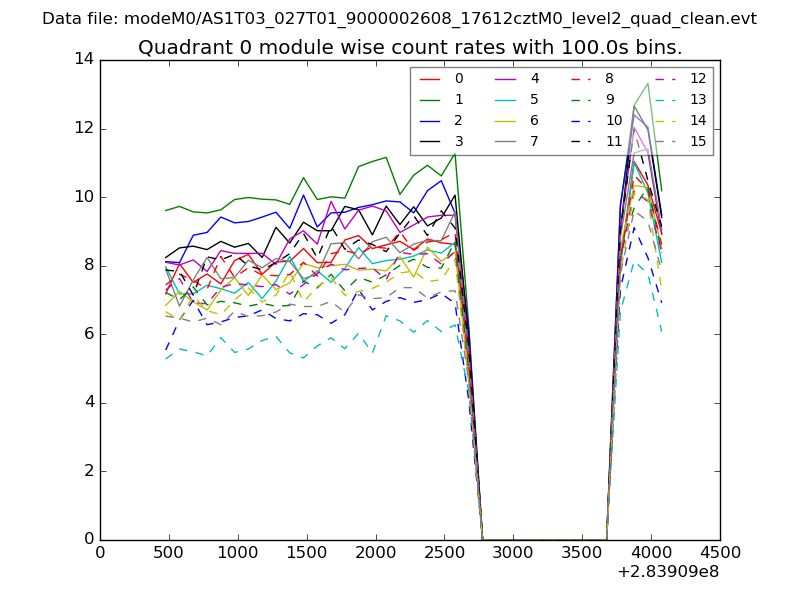 |
 |
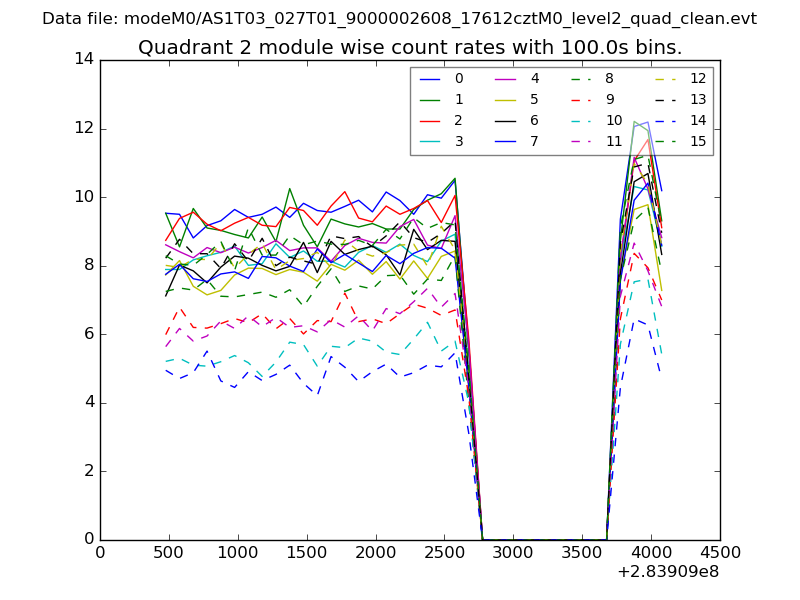
| Module-wise count rates for Quadrant B Data is divided into 100 sec bins |
 |
 |
| Module-wise count rates for Quadrant C Data is divided into 100 sec bins |
 |
 |
| Module-wise count rates for Quadrant D Data is divided into 100 sec bins |
 |
 |
| Parameter | Plot |
|---|---|
| CZT HV Monitor | 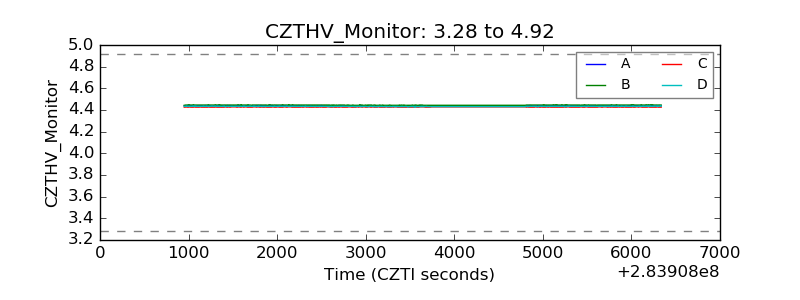 |
| D_VDD | 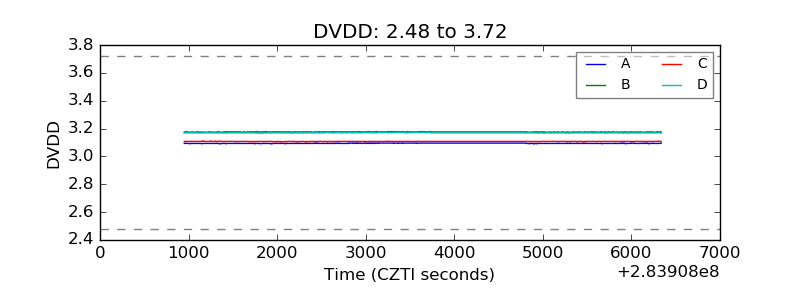 |
| Temperature 1 | 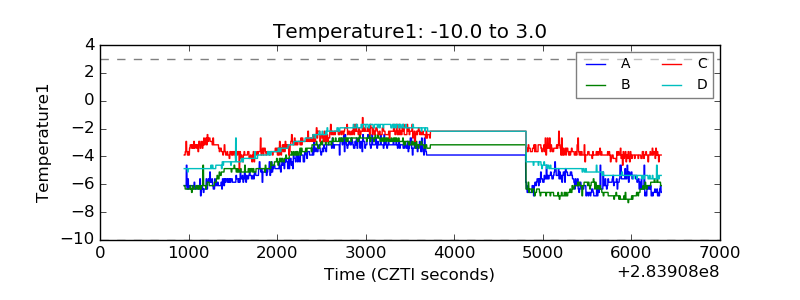 |
| Veto HV Monitor | 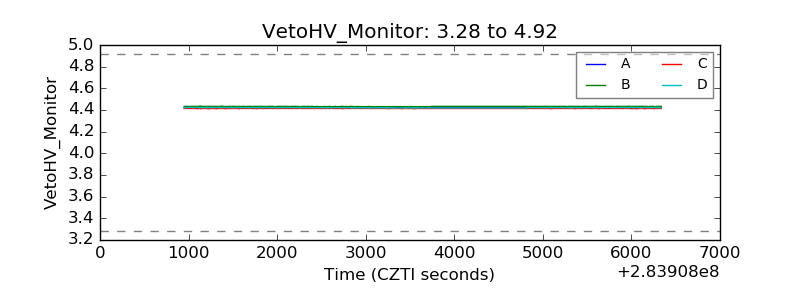 |
| Veto LLD | 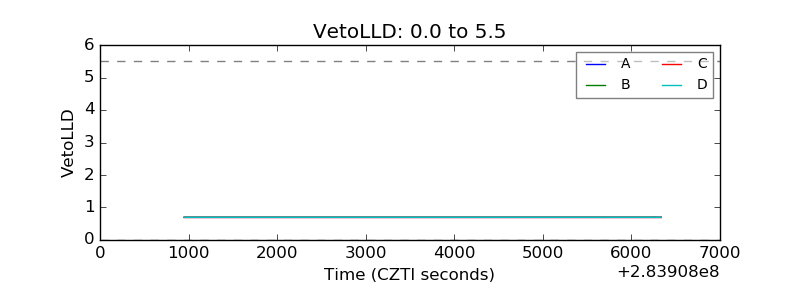 |
| Alpha Counter | 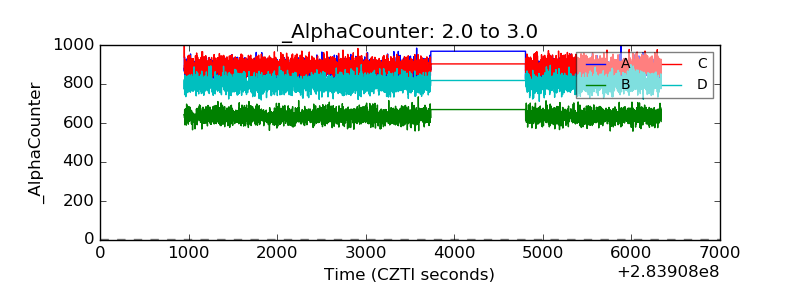 |
| _CPM_Rate | 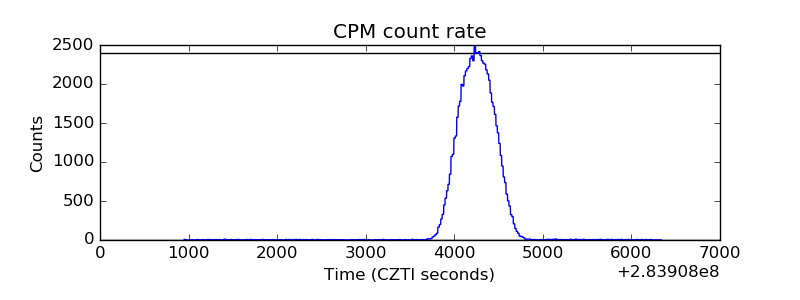 |
| CZT Counter | 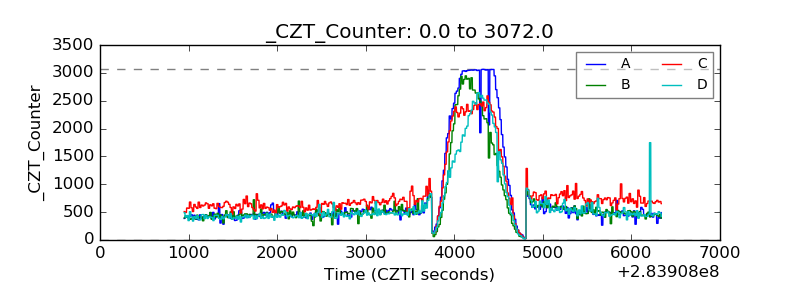 |
| +2.5 Volts monitor |  |
| +5 Volts monitor |  |
| _ROLL_ROT | 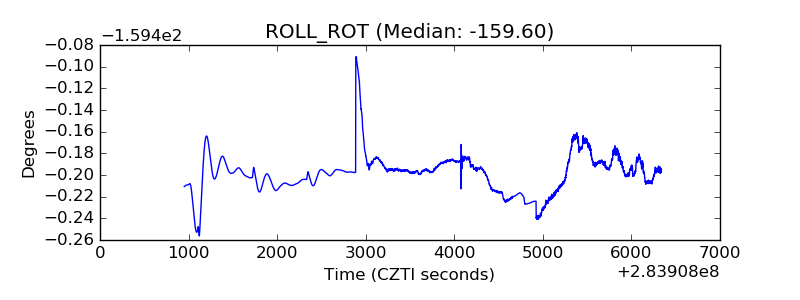 |
| _Roll_DEC | 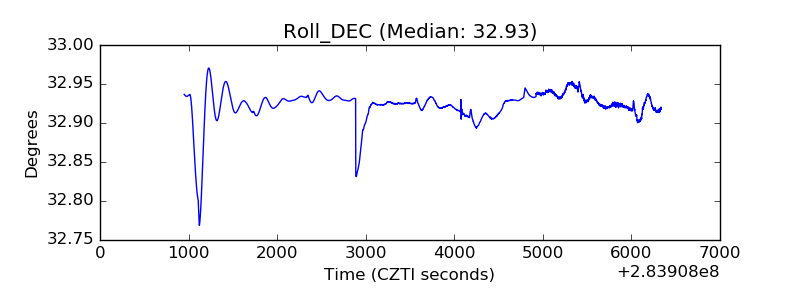 |
| _Roll_RA | 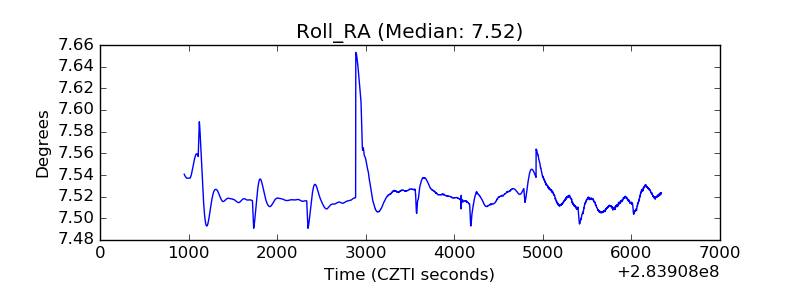 |
| Veto Counter | 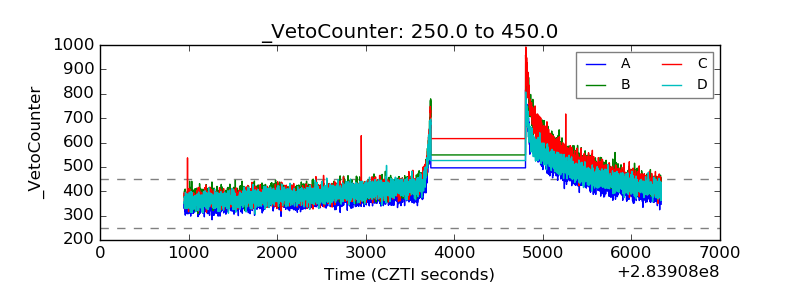 |