| Param | Original file | Final file |
|---|---|---|
| Filename | modeM0/AS1T03_027T01_9000002608_17613cztM0_level2.evt | modeM0/AS1T03_027T01_9000002608_17613cztM0_level2_quad_clean.evt |
| Size (bytes) | 681,768,000 | 110,727,360 |
| Size | 650.2 MB | 105.6 MB |
| Events in quadrant A | 4,553,332 | 683,603 |
| Events in quadrant B | 4,611,239 | 693,438 |
| Events in quadrant C | 6,410,234 | 665,862 |
| Events in quadrant D | 4,442,649 | 665,181 |
| Mode SS | |||
|---|---|---|---|
| Quadrant | BADHDUFLAG | Total packets | Discarded packets |
| A | 0 | 188 | 0 |
| B | 0 | 188 | 0 |
| C | 0 | 188 | 0 |
| D | 0 | 188 | 0 |
| Mode M9 | |||
|---|---|---|---|
| Quadrant | BADHDUFLAG | Total packets | Discarded packets |
| A | 0 | 24 | 0 |
| B | 0 | 24 | 0 |
| C | 0 | 24 | 0 |
| D | 0 | 24 | 0 |
| Mode M0 | |||
|---|---|---|---|
| Quadrant | BADHDUFLAG | Total packets | Discarded packets |
| A | 0 | 19304 | 2 |
| B | 0 | 19484 | 2 |
| C | 0 | 26781 | 2 |
| D | 0 | 19456 | 2 |
| Quadrant | Total seconds | Saturated seconds | Saturation percentage |
|---|---|---|---|
| A | 9310 | 44 | 0.472610% |
| B | 9310 | 55 | 0.590763% |
| C | 9310 | 124 | 1.331901% |
| D | 9310 | 33 | 0.354458% |
Noise dominated data is calculated using 1-second bins in cleaned event files. If a bin has >2000 counts, and if more than 50% of those come from <1% of pixels, then it is considered to be noise-dominated and hence unusable.
| Quadrant | # 1 sec bins | Bins with >0 counts | Bins with >2000 counts | High rate bins dominated by noise | Noise dominated (total time) | Noise dominated (detector-on time) | Marked lightcurve |
|---|---|---|---|---|---|---|---|
| A | 11610 | 9311 | 0 | 0 | 0.00% | 0.00% | 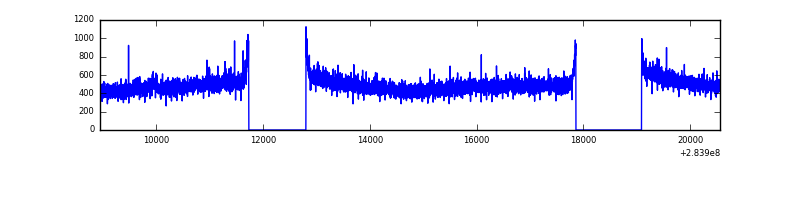 |
| B | 11610 | 9311 | 0 | 0 | 0.00% | 0.00% | 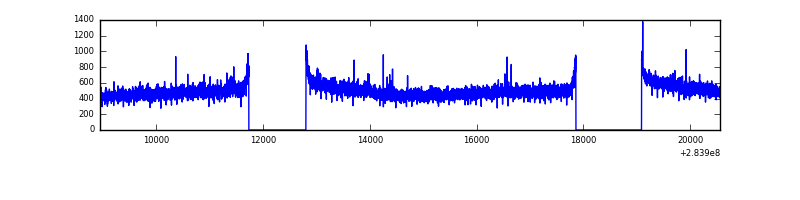 |
| C | 11610 | 9312 | 0 | 0 | 0.00% | 0.00% | 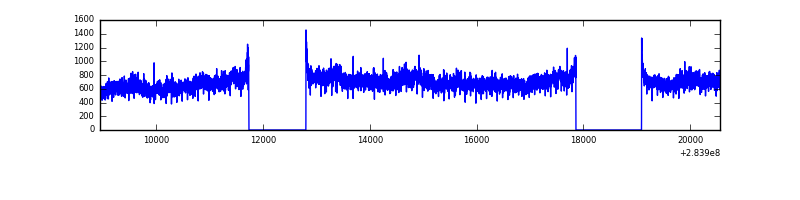 |
| D | 11610 | 9312 | 7 | 7 | 0.06% | 0.08% | 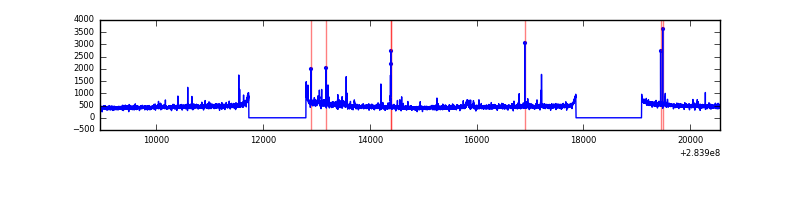 |
Top three noisy pixels from each quadrant. If the there are fewer than three noisy pixels in the level2.evt file, extra rows are filled as -1
| Pixel properties | Quadrant properties | ||||||
|---|---|---|---|---|---|---|---|
| Quadrant | DetID | PixID | Counts | Sigma | Mean | Median | Sigma |
| A | 0 | 13 | 21925 | 88.52 | 1173 | 1151 | 234.7 |
| A | 15 | 174 | 11673 | 44.84 | 1173 | 1151 | 234.7 |
| A | 13 | 210 | 11304 | 43.26 | 1173 | 1151 | 234.7 |
| B | 12 | 111 | 26500 | 114.08 | 1172 | 1142 | 222.3 |
| B | 11 | 111 | 23547 | 100.79 | 1172 | 1142 | 222.3 |
| B | 14 | 111 | 20194 | 85.71 | 1172 | 1142 | 222.3 |
| C | 3 | 233 | 1794225 | 6901.29 | 1120 | 1128 | 259.8 |
| C | 14 | 238 | 175662 | 671.75 | 1120 | 1128 | 259.8 |
| C | 5 | 218 | 76505 | 290.11 | 1120 | 1128 | 259.8 |
| D | 13 | 189 | 80726 | 290.0 | 1138 | 1109 | 274.5 |
| D | 2 | 234 | 31061 | 109.1 | 1138 | 1109 | 274.5 |
| D | 7 | 223 | 19459 | 66.84 | 1138 | 1109 | 274.5 |
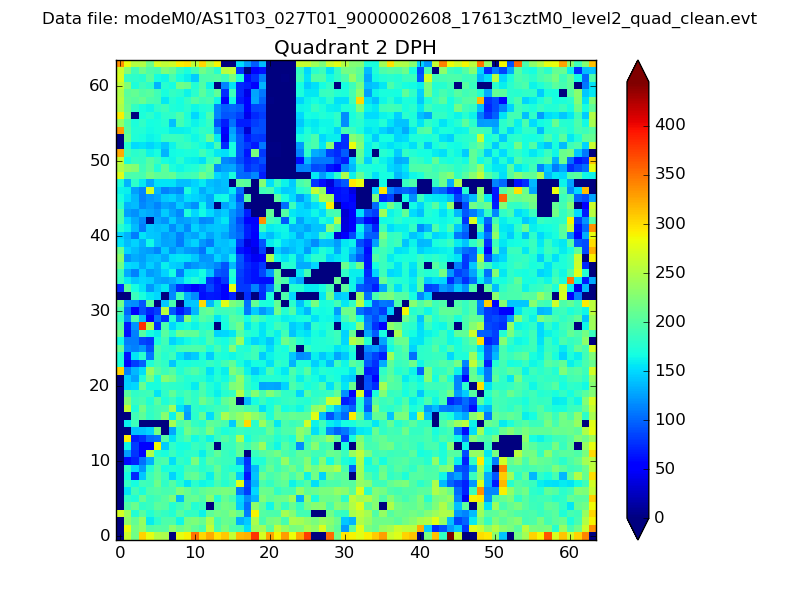
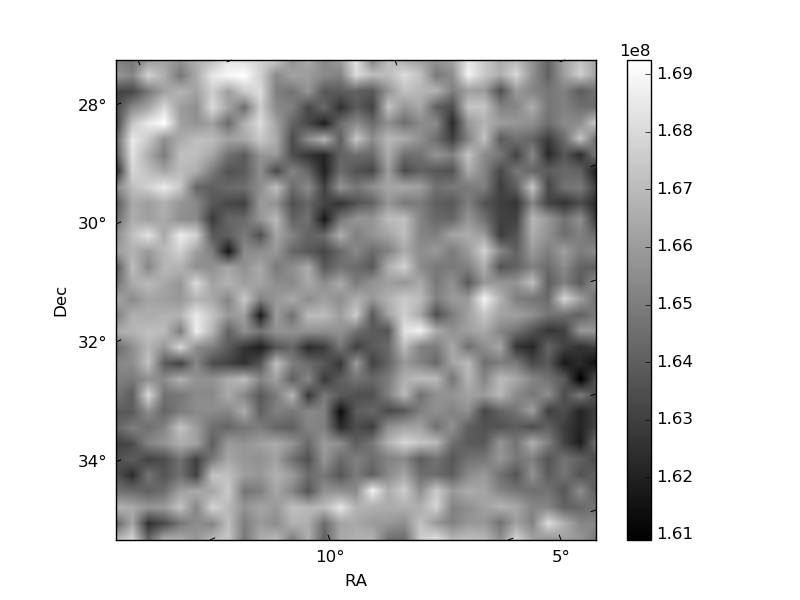
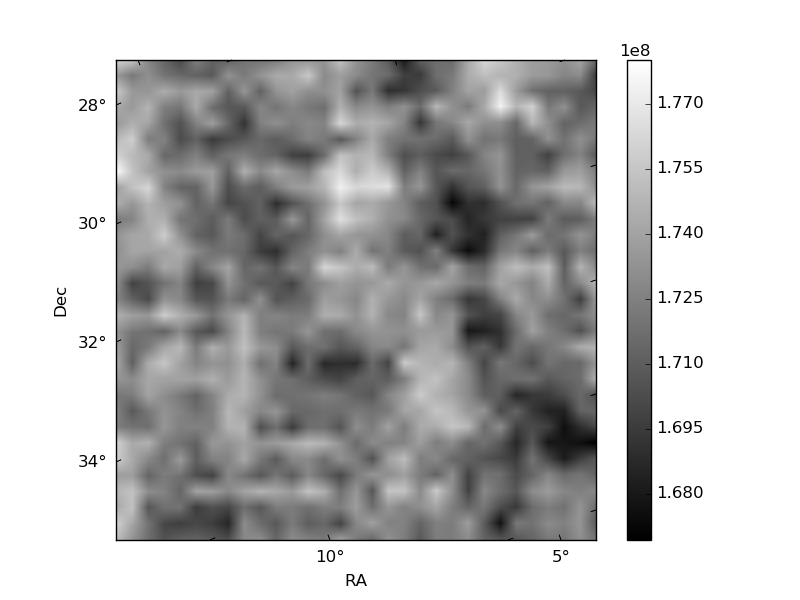
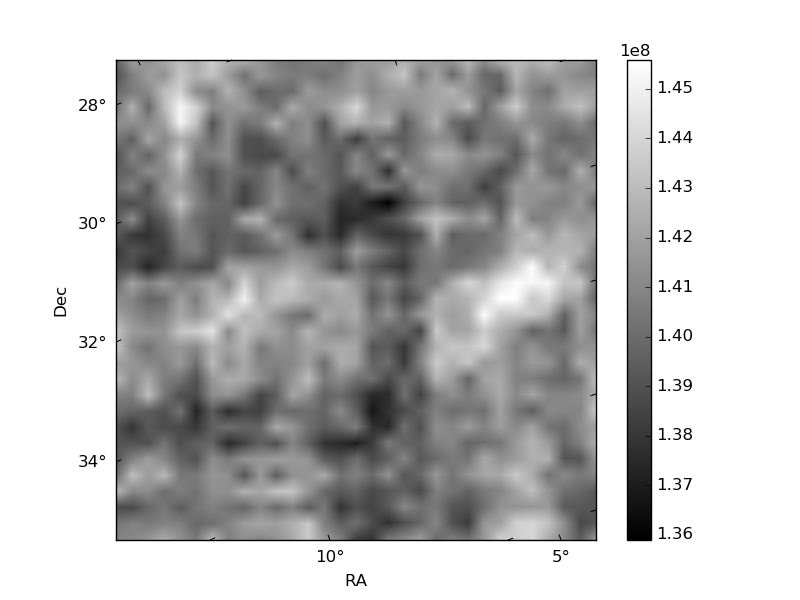
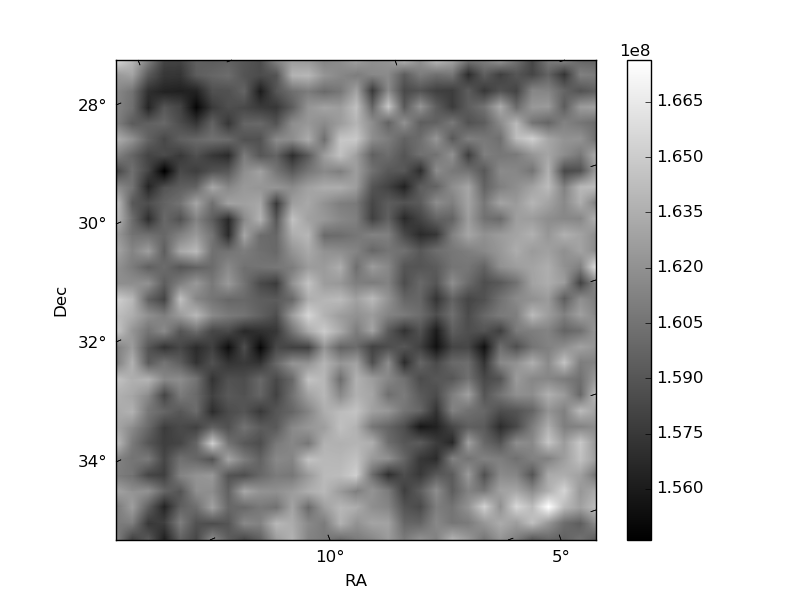
Histogram calculated using DETX and DETY for each event in the final _common_clean file
| Quadrant A |  |
 |
Quadrant B |
|---|---|---|---|
| Quadrant D | 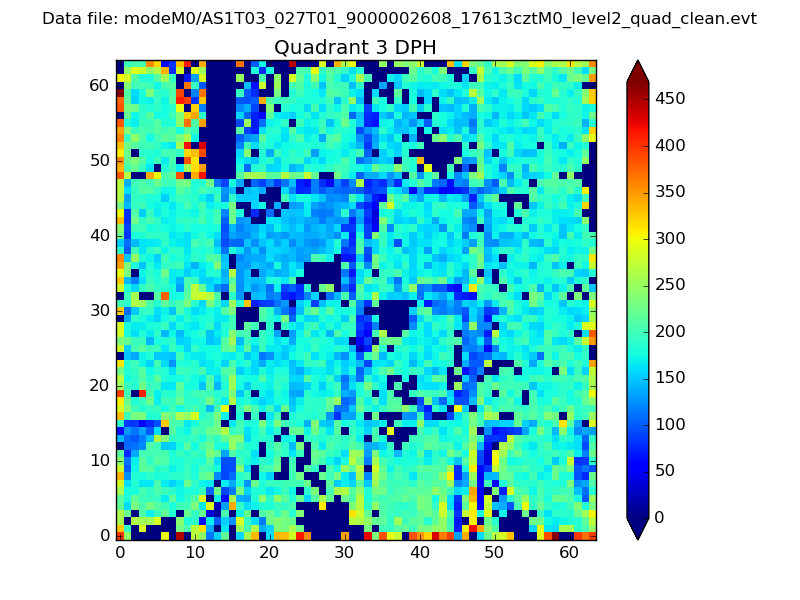 |
 |
Quadrant C |
| Plot type | Count rate plots | Images |
|---|---|---|
| Comparison with Poisson distribution Blue bars denote a histogram of data divided into 1 sec bins. Red curve is a Poisson curve with rate = median count rate of data. |
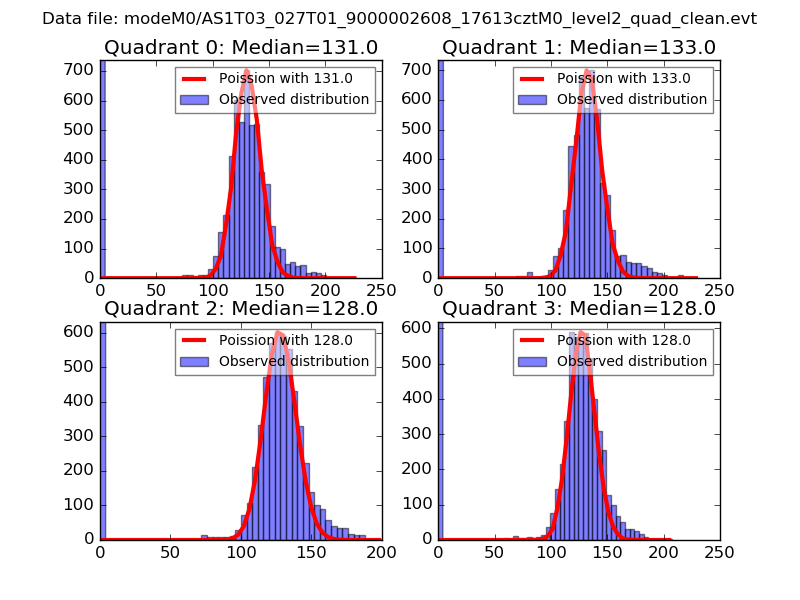 |
 |
| Quadrant-wise count rates Data is divided into 100 sec bins |
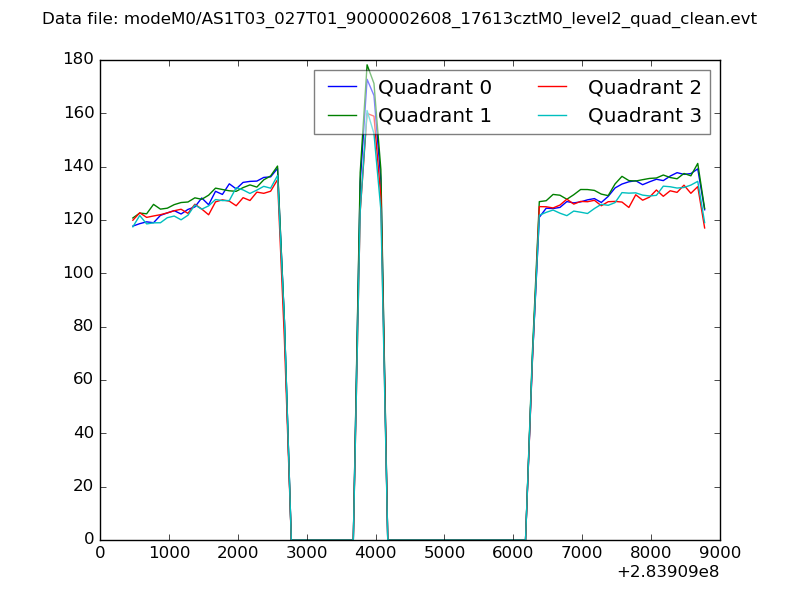 |
|
| Module-wise count rates for Quadrant A Data is divided into 100 sec bins |
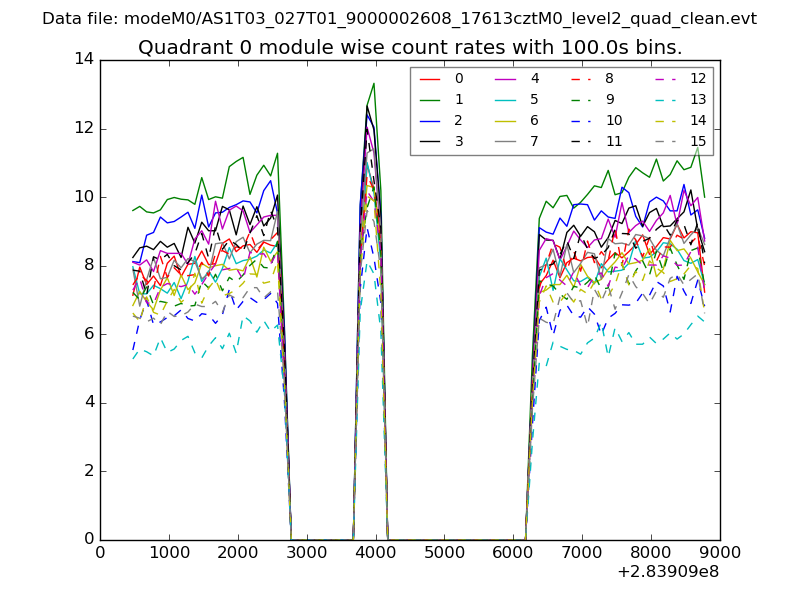 |
 |
| Module-wise count rates for Quadrant B Data is divided into 100 sec bins |
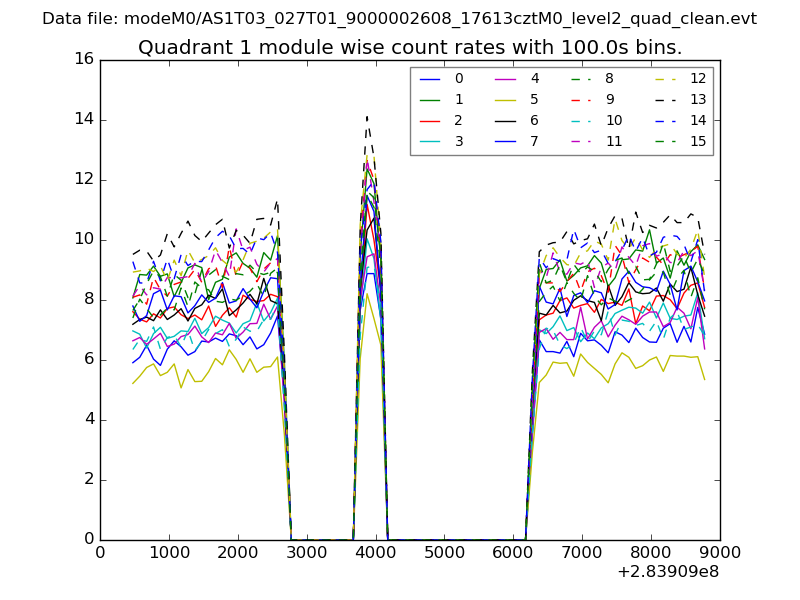 |
 |
| Module-wise count rates for Quadrant C Data is divided into 100 sec bins |
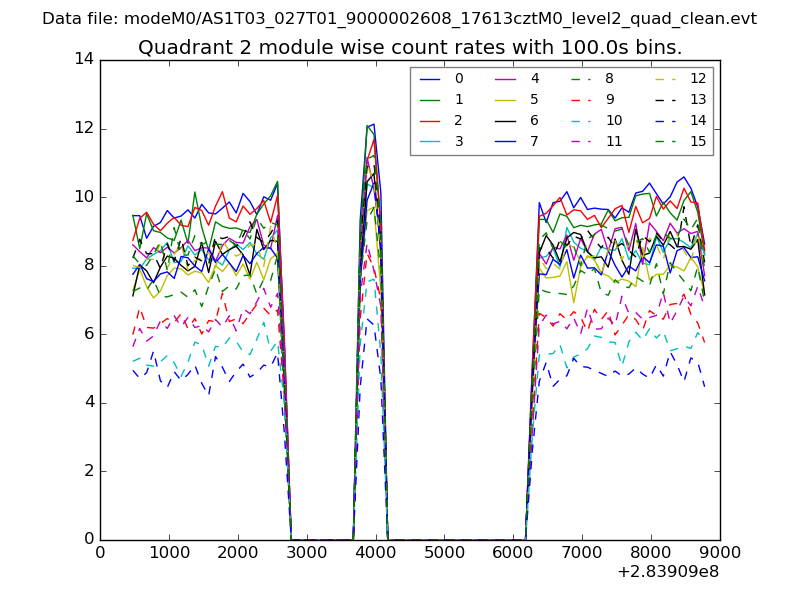 |
 |
| Module-wise count rates for Quadrant D Data is divided into 100 sec bins |
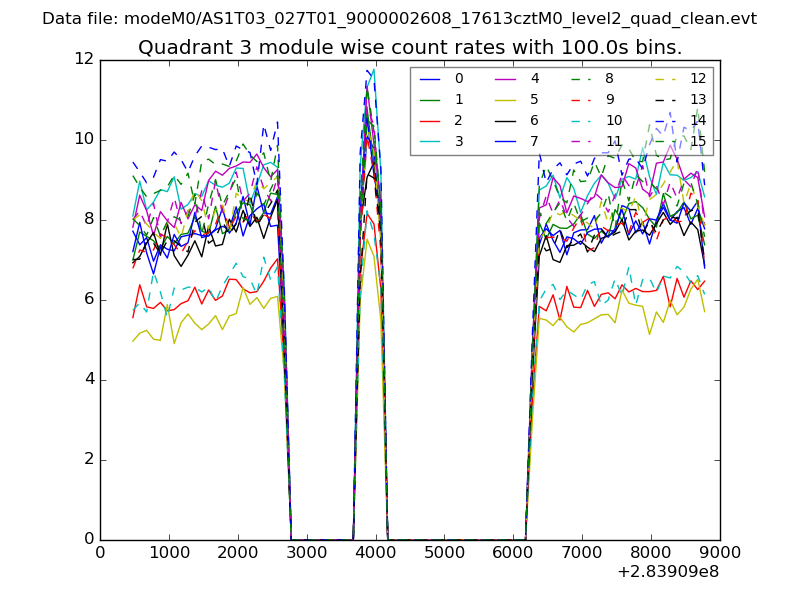 |
 |
| Parameter | Plot |
|---|---|
| CZT HV Monitor | 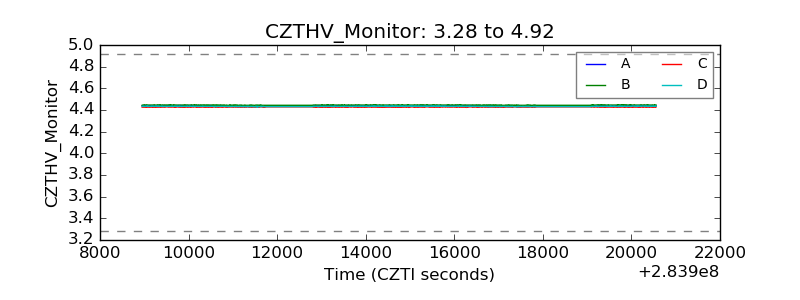 |
| D_VDD | 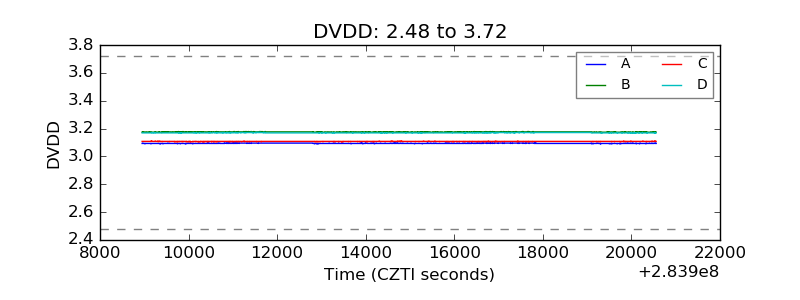 |
| Temperature 1 | 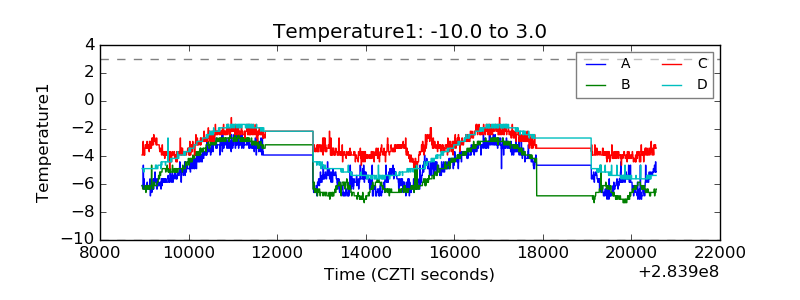 |
| Veto HV Monitor | 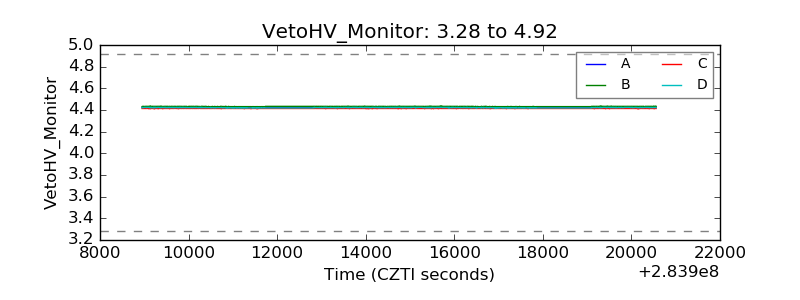 |
| Veto LLD | 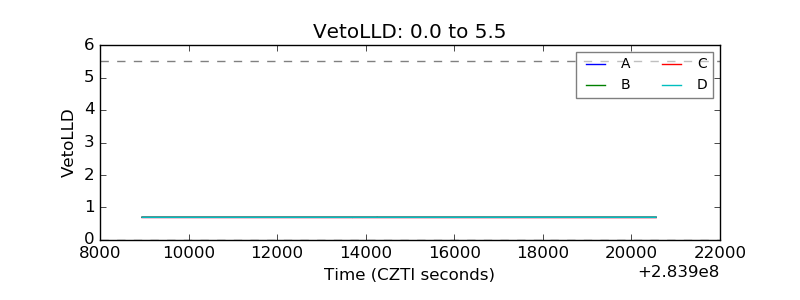 |
| Alpha Counter | 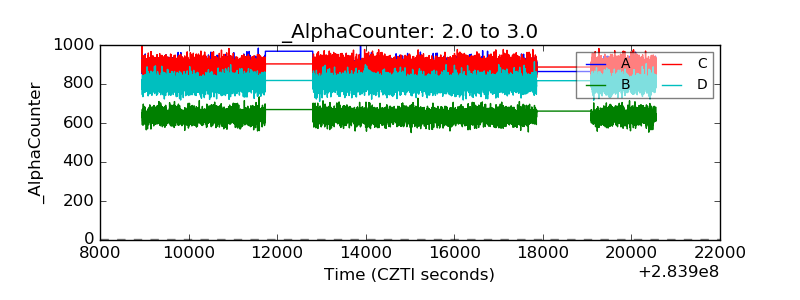 |
| _CPM_Rate | 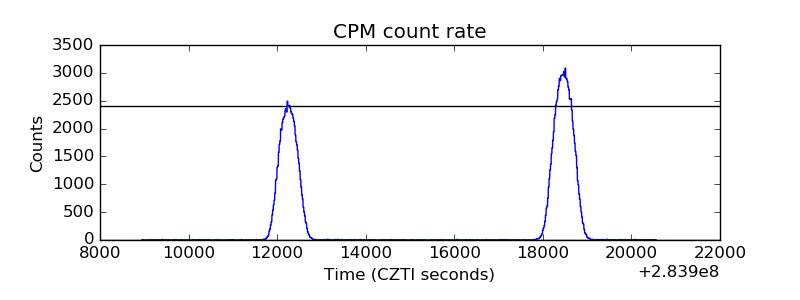 |
| CZT Counter | 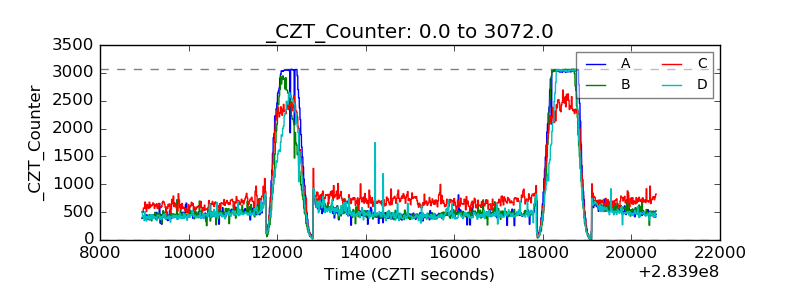 |
| +2.5 Volts monitor |  |
| +5 Volts monitor |  |
| _ROLL_ROT | 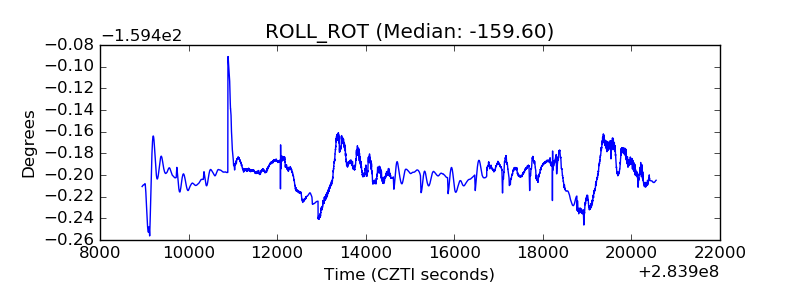 |
| _Roll_DEC | 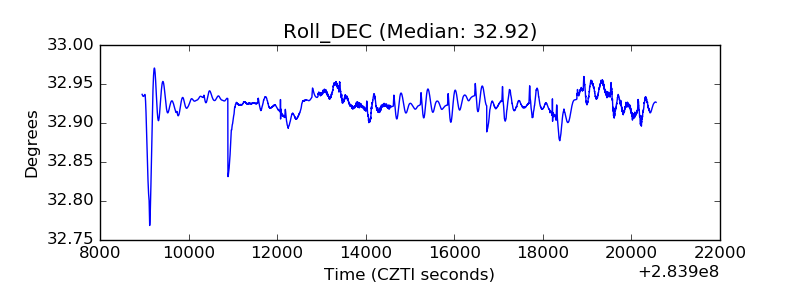 |
| _Roll_RA |  |
| Veto Counter | 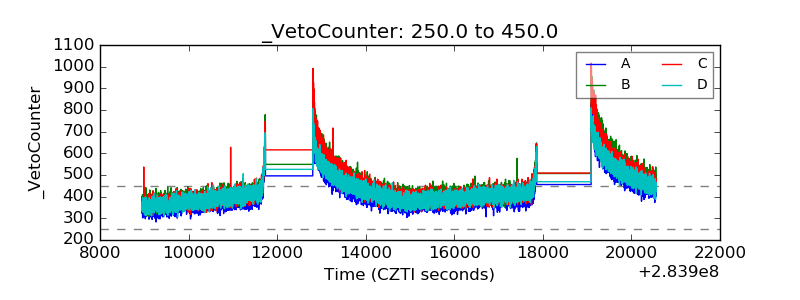 |