| Param | Original file | Final file |
|---|---|---|
| Filename | modeM0/AS1T03_027T01_9000002608_17615cztM0_level2.evt | modeM0/AS1T03_027T01_9000002608_17615cztM0_level2_quad_clean.evt |
| Size (bytes) | 511,876,800 | 74,347,200 |
| Size | 488.2 MB | 70.9 MB |
| Events in quadrant A | 3,309,415 | 461,592 |
| Events in quadrant B | 3,353,694 | 469,643 |
| Events in quadrant C | 4,776,152 | 441,856 |
| Events in quadrant D | 3,638,738 | 441,148 |
| Mode SS | |||
|---|---|---|---|
| Quadrant | BADHDUFLAG | Total packets | Discarded packets |
| A | 0 | 128 | 0 |
| B | 0 | 128 | 0 |
| C | 0 | 128 | 0 |
| D | 0 | 128 | 0 |
| Mode M9 | |||
|---|---|---|---|
| Quadrant | BADHDUFLAG | Total packets | Discarded packets |
| A | 0 | 21 | 0 |
| B | 0 | 22 | 0 |
| C | 0 | 22 | 0 |
| D | 0 | 22 | 0 |
| Mode M0 | |||
|---|---|---|---|
| Quadrant | BADHDUFLAG | Total packets | Discarded packets |
| A | 0 | 13518 | 2 |
| B | 0 | 13770 | 2 |
| C | 0 | 18893 | 2 |
| D | 0 | 14773 | 2 |
| Quadrant | Total seconds | Saturated seconds | Saturation percentage |
|---|---|---|---|
| A | 6257 | 64 | 1.022854% |
| B | 6257 | 96 | 1.534282% |
| C | 6257 | 156 | 2.493208% |
| D | 6257 | 70 | 1.118747% |
Noise dominated data is calculated using 1-second bins in cleaned event files. If a bin has >2000 counts, and if more than 50% of those come from <1% of pixels, then it is considered to be noise-dominated and hence unusable.
| Quadrant | # 1 sec bins | Bins with >0 counts | Bins with >2000 counts | High rate bins dominated by noise | Noise dominated (total time) | Noise dominated (detector-on time) | Marked lightcurve |
|---|---|---|---|---|---|---|---|
| A | 7577 | 6258 | 0 | 0 | 0.00% | 0.00% | 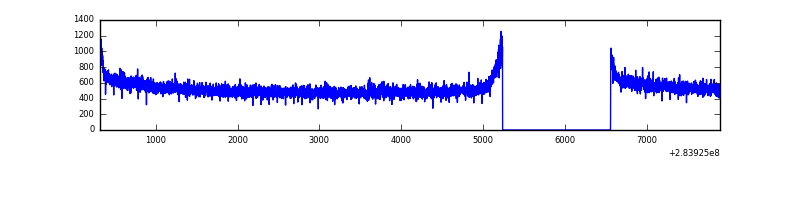 |
| B | 7577 | 6258 | 0 | 0 | 0.00% | 0.00% | 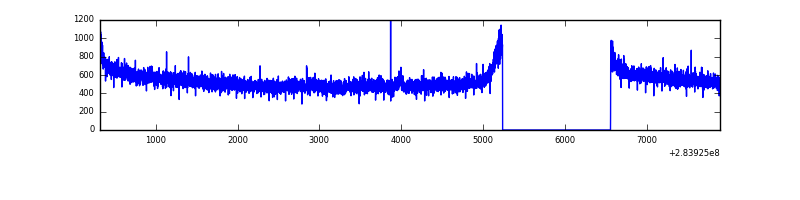 |
| C | 7577 | 6258 | 0 | 0 | 0.00% | 0.00% | 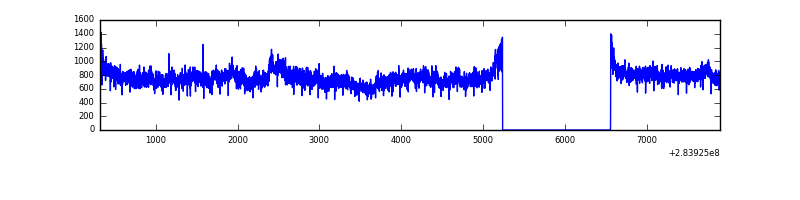 |
| D | 7577 | 6258 | 32 | 32 | 0.42% | 0.51% | 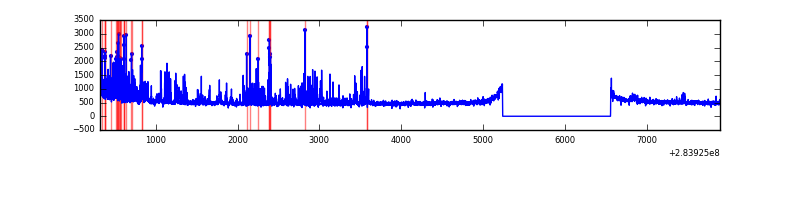 |
Top three noisy pixels from each quadrant. If the there are fewer than three noisy pixels in the level2.evt file, extra rows are filled as -1
| Pixel properties | Quadrant properties | ||||||
|---|---|---|---|---|---|---|---|
| Quadrant | DetID | PixID | Counts | Sigma | Mean | Median | Sigma |
| A | 13 | 210 | 8624 | 45.64 | 858 | 844 | 170.5 |
| A | 0 | 226 | 7483 | 38.95 | 858 | 844 | 170.5 |
| A | 12 | 194 | 6086 | 30.75 | 858 | 844 | 170.5 |
| B | 12 | 111 | 18584 | 110.9 | 857 | 839 | 160.0 |
| B | 11 | 111 | 16370 | 97.06 | 857 | 839 | 160.0 |
| B | 14 | 111 | 14341 | 84.38 | 857 | 839 | 160.0 |
| C | 3 | 233 | 1450718 | 7771.22 | 808 | 817 | 186.6 |
| C | 14 | 238 | 126296 | 672.55 | 808 | 817 | 186.6 |
| C | 5 | 218 | 45411 | 239.02 | 808 | 817 | 186.6 |
| D | 13 | 168 | 468504 | 2373.17 | 821 | 801 | 197.1 |
| D | 13 | 104 | 33440 | 165.61 | 821 | 801 | 197.1 |
| D | 2 | 234 | 19183 | 93.27 | 821 | 801 | 197.1 |
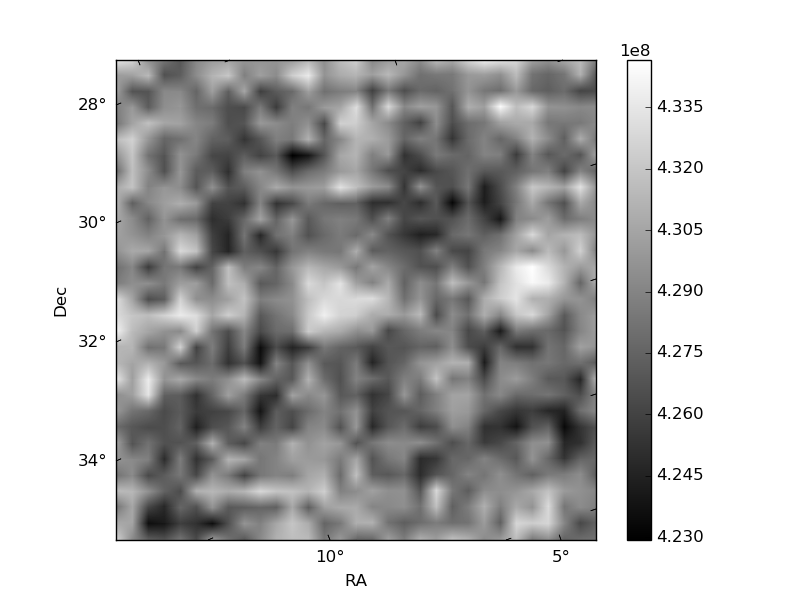
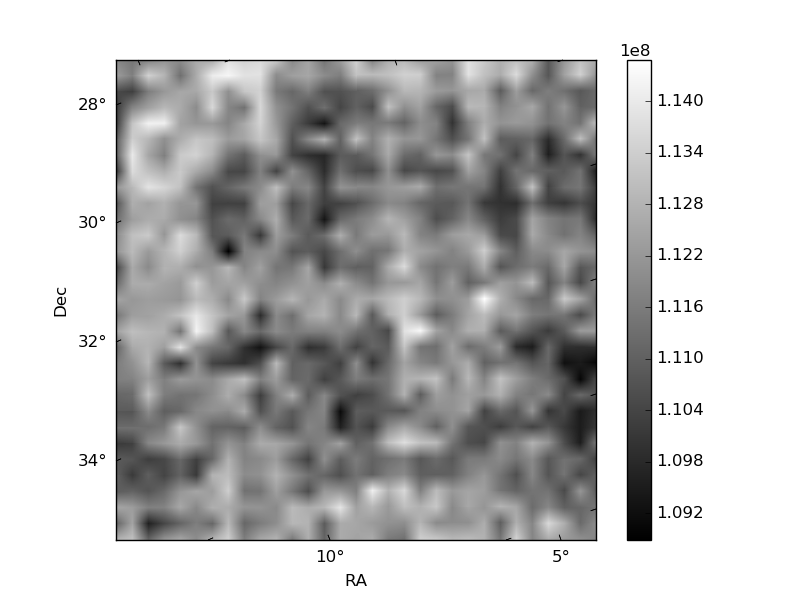
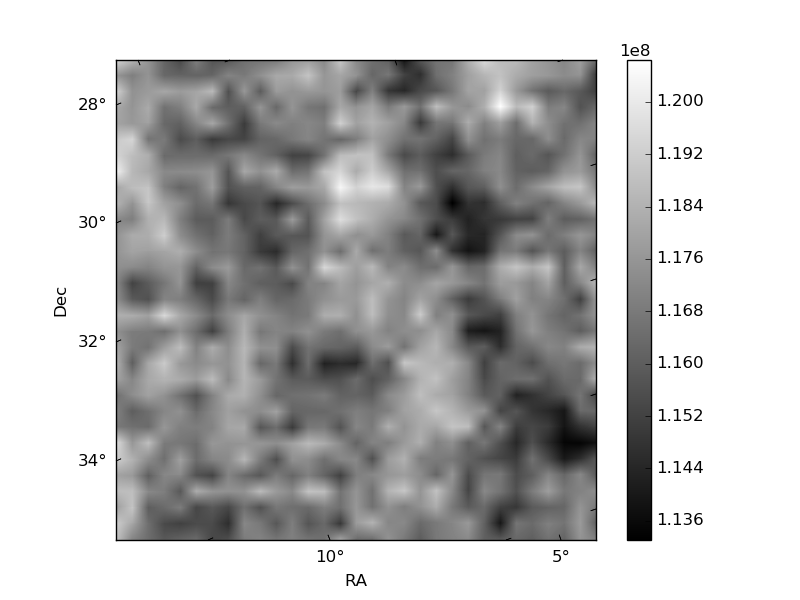
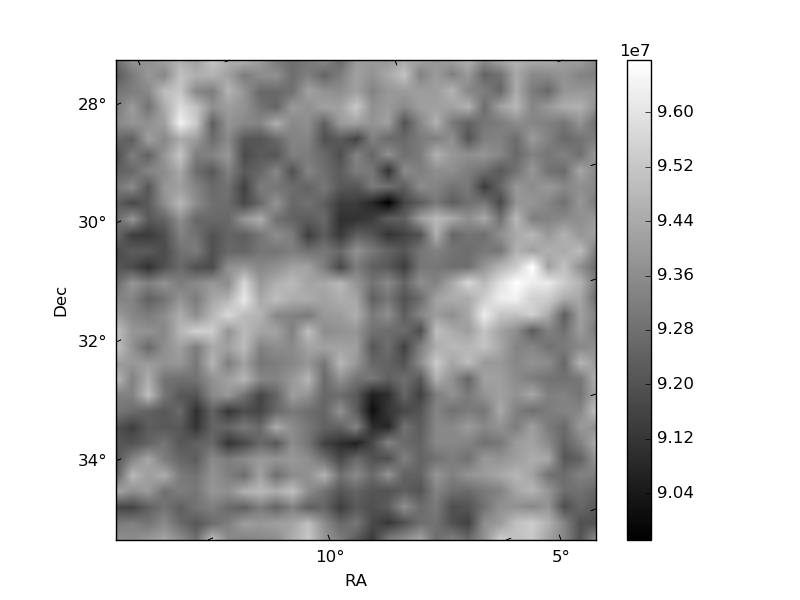
Histogram calculated using DETX and DETY for each event in the final _common_clean file
| Quadrant A | 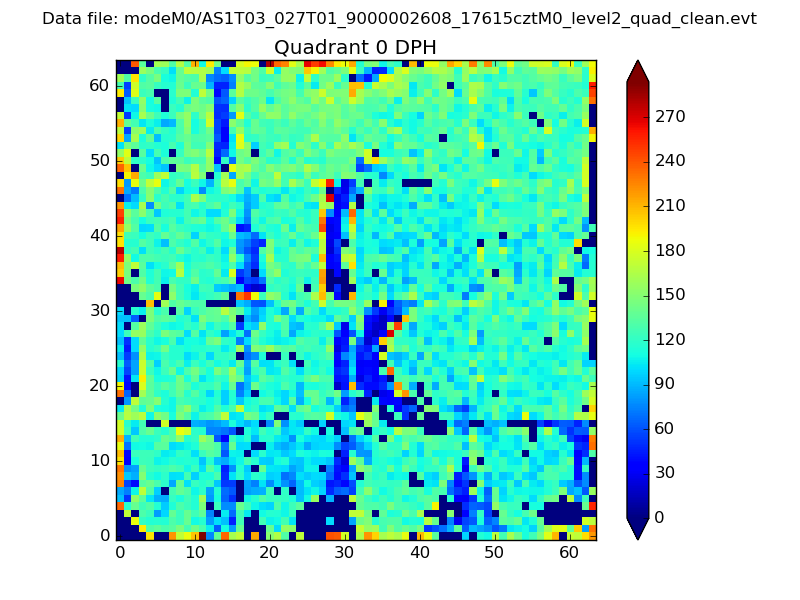 |
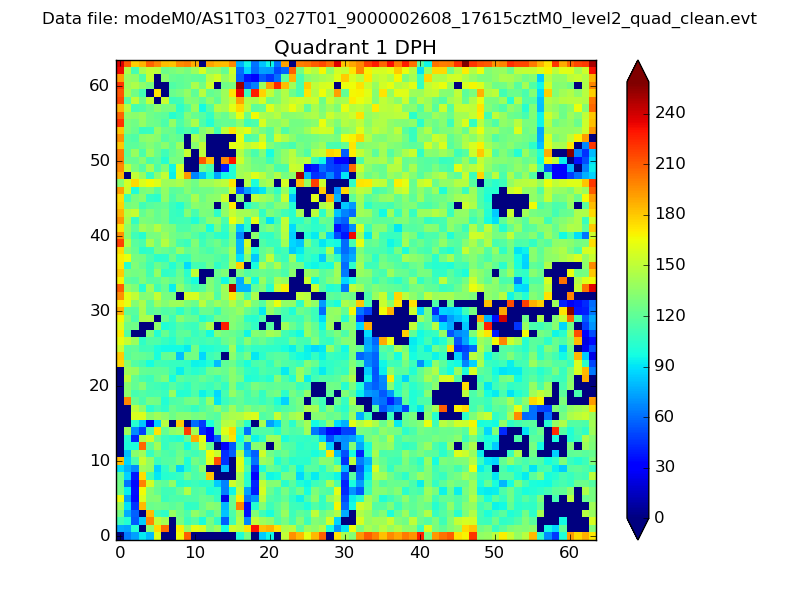 |
Quadrant B |
|---|---|---|---|
| Quadrant D | 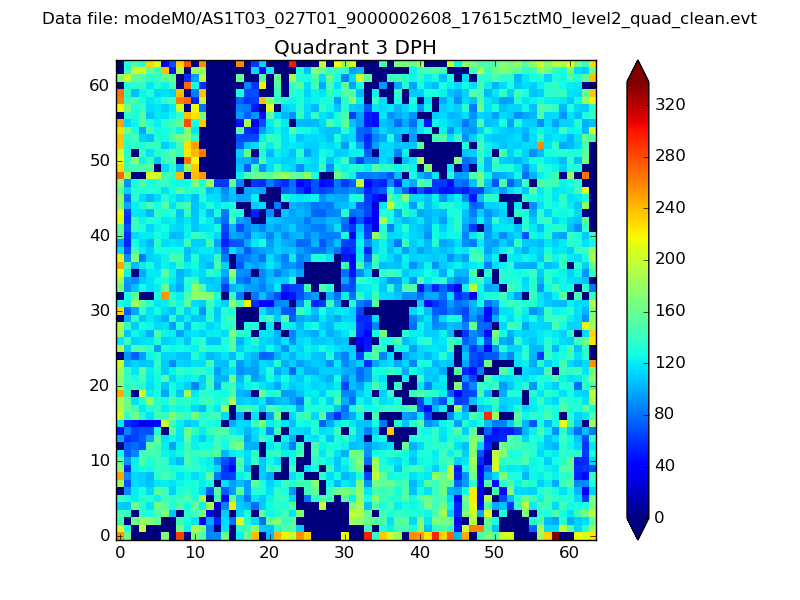 |
 |
Quadrant C |
| Plot type | Count rate plots | Images |
|---|---|---|
| Comparison with Poisson distribution Blue bars denote a histogram of data divided into 1 sec bins. Red curve is a Poisson curve with rate = median count rate of data. |
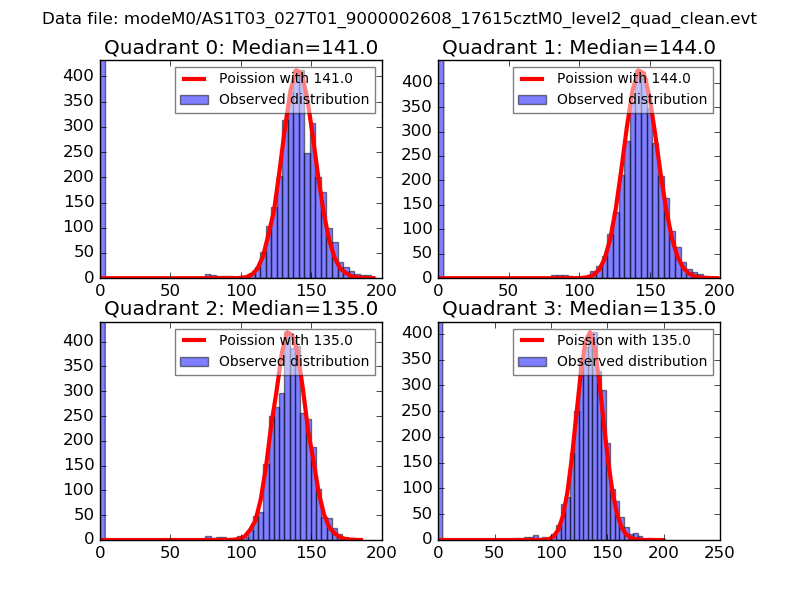 |
 |
| Quadrant-wise count rates Data is divided into 100 sec bins |
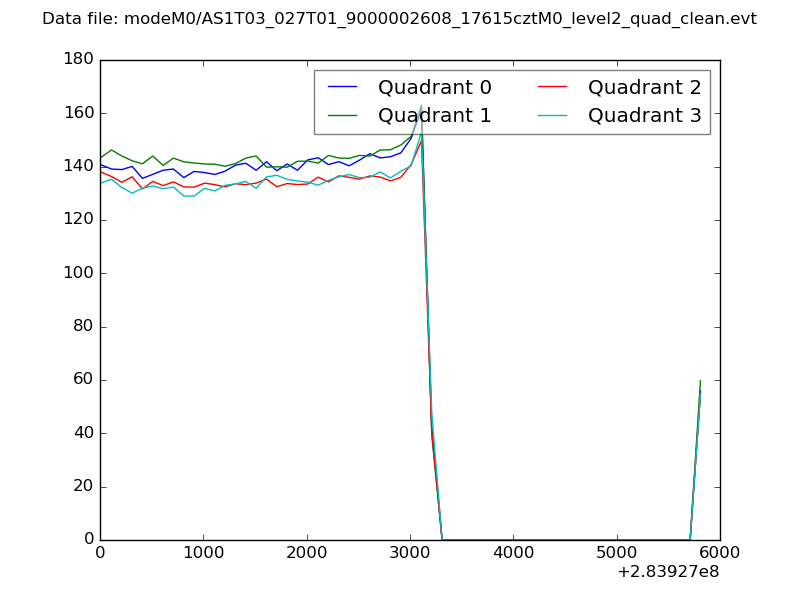 |
|
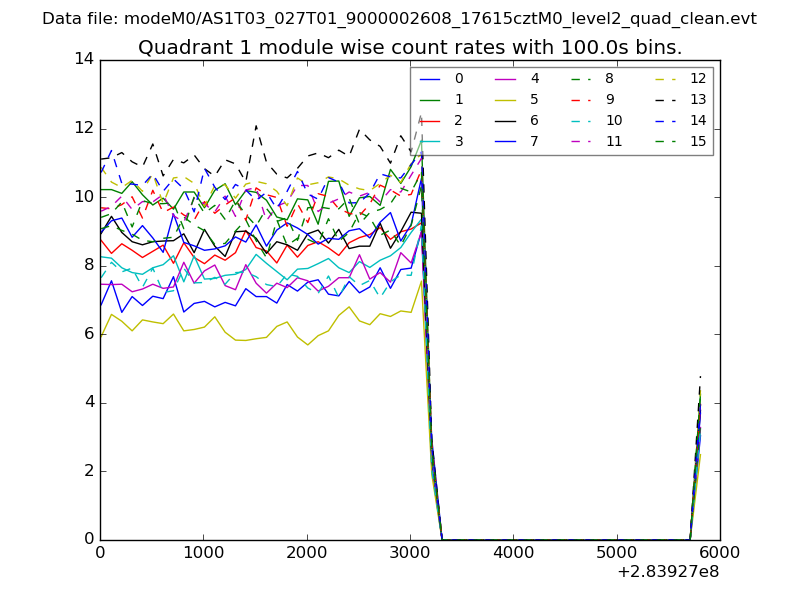
| Module-wise count rates for Quadrant A Data is divided into 100 sec bins |
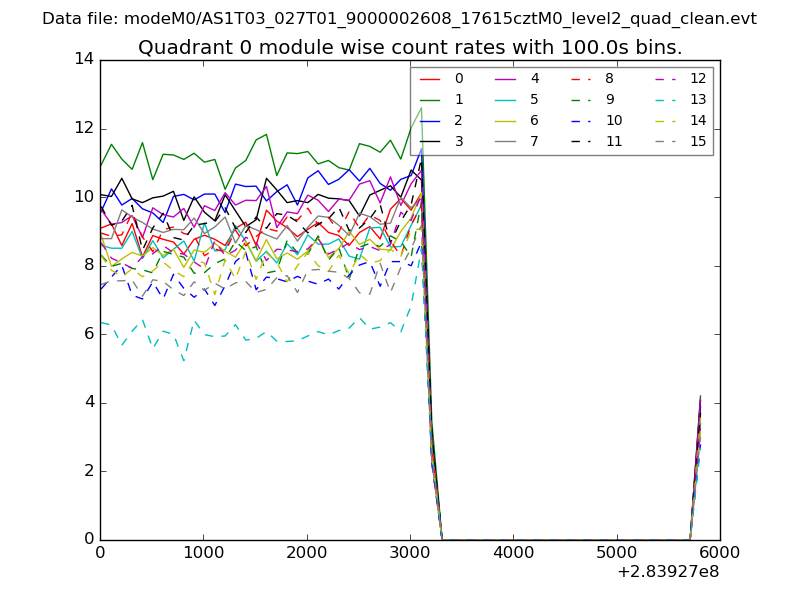 |
 |
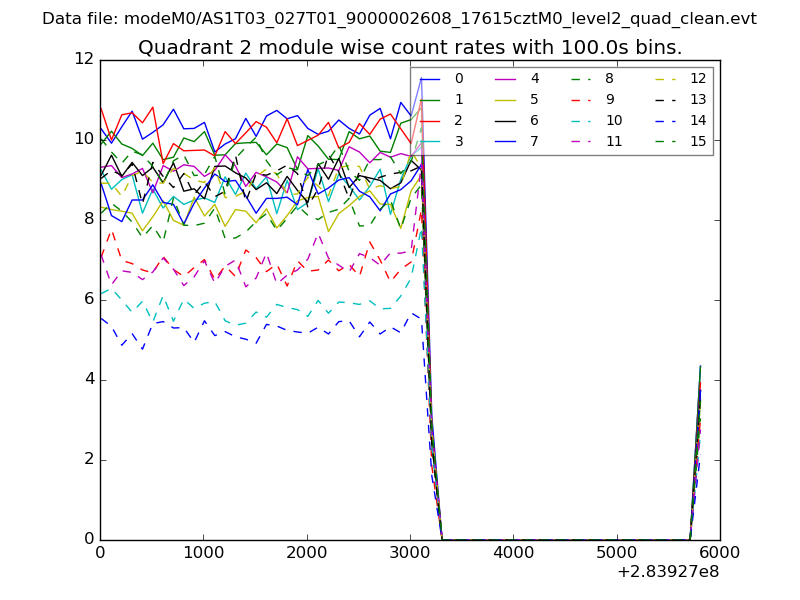
| Module-wise count rates for Quadrant B Data is divided into 100 sec bins |
 |
 |
| Module-wise count rates for Quadrant C Data is divided into 100 sec bins |
 |
 |
| Module-wise count rates for Quadrant D Data is divided into 100 sec bins |
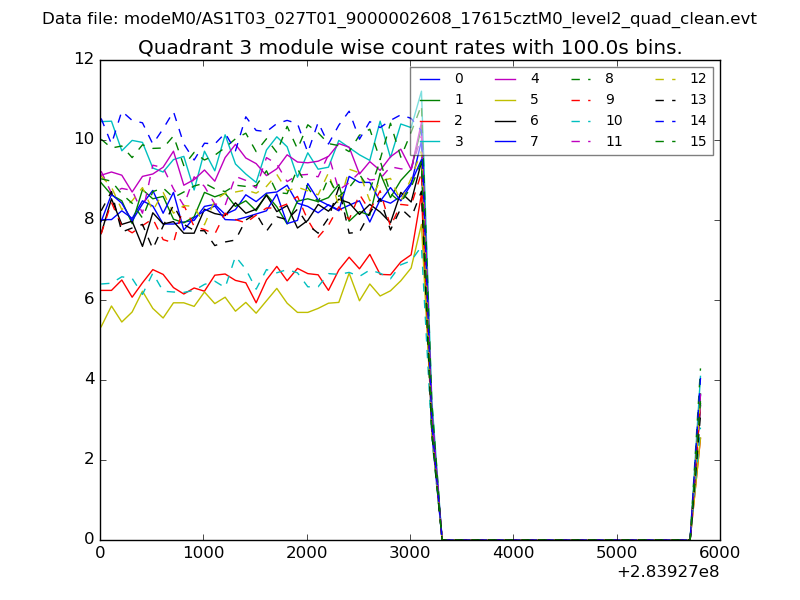 |
 |
| Parameter | Plot |
|---|---|
| CZT HV Monitor | 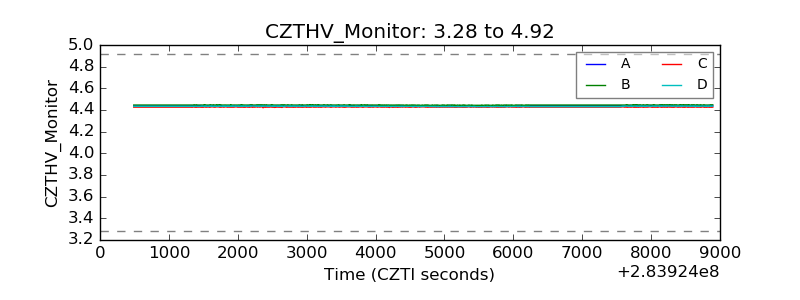 |
| D_VDD | 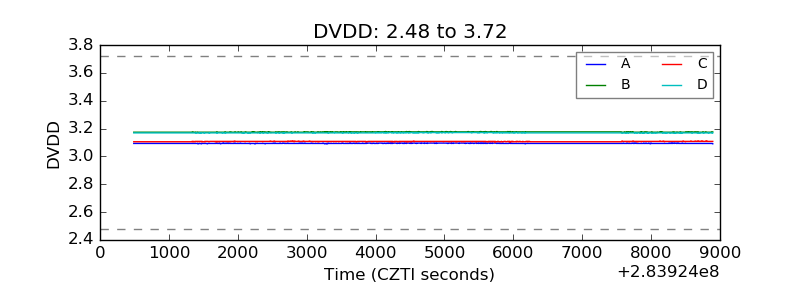 |
| Temperature 1 | 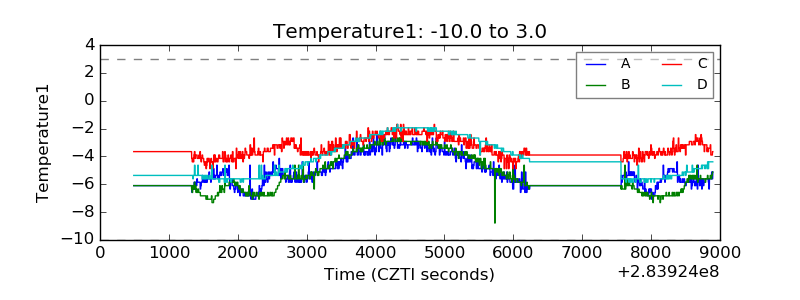 |
| Veto HV Monitor | 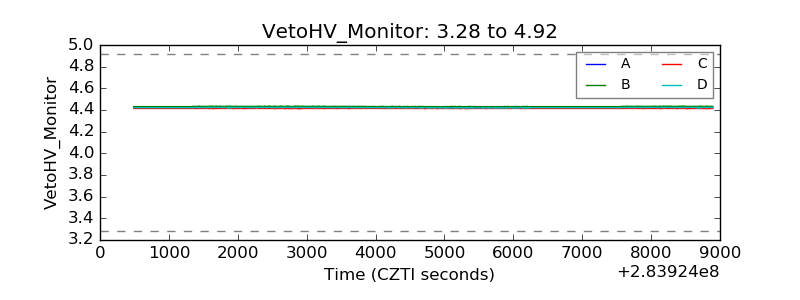 |
| Veto LLD | 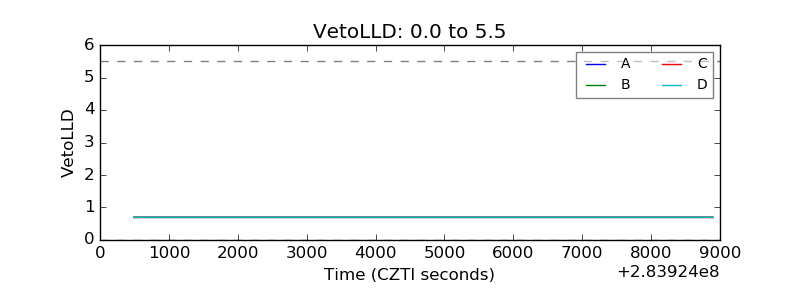 |
| Alpha Counter | 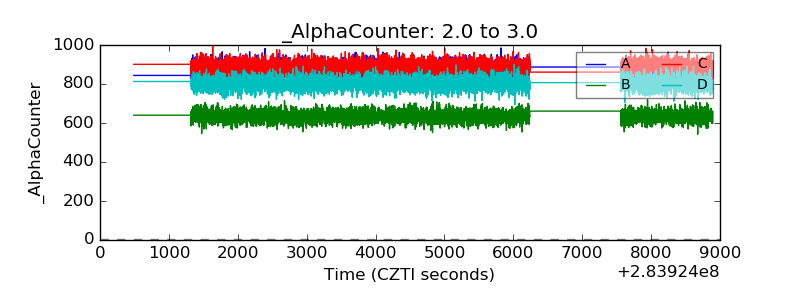 |
| _CPM_Rate | 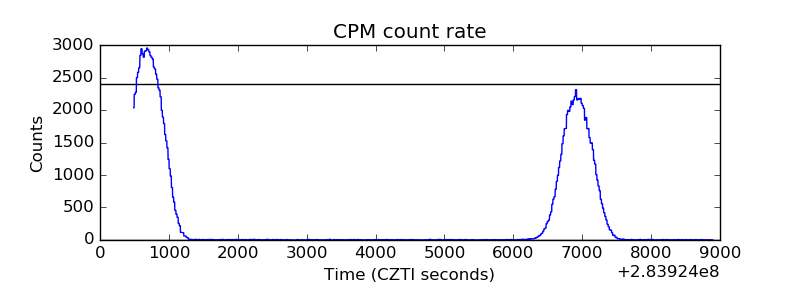 |
| CZT Counter |  |
| +2.5 Volts monitor |  |
| +5 Volts monitor |  |
| _ROLL_ROT | 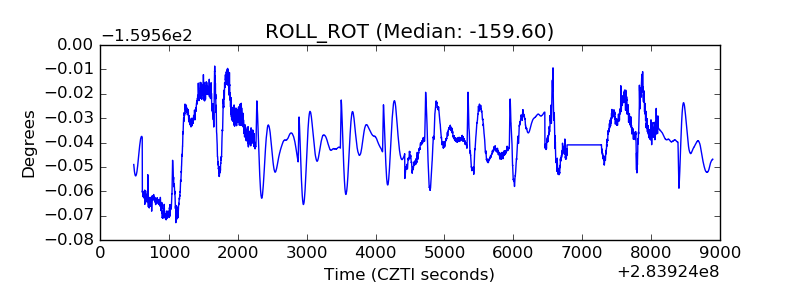 |
| _Roll_DEC | 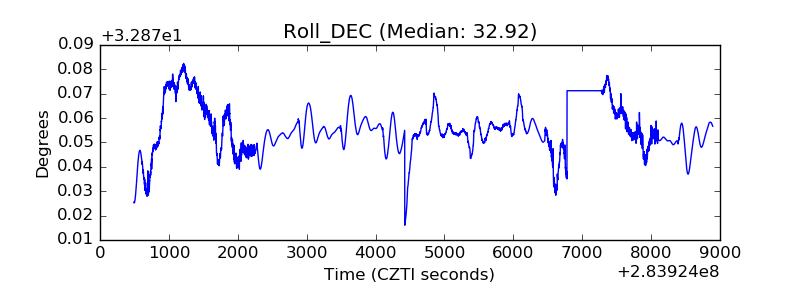 |
| _Roll_RA | 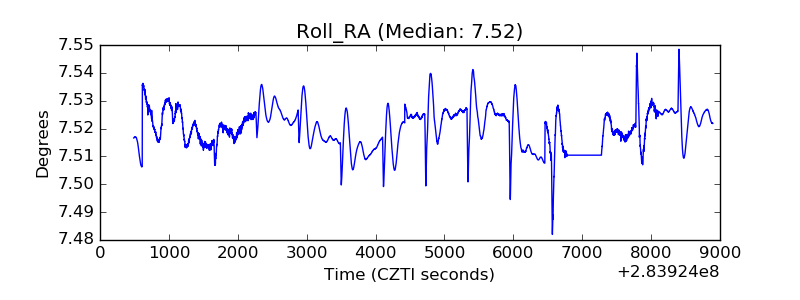 |
| Veto Counter | 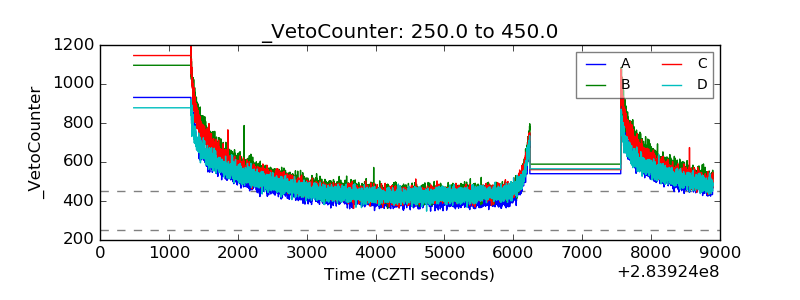 |