| Param | Original file | Final file |
|---|---|---|
| Filename | modeM0/AS1T03_027T01_9000002608_17617cztM0_level2.evt | modeM0/AS1T03_027T01_9000002608_17617cztM0_level2_quad_clean.evt |
| Size (bytes) | 466,511,040 | 96,226,560 |
| Size | 444.9 MB | 91.8 MB |
| Events in quadrant A | 3,292,590 | 624,781 |
| Events in quadrant B | 3,312,618 | 631,876 |
| Events in quadrant C | 3,923,852 | 601,885 |
| Events in quadrant D | 3,154,693 | 599,455 |
| Mode SS | |||
|---|---|---|---|
| Quadrant | BADHDUFLAG | Total packets | Discarded packets |
| A | 0 | 132 | 0 |
| B | 0 | 132 | 0 |
| C | 0 | 132 | 0 |
| D | 0 | 132 | 0 |
| Mode M9 | |||
|---|---|---|---|
| Quadrant | BADHDUFLAG | Total packets | Discarded packets |
| A | 0 | 18 | 0 |
| B | 0 | 19 | 0 |
| C | 0 | 19 | 0 |
| D | 0 | 19 | 0 |
| Mode M0 | |||
|---|---|---|---|
| Quadrant | BADHDUFLAG | Total packets | Discarded packets |
| A | 0 | 13674 | 2 |
| B | 0 | 13778 | 2 |
| C | 0 | 15740 | 2 |
| D | 0 | 13645 | 2 |
| Quadrant | Total seconds | Saturated seconds | Saturation percentage |
|---|---|---|---|
| A | 6544 | 118 | 1.803178% |
| B | 6544 | 144 | 2.200489% |
| C | 6544 | 177 | 2.704768% |
| D | 6544 | 78 | 1.191932% |
Noise dominated data is calculated using 1-second bins in cleaned event files. If a bin has >2000 counts, and if more than 50% of those come from <1% of pixels, then it is considered to be noise-dominated and hence unusable.
| Quadrant | # 1 sec bins | Bins with >0 counts | Bins with >2000 counts | High rate bins dominated by noise | Noise dominated (total time) | Noise dominated (detector-on time) | Marked lightcurve |
|---|---|---|---|---|---|---|---|
| A | 7649 | 6544 | 0 | 0 | 0.00% | 0.00% | 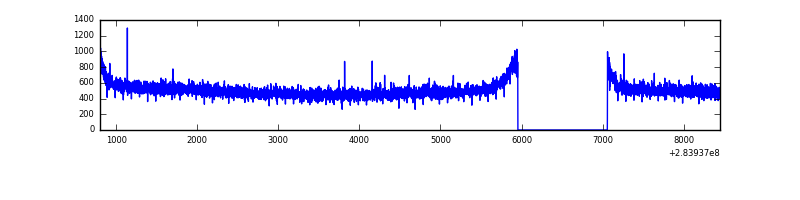 |
| B | 7649 | 6544 | 0 | 0 | 0.00% | 0.00% |  |
| C | 7649 | 6544 | 0 | 0 | 0.00% | 0.00% | 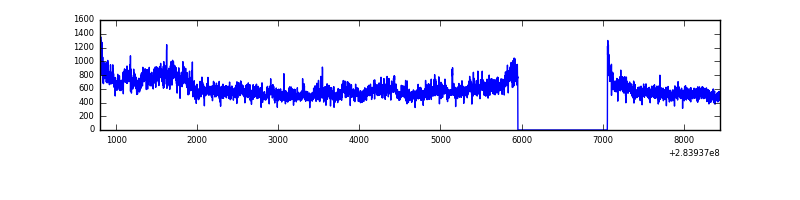 |
| D | 7649 | 6545 | 3 | 3 | 0.04% | 0.05% | 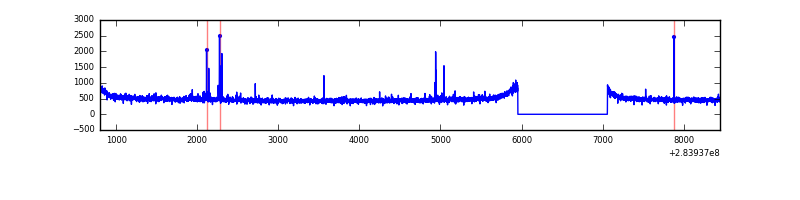 |
Top three noisy pixels from each quadrant. If the there are fewer than three noisy pixels in the level2.evt file, extra rows are filled as -1
| Pixel properties | Quadrant properties | ||||||
|---|---|---|---|---|---|---|---|
| Quadrant | DetID | PixID | Counts | Sigma | Mean | Median | Sigma |
| A | 13 | 210 | 22025 | 123.52 | 851 | 833 | 171.6 |
| A | 0 | 226 | 7509 | 38.91 | 851 | 833 | 171.6 |
| A | 12 | 194 | 6213 | 31.36 | 851 | 833 | 171.6 |
| B | 12 | 111 | 19104 | 112.78 | 843 | 820 | 162.1 |
| B | 11 | 111 | 16743 | 98.21 | 843 | 820 | 162.1 |
| B | 14 | 111 | 14759 | 85.98 | 843 | 820 | 162.1 |
| C | 3 | 233 | 627126 | 3382.06 | 799 | 805 | 185.2 |
| C | 14 | 238 | 125295 | 672.23 | 799 | 805 | 185.2 |
| C | 5 | 218 | 54183 | 288.24 | 799 | 805 | 185.2 |
| D | 13 | 189 | 30089 | 147.18 | 822 | 799 | 199.0 |
| D | 2 | 234 | 22259 | 107.83 | 822 | 799 | 199.0 |
| D | 7 | 96 | 10524 | 48.87 | 822 | 799 | 199.0 |
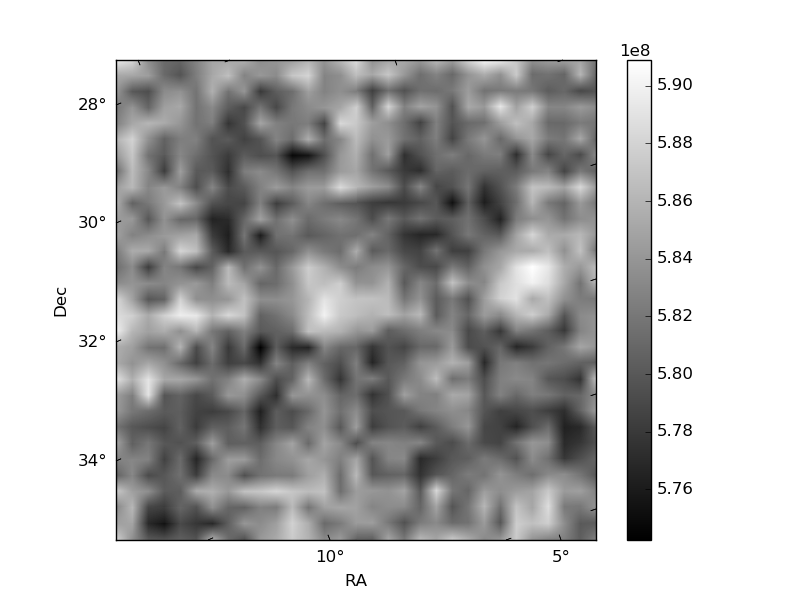
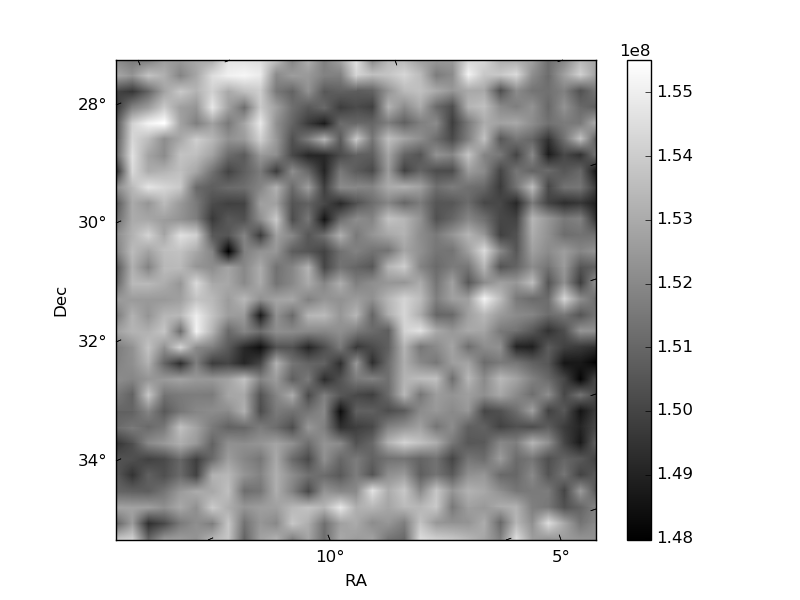
Histogram calculated using DETX and DETY for each event in the final _common_clean file
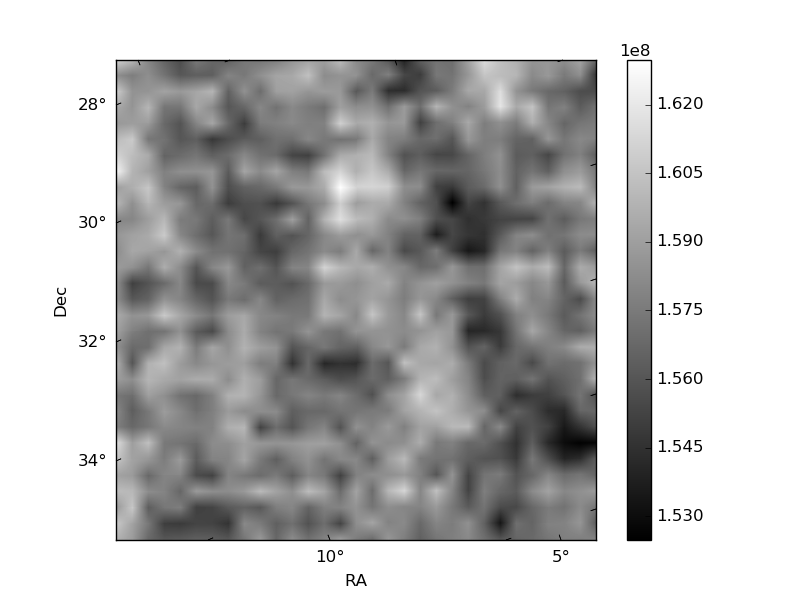
| Quadrant A | 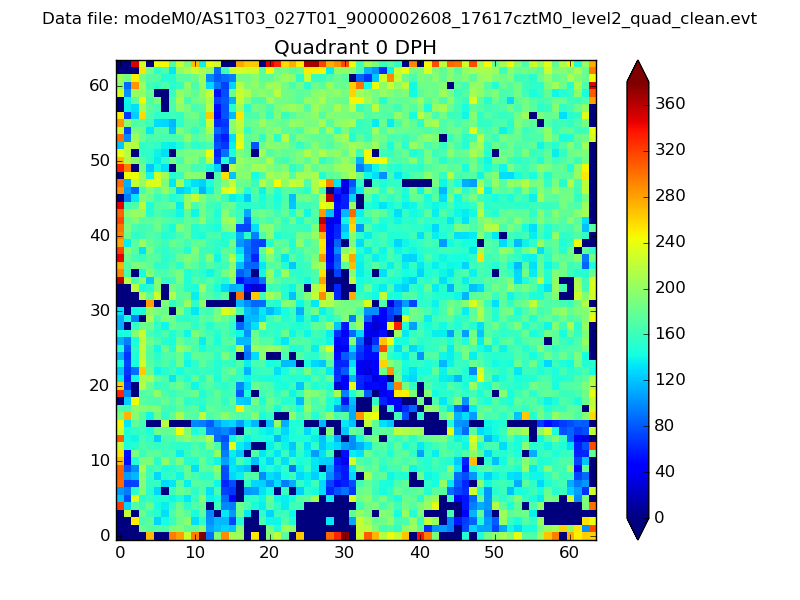 |
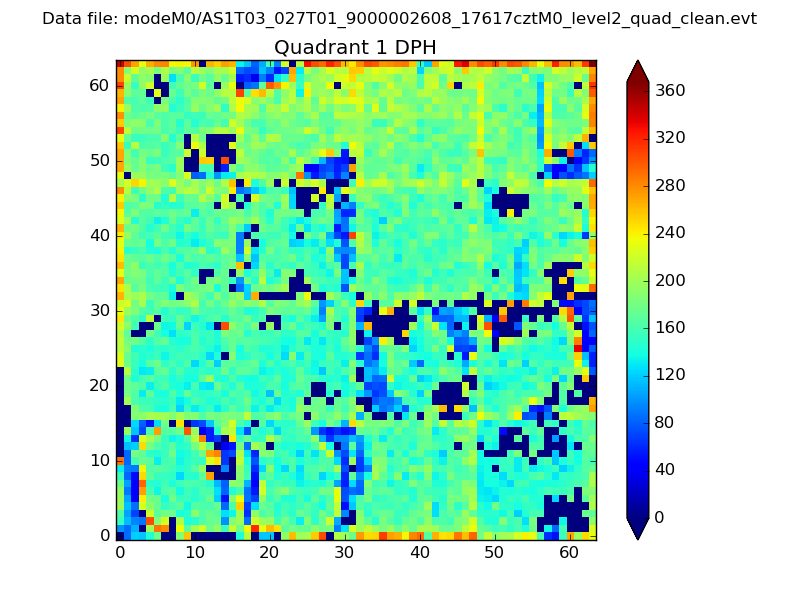 |
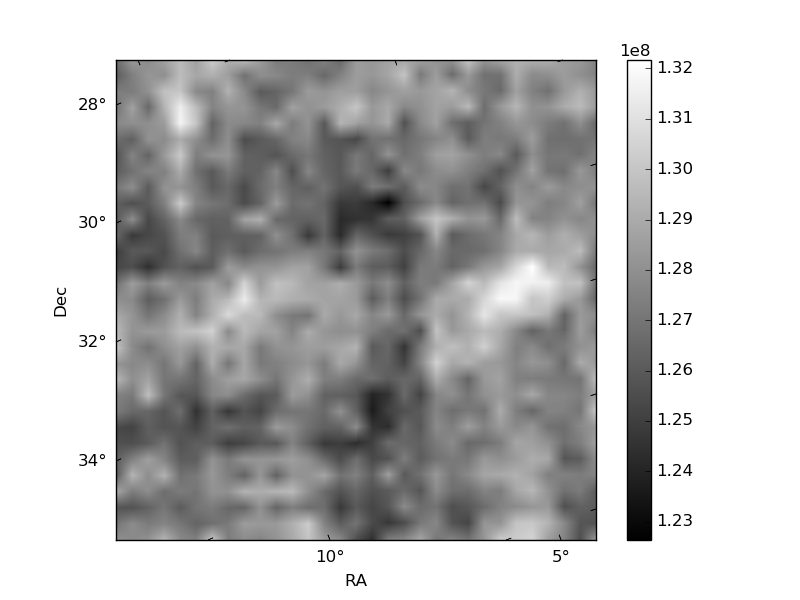
Quadrant B |
|---|---|---|---|
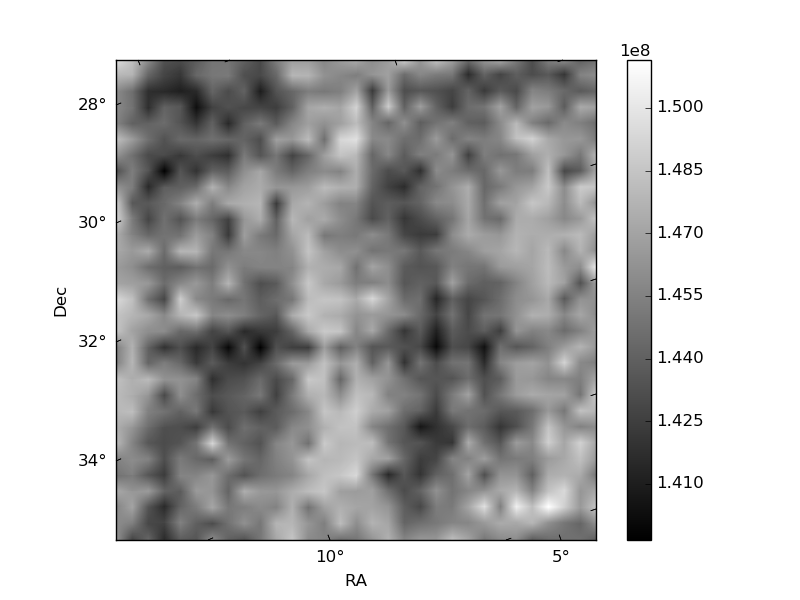
| Quadrant D | 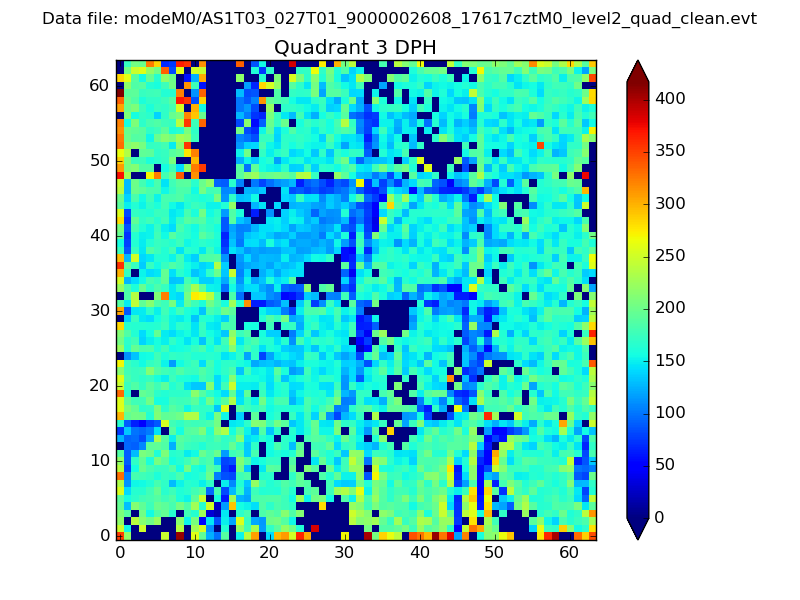 |
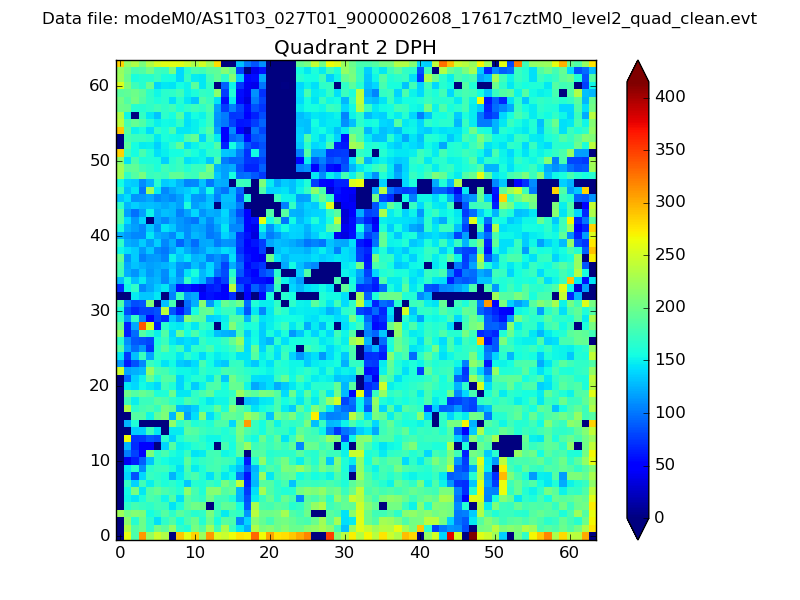 |
Quadrant C |
| Plot type | Count rate plots | Images |
|---|---|---|
| Comparison with Poisson distribution Blue bars denote a histogram of data divided into 1 sec bins. Red curve is a Poisson curve with rate = median count rate of data. |
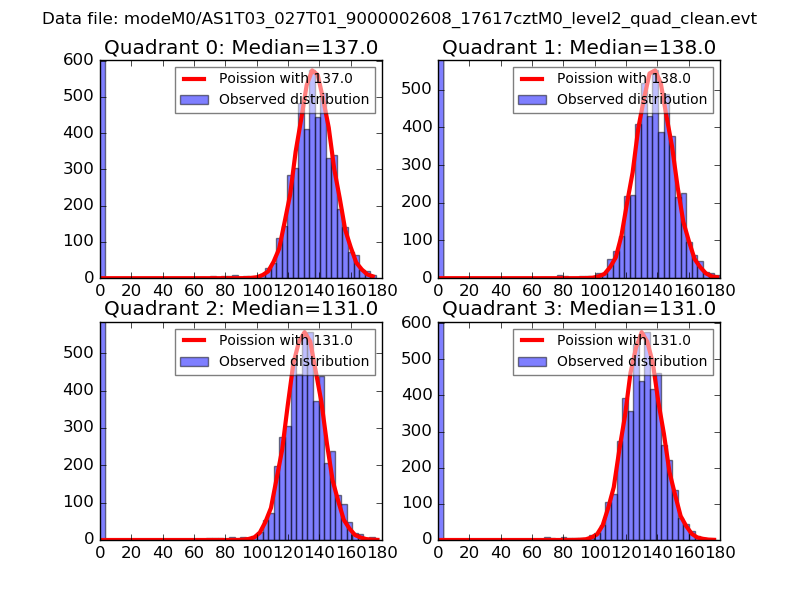 |
 |
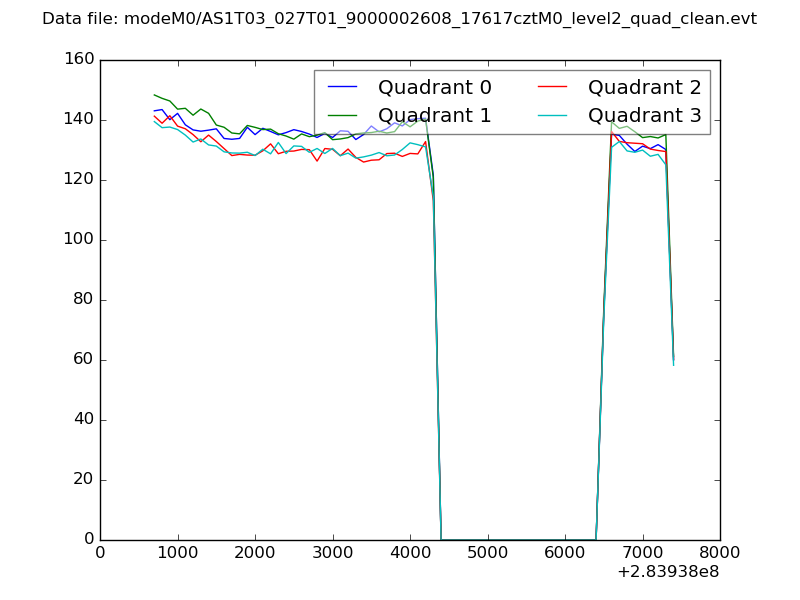
| Quadrant-wise count rates Data is divided into 100 sec bins |
 |
|
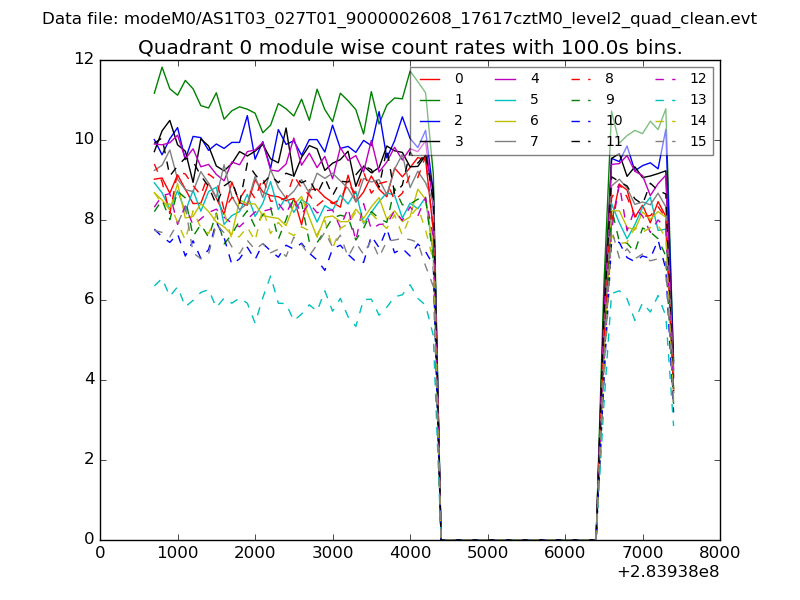
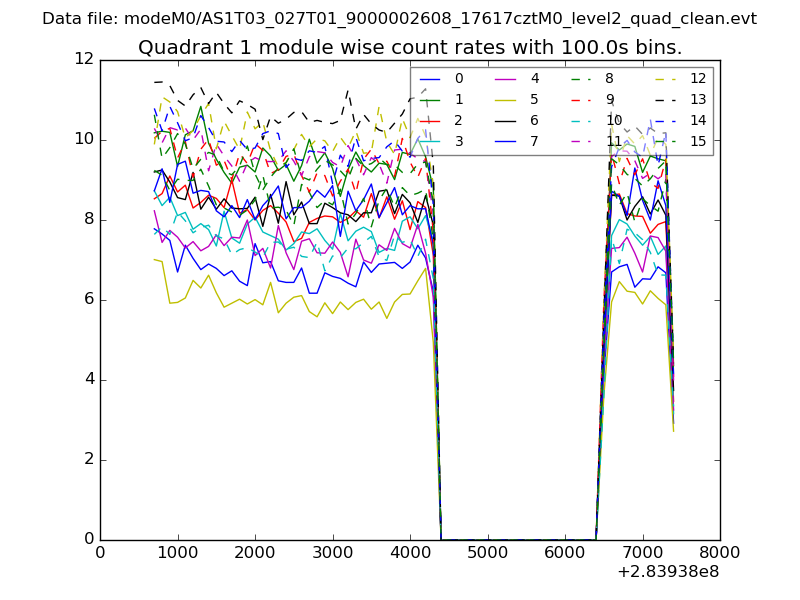
| Module-wise count rates for Quadrant A Data is divided into 100 sec bins |
 |
 |
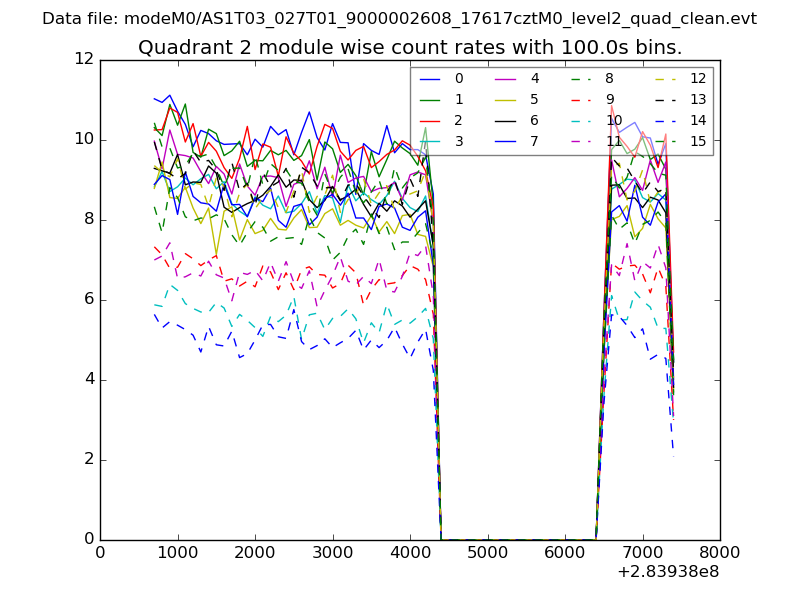
| Module-wise count rates for Quadrant B Data is divided into 100 sec bins |
 |
 |
| Module-wise count rates for Quadrant C Data is divided into 100 sec bins |
 |
 |
| Module-wise count rates for Quadrant D Data is divided into 100 sec bins |
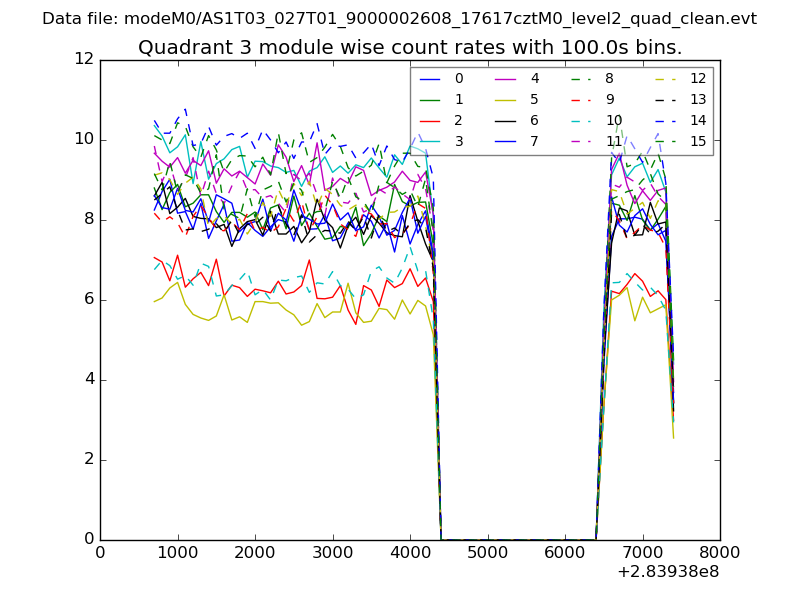 |
 |
| Parameter | Plot |
|---|---|
| CZT HV Monitor | 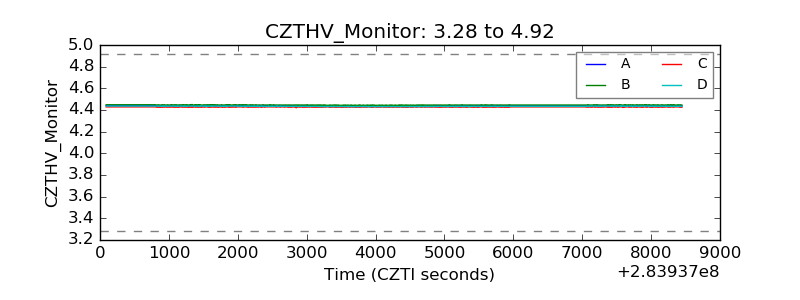 |
| D_VDD | 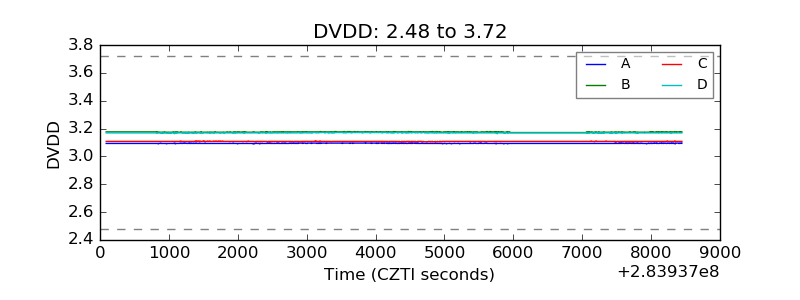 |
| Temperature 1 |  |
| Veto HV Monitor |  |
| Veto LLD | 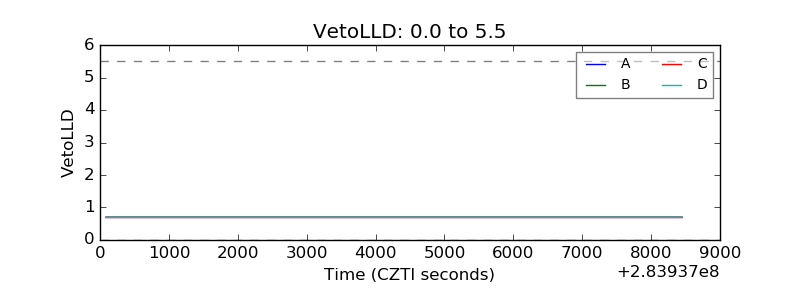 |
| Alpha Counter | 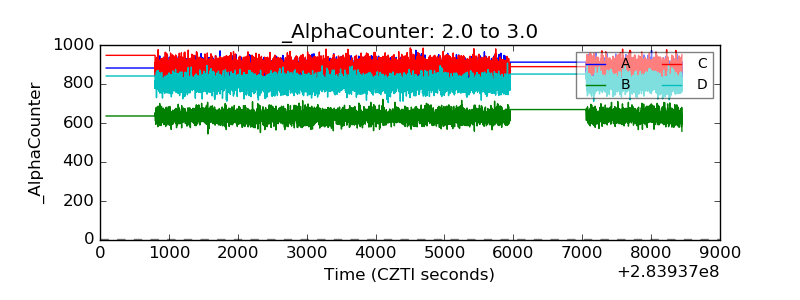 |
| _CPM_Rate | 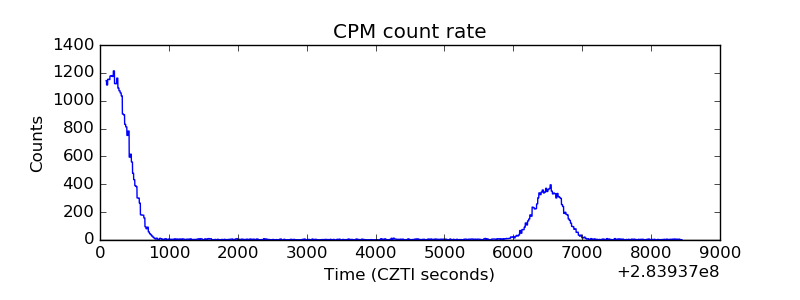 |
| CZT Counter | 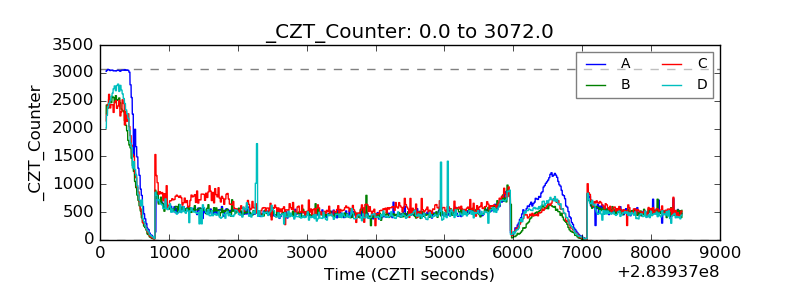 |
| +2.5 Volts monitor |  |
| +5 Volts monitor |  |
| _ROLL_ROT | 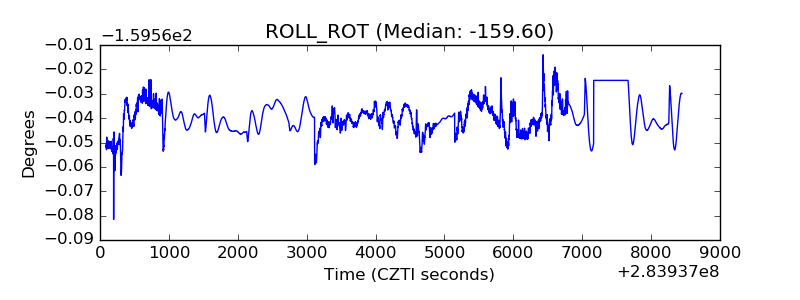 |
| _Roll_DEC | 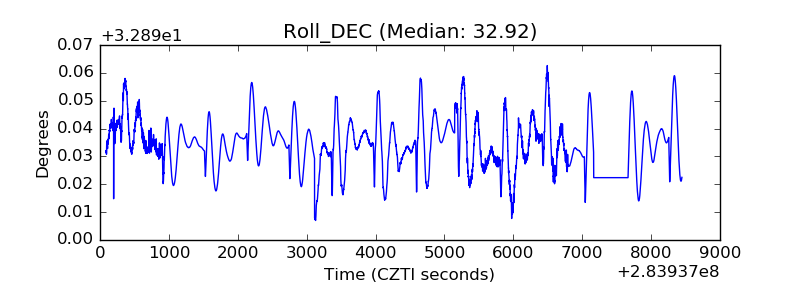 |
| _Roll_RA | 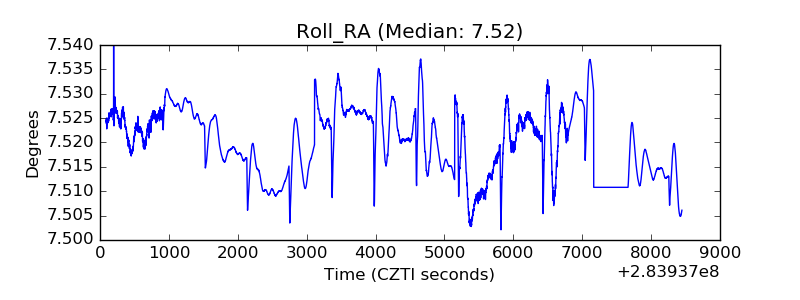 |
| Veto Counter | 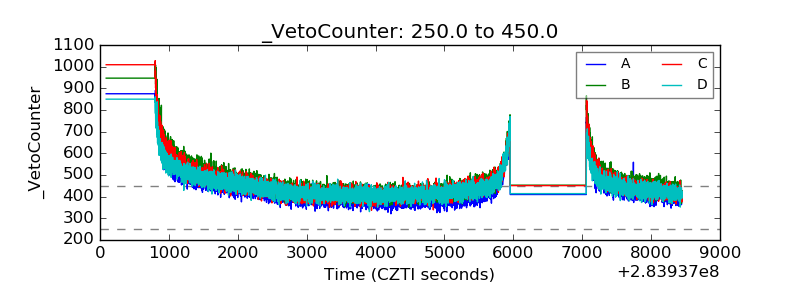 |