| Param | Original file | Final file |
|---|---|---|
| Filename | modeM0/AS1T03_027T01_9000002608_17618cztM0_level2.evt | modeM0/AS1T03_027T01_9000002608_17618cztM0_level2_quad_clean.evt |
| Size (bytes) | 176,898,240 | 51,073,920 |
| Size | 168.7 MB | 48.7 MB |
| Events in quadrant A | 1,193,640 | 344,019 |
| Events in quadrant B | 1,208,191 | 346,934 |
| Events in quadrant C | 1,342,815 | 335,074 |
| Events in quadrant D | 1,429,612 | 329,922 |
| Mode SS | |||
|---|---|---|---|
| Quadrant | BADHDUFLAG | Total packets | Discarded packets |
| A | 0 | 54 | 0 |
| B | 0 | 54 | 0 |
| C | 0 | 54 | 0 |
| D | 0 | 54 | 0 |
| Mode M0 | |||
|---|---|---|---|
| Quadrant | BADHDUFLAG | Total packets | Discarded packets |
| A | 0 | 5322 | 0 |
| B | 0 | 5334 | 0 |
| C | 0 | 5526 | 0 |
| D | 0 | 6148 | 0 |
| Quadrant | Total seconds | Saturated seconds | Saturation percentage |
|---|---|---|---|
| A | 2656 | 2 | 0.075301% |
| B | 2657 | 3 | 0.112909% |
| C | 2657 | 6 | 0.225819% |
| D | 2657 | 32 | 1.204366% |
Noise dominated data is calculated using 1-second bins in cleaned event files. If a bin has >2000 counts, and if more than 50% of those come from <1% of pixels, then it is considered to be noise-dominated and hence unusable.
| Quadrant | # 1 sec bins | Bins with >0 counts | Bins with >2000 counts | High rate bins dominated by noise | Noise dominated (total time) | Noise dominated (detector-on time) | Marked lightcurve |
|---|---|---|---|---|---|---|---|
| A | 2656 | 2656 | 0 | 0 | 0.00% | 0.00% |  |
| B | 2657 | 2657 | 0 | 0 | 0.00% | 0.00% | 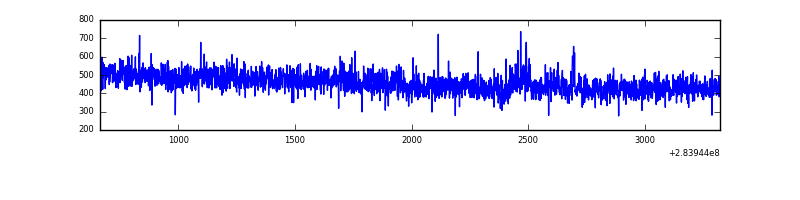 |
| C | 2657 | 2657 | 0 | 0 | 0.00% | 0.00% | 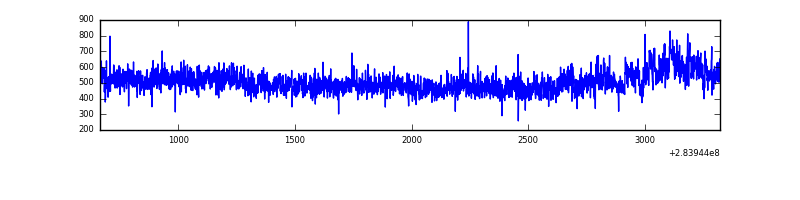 |
| D | 2657 | 2657 | 67 | 67 | 2.52% | 2.52% | 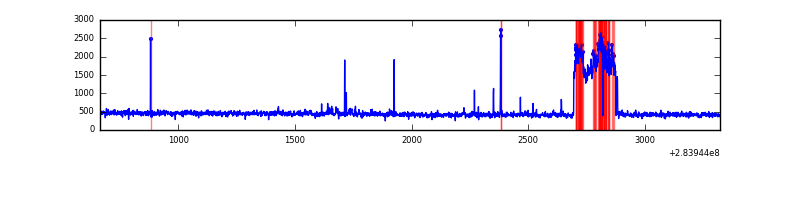 |
Top three noisy pixels from each quadrant. If the there are fewer than three noisy pixels in the level2.evt file, extra rows are filled as -1
| Pixel properties | Quadrant properties | ||||||
|---|---|---|---|---|---|---|---|
| Quadrant | DetID | PixID | Counts | Sigma | Mean | Median | Sigma |
| A | 0 | 226 | 2801 | 38.95 | 310 | 305 | 64.1 |
| A | 12 | 194 | 2275 | 30.74 | 310 | 305 | 64.1 |
| A | 3 | 137 | 2184 | 29.32 | 310 | 305 | 64.1 |
| B | 0 | 229 | 9996 | 159.41 | 305 | 297 | 60.8 |
| B | 12 | 111 | 6651 | 104.43 | 305 | 297 | 60.8 |
| B | 11 | 111 | 5967 | 93.19 | 305 | 297 | 60.8 |
| C | 3 | 233 | 135886 | 1971.0 | 291 | 293 | 68.8 |
| C | 14 | 238 | 46685 | 674.36 | 291 | 293 | 68.8 |
| C | 5 | 218 | 23691 | 340.12 | 291 | 293 | 68.8 |
| D | 1 | 52 | 262648 | 3575.23 | 299 | 291 | 73.4 |
| D | 13 | 189 | 18983 | 254.72 | 299 | 291 | 73.4 |
| D | 2 | 234 | 9733 | 128.67 | 299 | 291 | 73.4 |
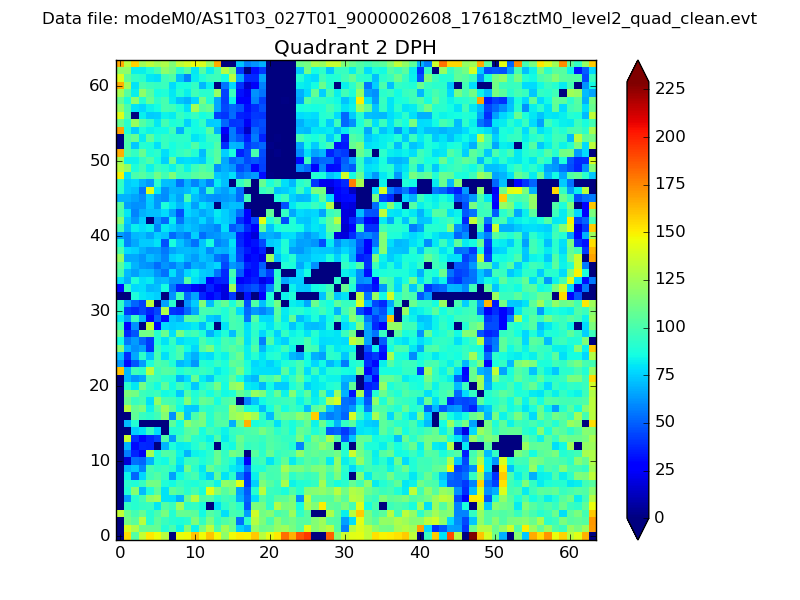
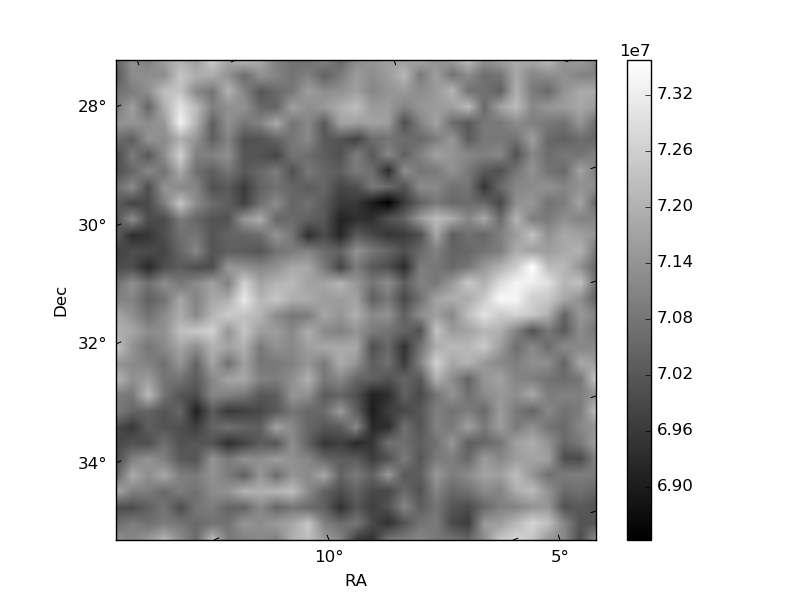
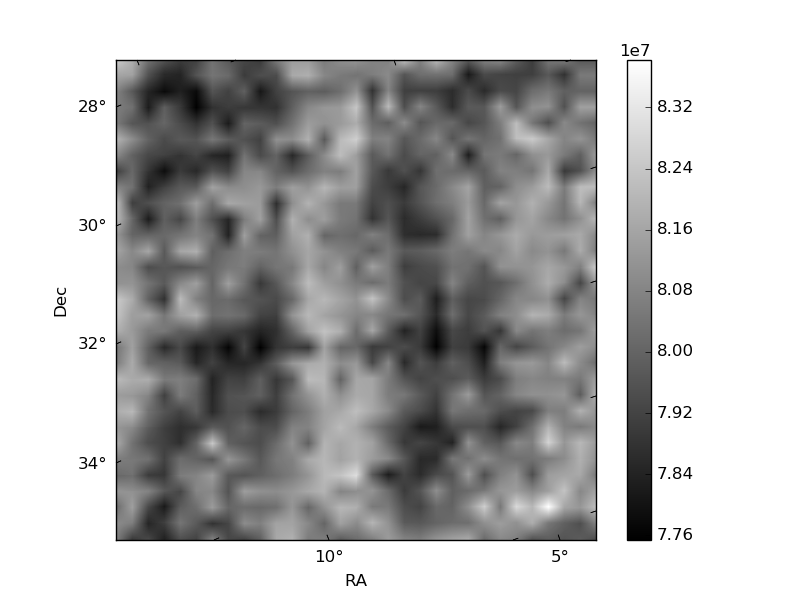
Histogram calculated using DETX and DETY for each event in the final _common_clean file
| Quadrant A | 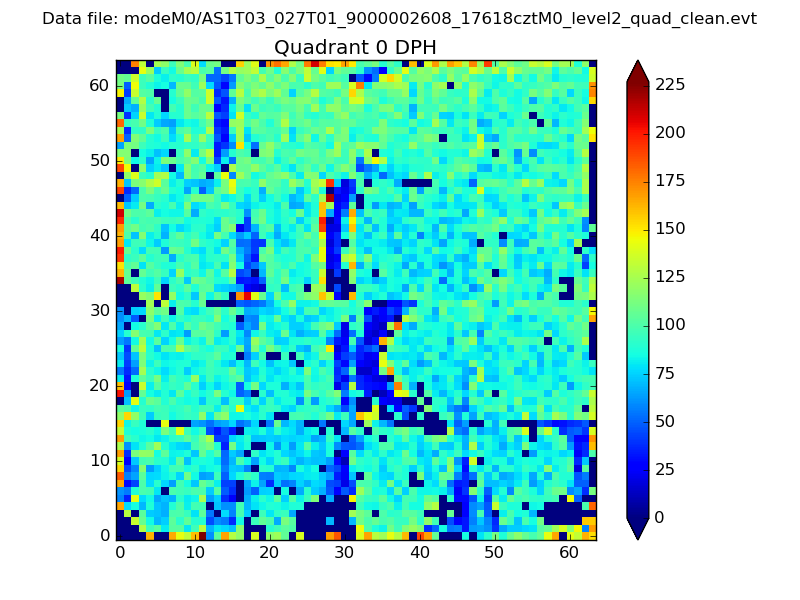 |
 |
Quadrant B |
|---|---|---|---|
| Quadrant D | 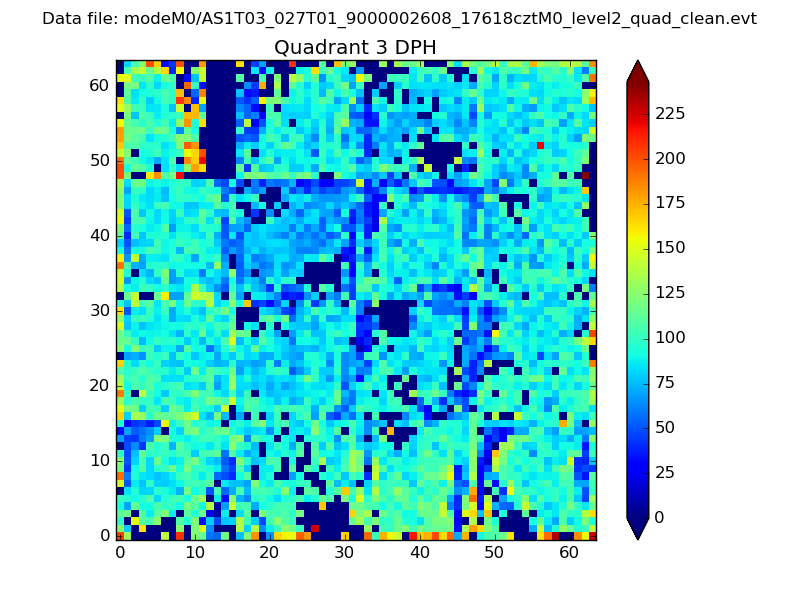 |
 |
Quadrant C |
| Plot type | Count rate plots | Images |
|---|---|---|
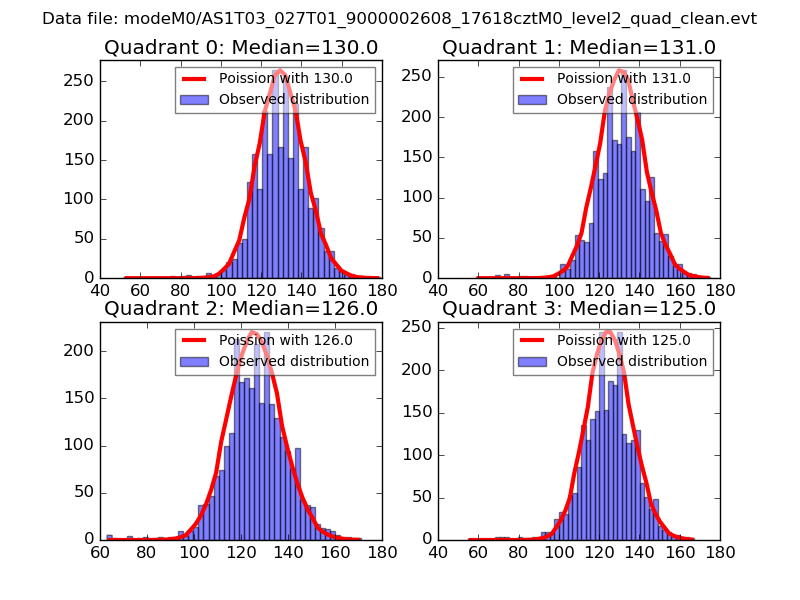
| Comparison with Poisson distribution Blue bars denote a histogram of data divided into 1 sec bins. Red curve is a Poisson curve with rate = median count rate of data. |
 |
 |
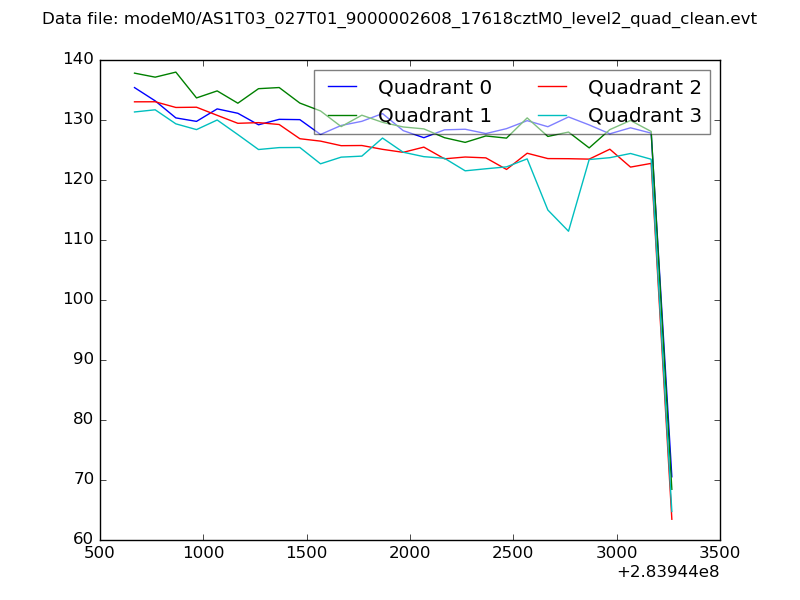
| Quadrant-wise count rates Data is divided into 100 sec bins |
 |
|
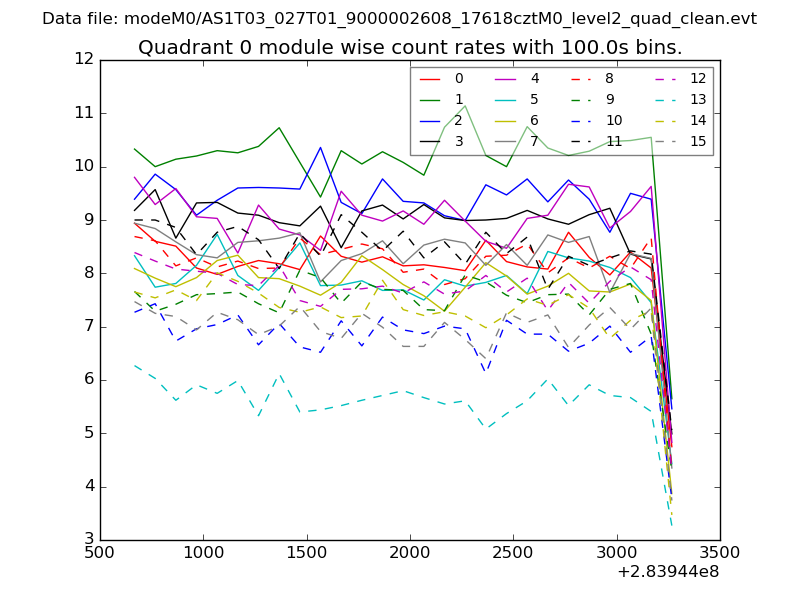
| Module-wise count rates for Quadrant A Data is divided into 100 sec bins |
 |
 |
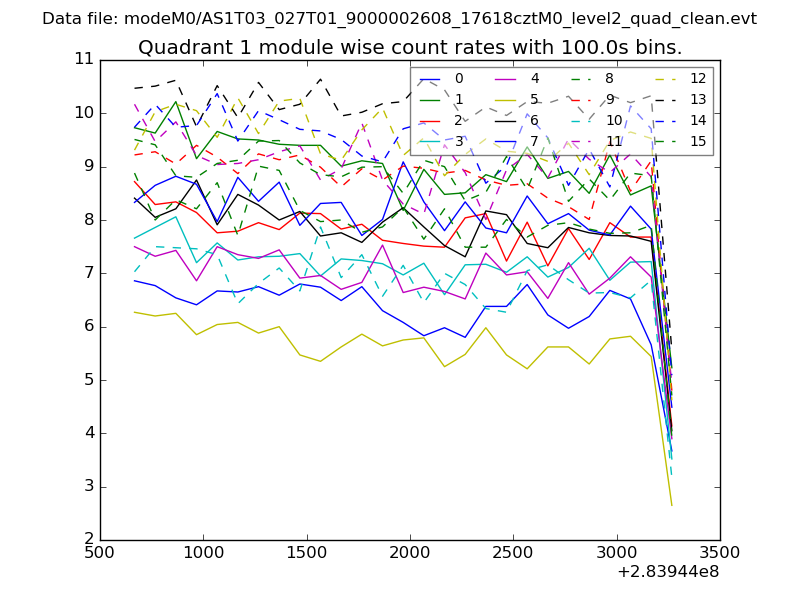
| Module-wise count rates for Quadrant B Data is divided into 100 sec bins |
 |
 |
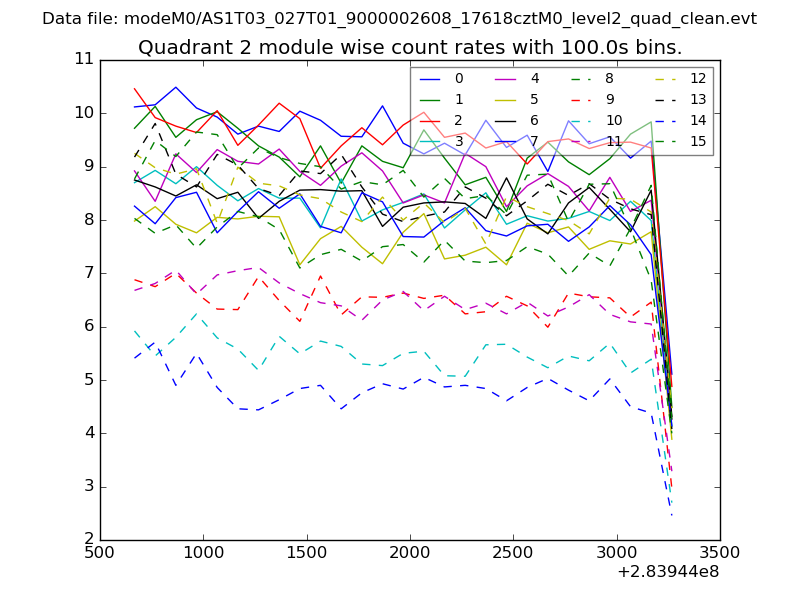
| Module-wise count rates for Quadrant C Data is divided into 100 sec bins |
 |
 |
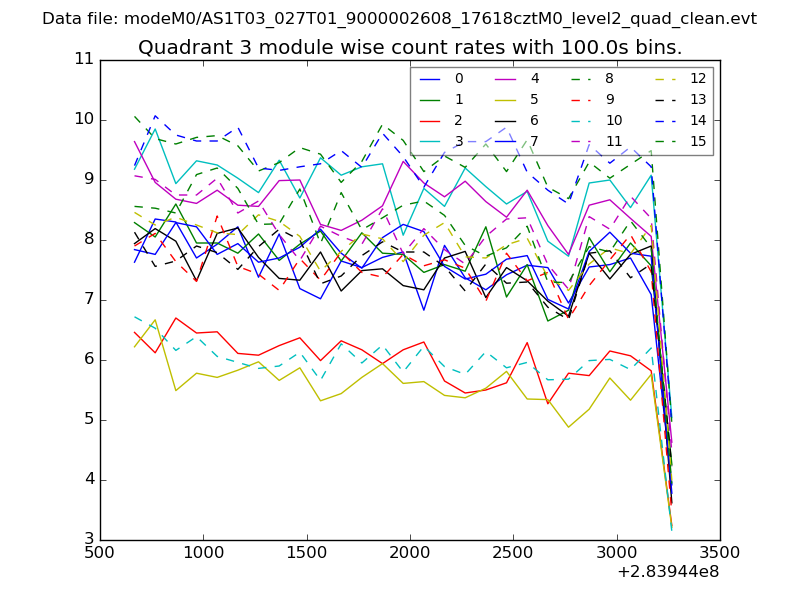
| Module-wise count rates for Quadrant D Data is divided into 100 sec bins |
 |
 |
| Parameter | Plot |
|---|---|
| CZT HV Monitor | 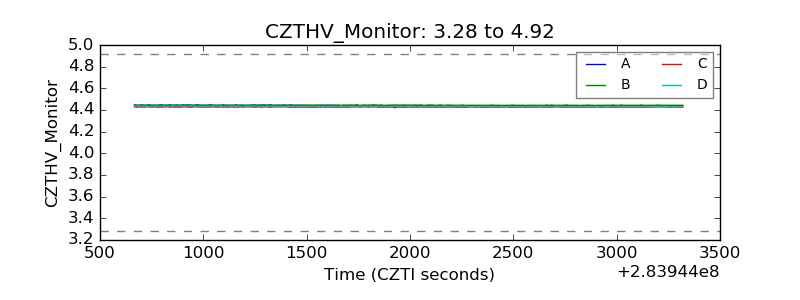 |
| D_VDD | 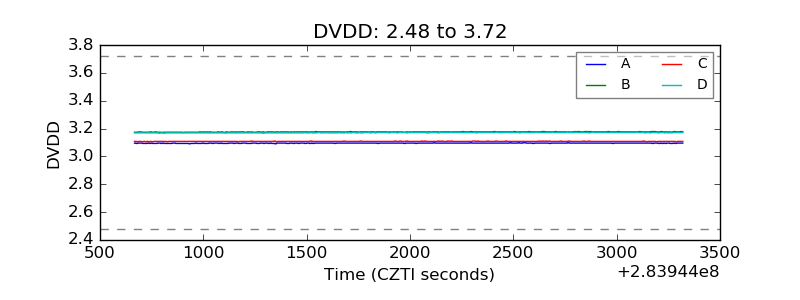 |
| Temperature 1 | 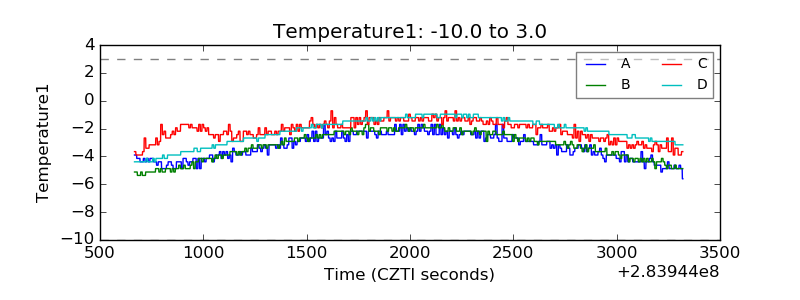 |
| Veto HV Monitor | 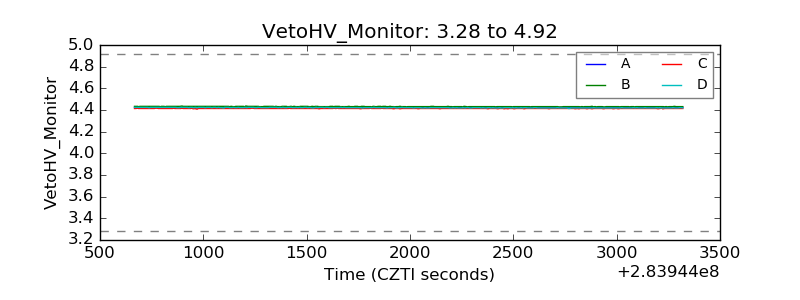 |
| Veto LLD | 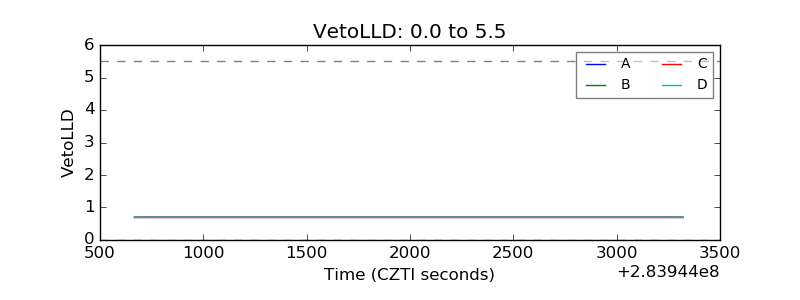 |
| Alpha Counter | 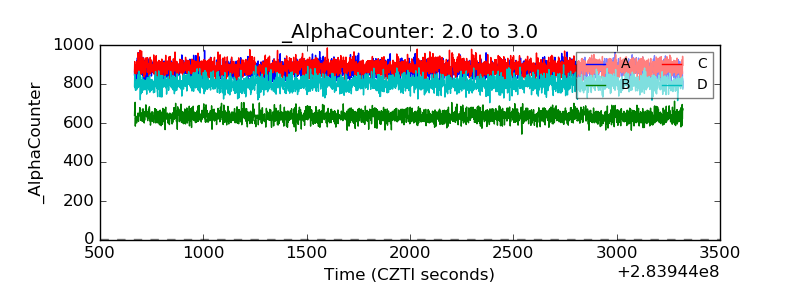 |
| _CPM_Rate | 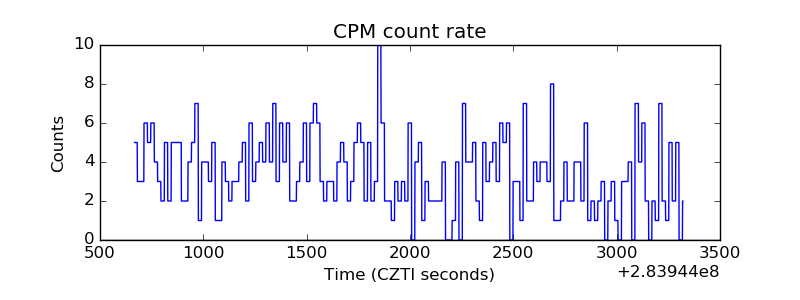 |
| CZT Counter | 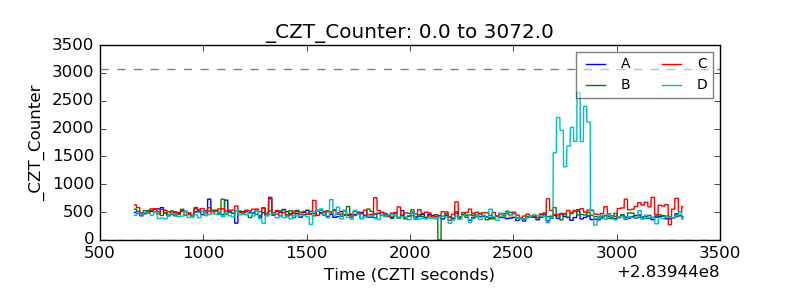 |
| +2.5 Volts monitor |  |
| +5 Volts monitor |  |
| _ROLL_ROT | 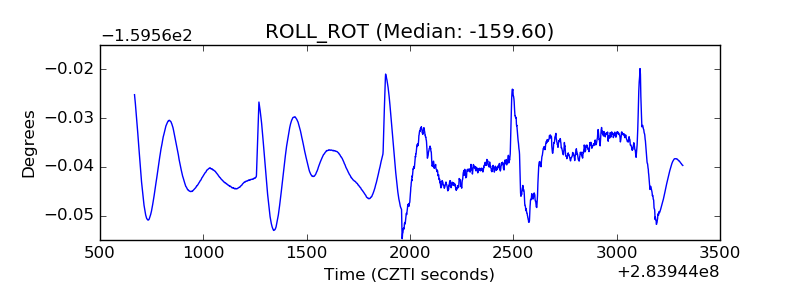 |
| _Roll_DEC | 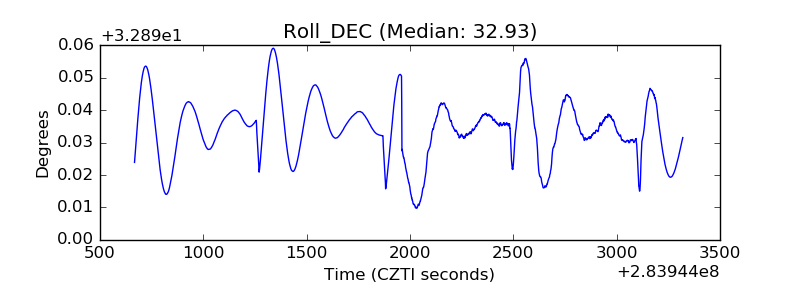 |
| _Roll_RA | 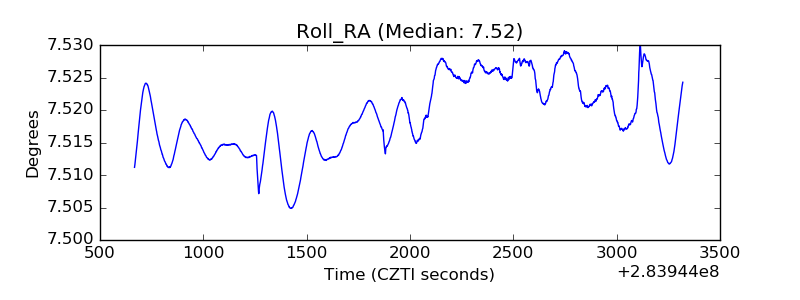 |
| Veto Counter | 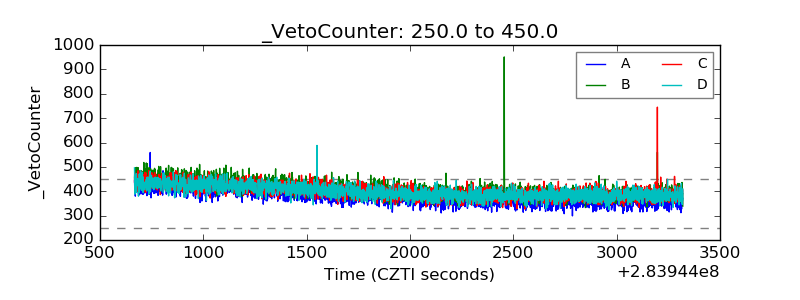 |