| Param | Original file | Final file |
|---|---|---|
| Filename | modeM0/AS1T03_071T01_9000002610_17619cztM0_level2.evt | modeM0/AS1T03_071T01_9000002610_17619cztM0_level2_quad_clean.evt |
| Size (bytes) | 531,771,840 | 79,404,480 |
| Size | 507.1 MB | 75.7 MB |
| Events in quadrant A | 3,664,570 | 483,583 |
| Events in quadrant B | 3,673,473 | 485,040 |
| Events in quadrant C | 4,660,224 | 455,808 |
| Events in quadrant D | 3,602,785 | 463,228 |
| Mode M0 | |||
|---|---|---|---|
| Quadrant | BADHDUFLAG | Total packets | Discarded packets |
| A | 0 | 15679 | 2 |
| B | 0 | 15596 | 2 |
| C | 0 | 18863 | 2 |
| D | 0 | 15850 | 2 |
| Mode SS | |||
|---|---|---|---|
| Quadrant | BADHDUFLAG | Total packets | Discarded packets |
| A | 0 | 154 | 0 |
| B | 0 | 154 | 0 |
| C | 0 | 154 | 0 |
| D | 0 | 154 | 0 |
| Mode M9 | |||
|---|---|---|---|
| Quadrant | BADHDUFLAG | Total packets | Discarded packets |
| A | 0 | 12 | 0 |
| B | 0 | 12 | 0 |
| C | 0 | 12 | 0 |
| D | 0 | 12 | 0 |
| Quadrant | Total seconds | Saturated seconds | Saturation percentage |
|---|---|---|---|
| A | 7421 | 188 | 2.533351% |
| B | 7422 | 176 | 2.371328% |
| C | 7422 | 270 | 3.637833% |
| D | 7422 | 191 | 2.573430% |
Noise dominated data is calculated using 1-second bins in cleaned event files. If a bin has >2000 counts, and if more than 50% of those come from <1% of pixels, then it is considered to be noise-dominated and hence unusable.
| Quadrant | # 1 sec bins | Bins with >0 counts | Bins with >2000 counts | High rate bins dominated by noise | Noise dominated (total time) | Noise dominated (detector-on time) | Marked lightcurve |
|---|---|---|---|---|---|---|---|
| A | 8596 | 7423 | 11 | 11 | 0.13% | 0.15% | 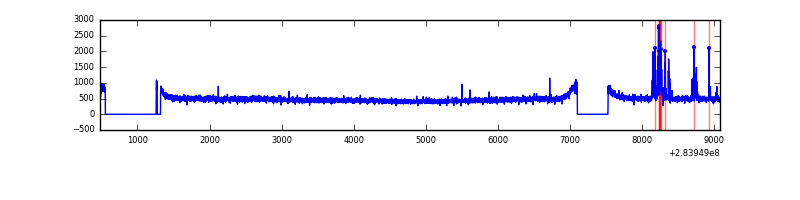 |
| B | 8597 | 7423 | 1 | 1 | 0.01% | 0.01% | 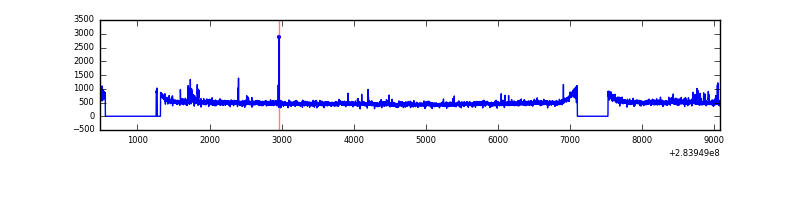 |
| C | 8597 | 7422 | 12 | 12 | 0.14% | 0.16% | 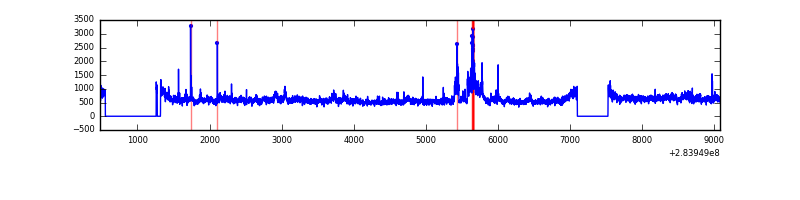 |
| D | 8597 | 7423 | 23 | 23 | 0.27% | 0.31% | 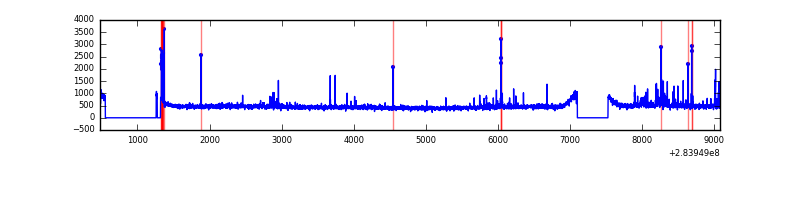 |
Top three noisy pixels from each quadrant. If the there are fewer than three noisy pixels in the level2.evt file, extra rows are filled as -1
| Pixel properties | Quadrant properties | ||||||
|---|---|---|---|---|---|---|---|
| Quadrant | DetID | PixID | Counts | Sigma | Mean | Median | Sigma |
| A | 14 | 237 | 110505 | 583.13 | 924 | 906 | 187.9 |
| A | 0 | 226 | 8195 | 38.78 | 924 | 906 | 187.9 |
| A | 3 | 137 | 6848 | 31.62 | 924 | 906 | 187.9 |
| B | 0 | 230 | 32097 | 174.61 | 918 | 892 | 178.7 |
| B | 12 | 111 | 20963 | 112.31 | 918 | 892 | 178.7 |
| B | 11 | 111 | 18483 | 98.43 | 918 | 892 | 178.7 |
| C | 3 | 233 | 957962 | 4660.69 | 871 | 876 | 205.4 |
| C | 14 | 238 | 134083 | 648.67 | 871 | 876 | 205.4 |
| C | 0 | 207 | 103623 | 500.34 | 871 | 876 | 205.4 |
| D | 13 | 189 | 97769 | 441.19 | 897 | 867 | 219.6 |
| D | 1 | 52 | 60893 | 273.29 | 897 | 867 | 219.6 |
| D | 2 | 234 | 26286 | 115.73 | 897 | 867 | 219.6 |
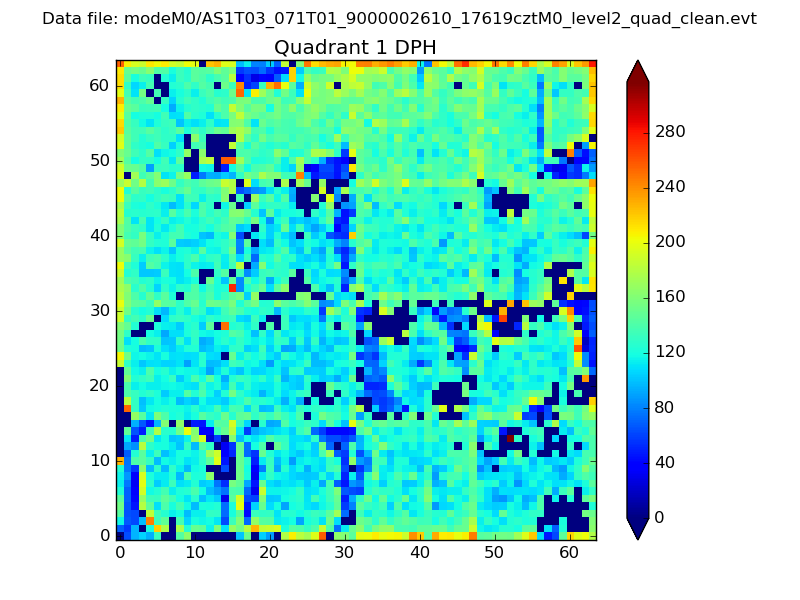
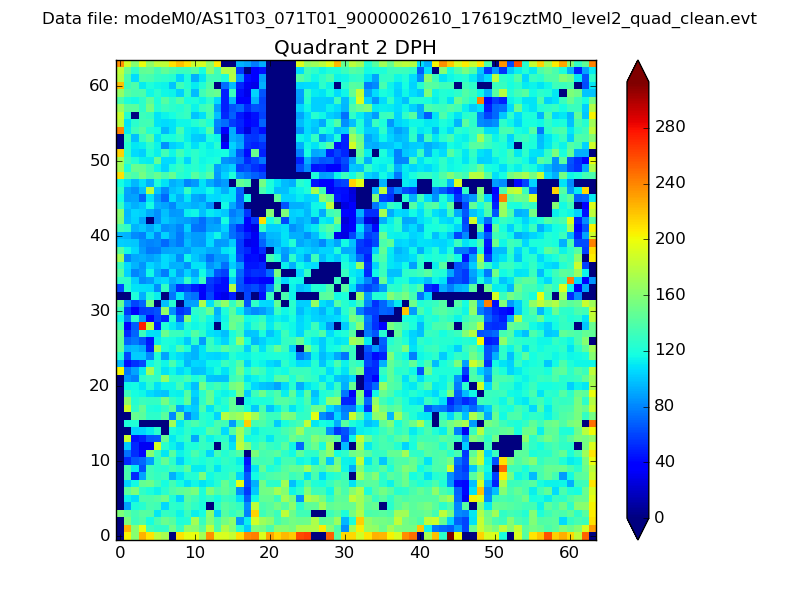
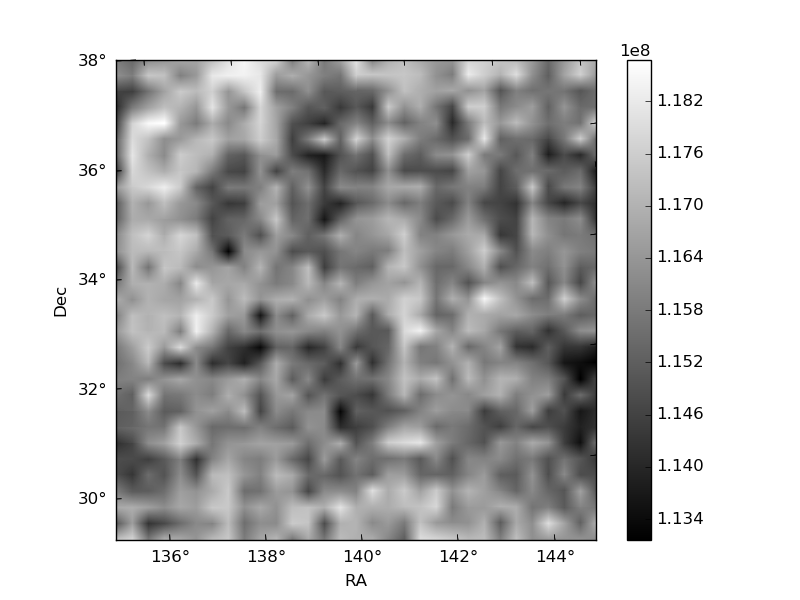
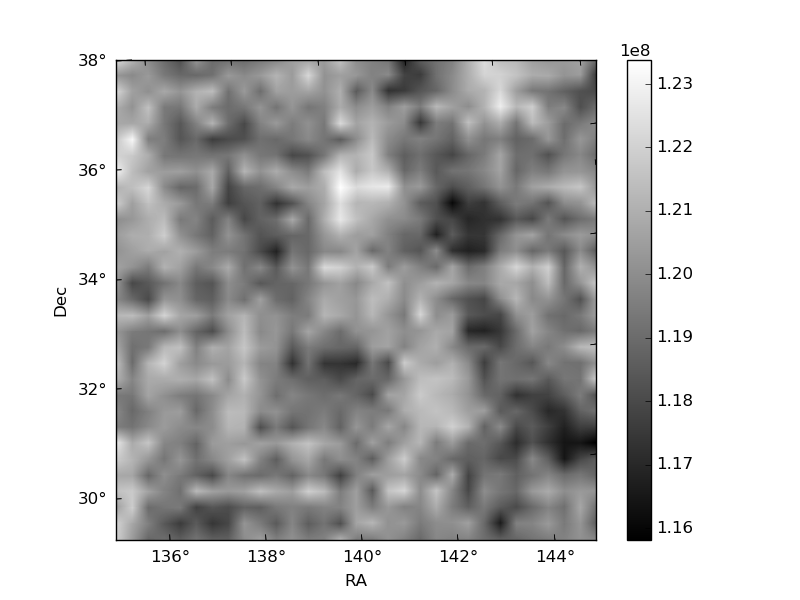
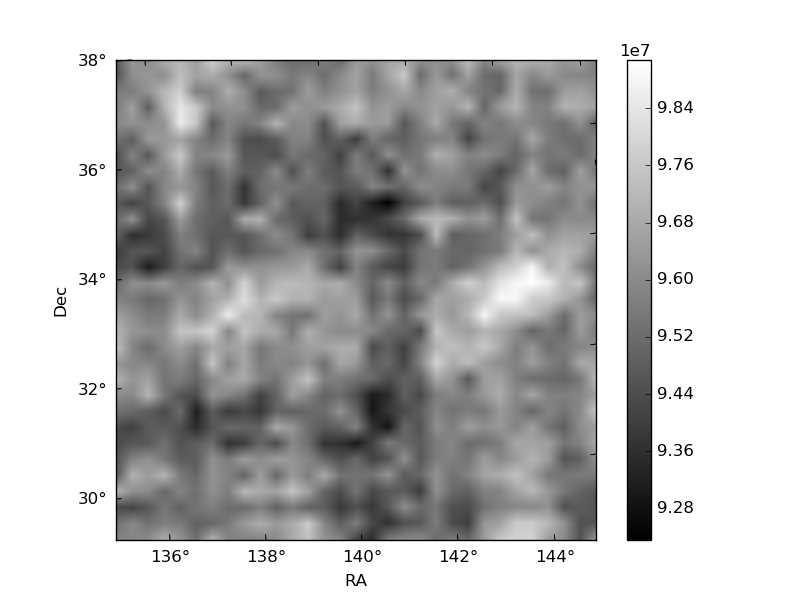
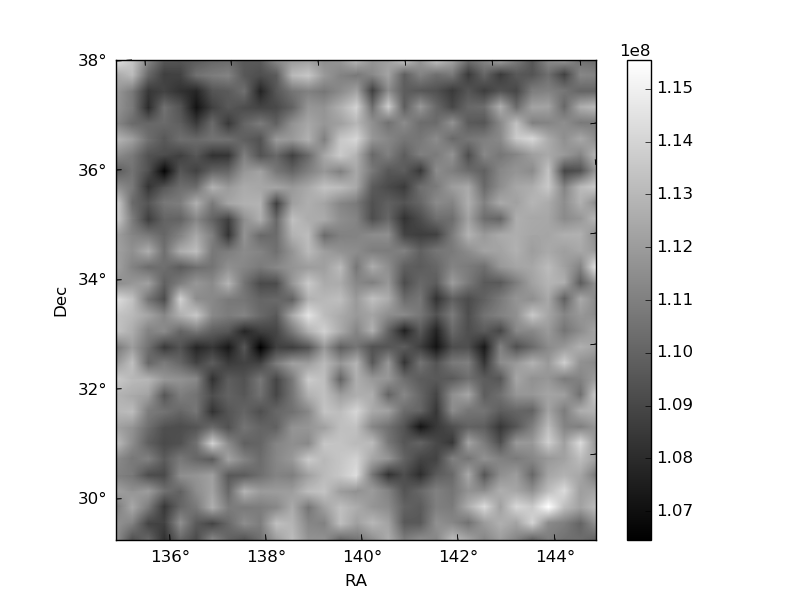
Histogram calculated using DETX and DETY for each event in the final _common_clean file
| Quadrant A |  |
 |
Quadrant B |
|---|---|---|---|
| Quadrant D | 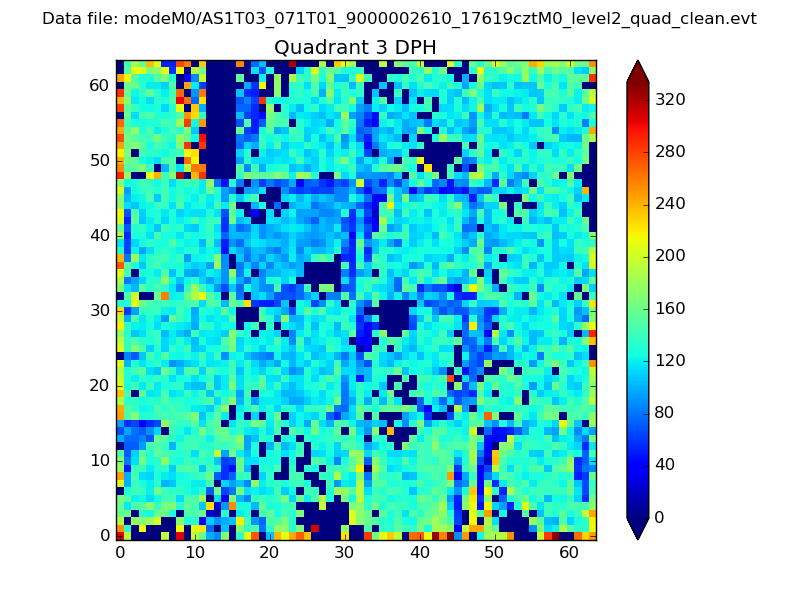 |
 |
Quadrant C |
| Plot type | Count rate plots | Images |
|---|---|---|
| Comparison with Poisson distribution Blue bars denote a histogram of data divided into 1 sec bins. Red curve is a Poisson curve with rate = median count rate of data. |
 |
 |
| Quadrant-wise count rates Data is divided into 100 sec bins |
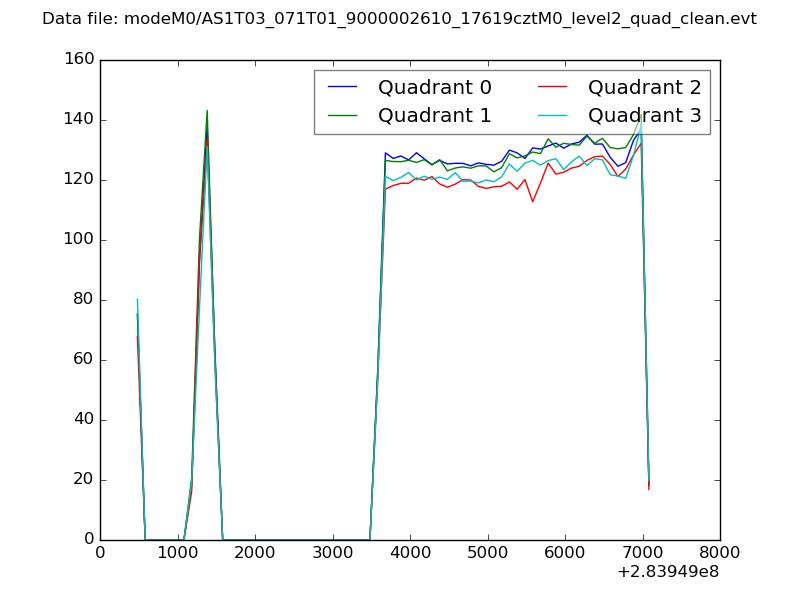 |
|
| Module-wise count rates for Quadrant A Data is divided into 100 sec bins |
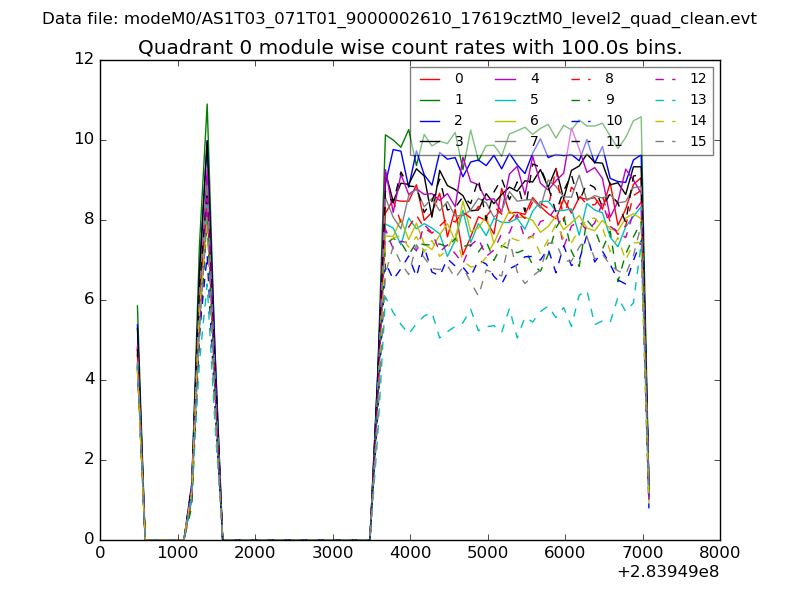 |
 |
| Module-wise count rates for Quadrant B Data is divided into 100 sec bins |
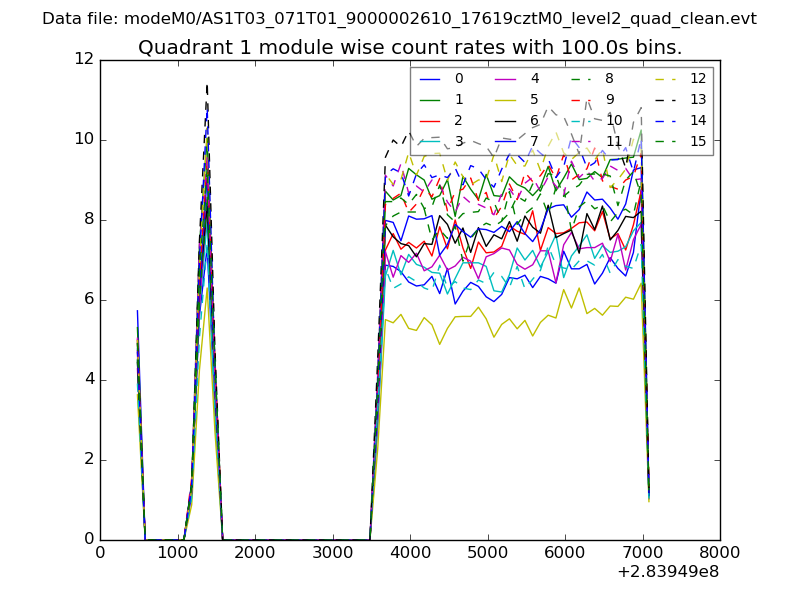 |
 |
| Module-wise count rates for Quadrant C Data is divided into 100 sec bins |
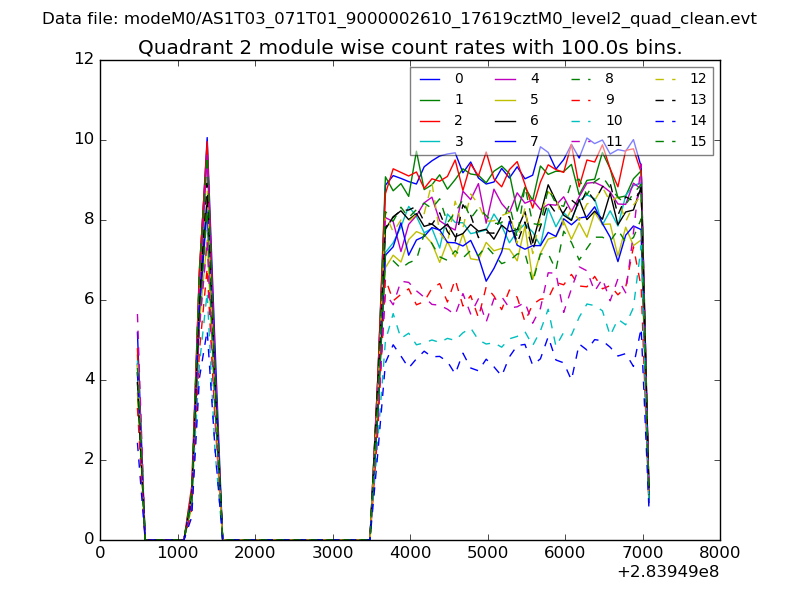 |
 |
| Module-wise count rates for Quadrant D Data is divided into 100 sec bins |
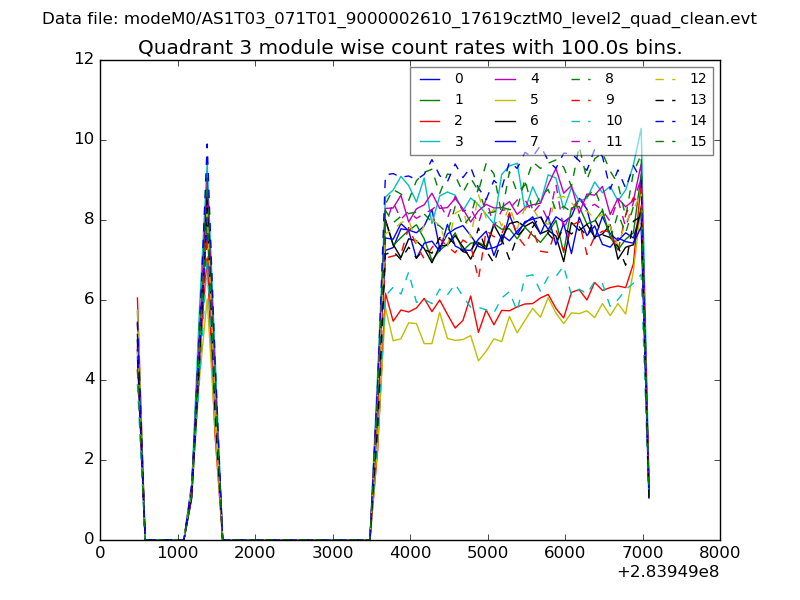 |
 |
| Parameter | Plot |
|---|---|
| CZT HV Monitor | 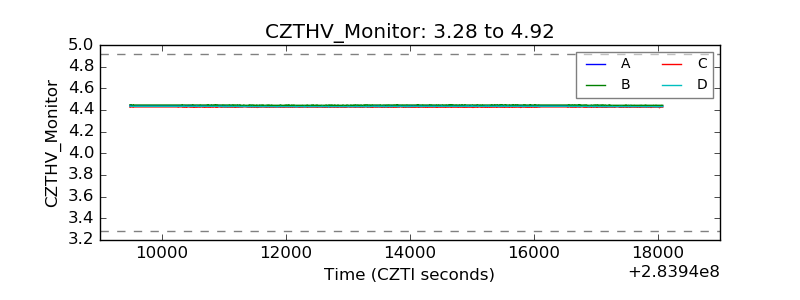 |
| D_VDD | 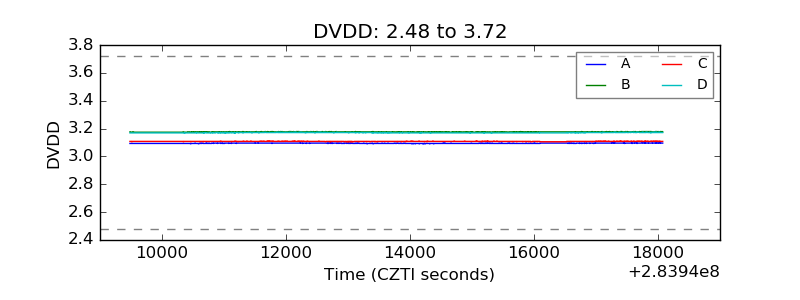 |
| Temperature 1 | 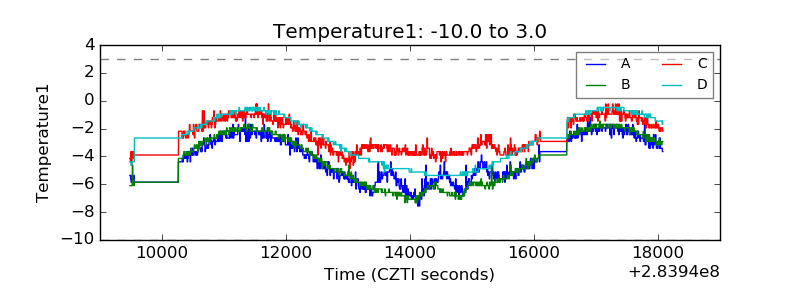 |
| Veto HV Monitor |  |
| Veto LLD | 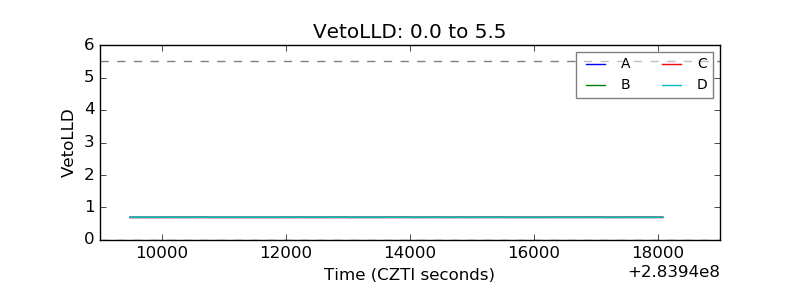 |
| Alpha Counter | 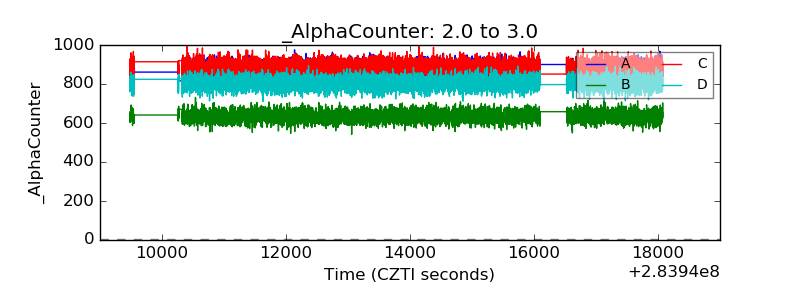 |
| _CPM_Rate | 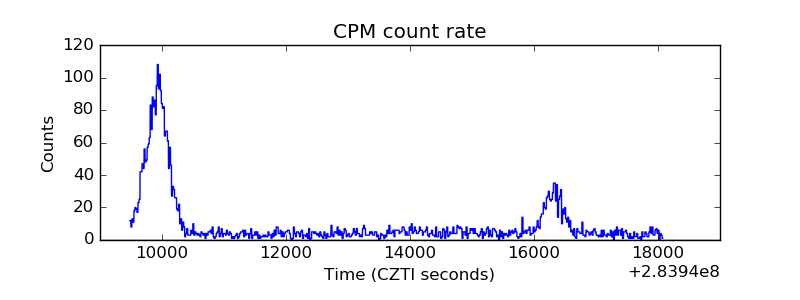 |
| CZT Counter | 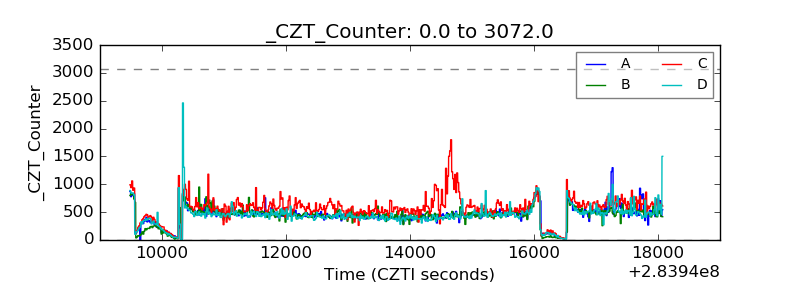 |
| +2.5 Volts monitor | 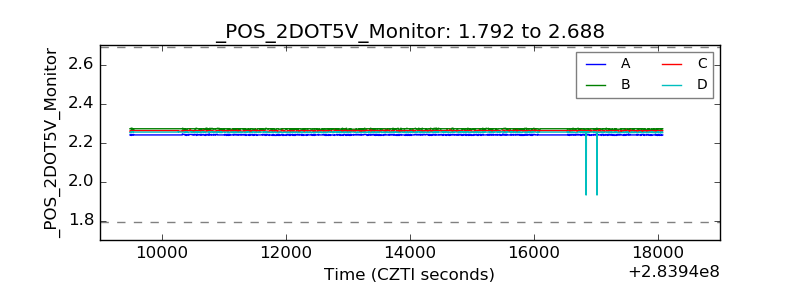 |
| +5 Volts monitor |  |
| _ROLL_ROT | 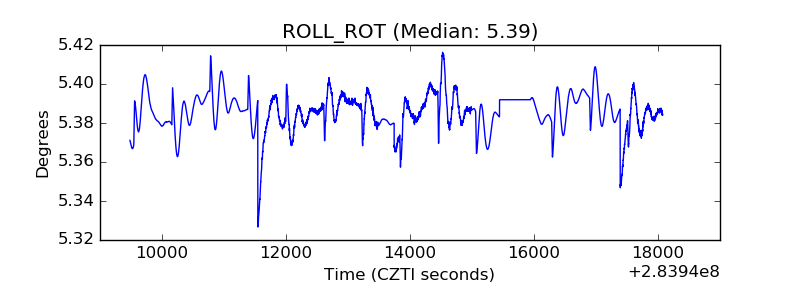 |
| _Roll_DEC | 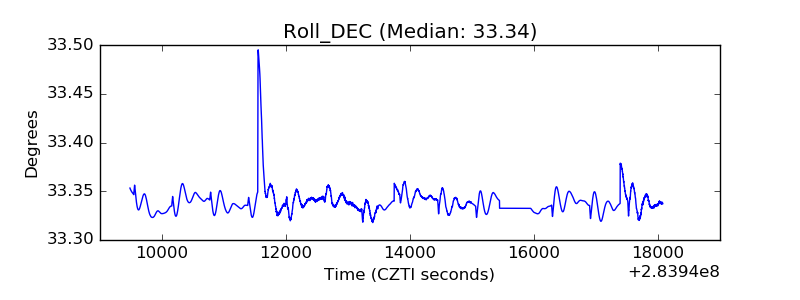 |
| _Roll_RA | 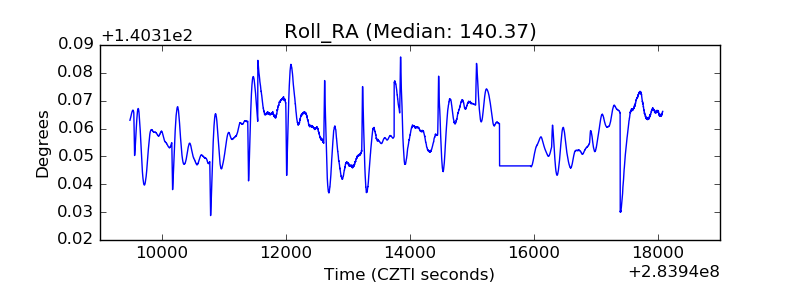 |
| Veto Counter | 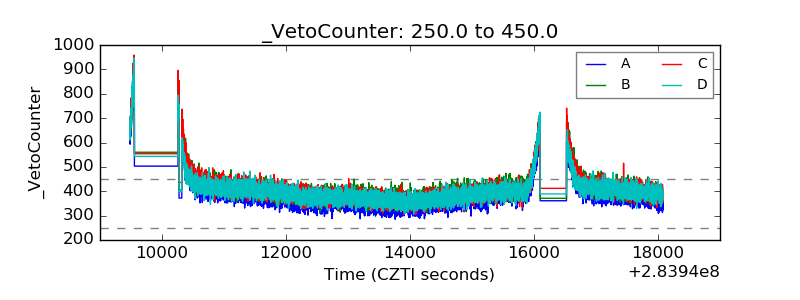 |