| Param | Original file | Final file |
|---|---|---|
| Filename | modeM0/AS1T03_071T01_9000002610_17621cztM0_level2.evt | modeM0/AS1T03_071T01_9000002610_17621cztM0_level2_quad_clean.evt |
| Size (bytes) | 551,862,720 | 85,875,840 |
| Size | 526.3 MB | 81.9 MB |
| Events in quadrant A | 3,746,460 | 530,049 |
| Events in quadrant B | 3,828,644 | 527,851 |
| Events in quadrant C | 4,469,779 | 501,965 |
| Events in quadrant D | 4,147,433 | 506,643 |
| Mode M0 | |||
|---|---|---|---|
| Quadrant | BADHDUFLAG | Total packets | Discarded packets |
| A | 0 | 16120 | 2 |
| B | 0 | 16334 | 2 |
| C | 0 | 18060 | 2 |
| D | 0 | 17709 | 3 |
| Mode SS | |||
|---|---|---|---|
| Quadrant | BADHDUFLAG | Total packets | Discarded packets |
| A | 0 | 156 | 0 |
| B | 0 | 156 | 0 |
| C | 0 | 156 | 0 |
| D | 0 | 156 | 0 |
| Mode M9 | |||
|---|---|---|---|
| Quadrant | BADHDUFLAG | Total packets | Discarded packets |
| A | 0 | 9 | 0 |
| B | 0 | 9 | 0 |
| C | 0 | 9 | 0 |
| D | 0 | 9 | 0 |
| Quadrant | Total seconds | Saturated seconds | Saturation percentage |
|---|---|---|---|
| A | 7681 | 82 | 1.067569% |
| B | 7682 | 146 | 1.900547% |
| C | 7682 | 190 | 2.473314% |
| D | 7681 | 168 | 2.187215% |
Noise dominated data is calculated using 1-second bins in cleaned event files. If a bin has >2000 counts, and if more than 50% of those come from <1% of pixels, then it is considered to be noise-dominated and hence unusable.
| Quadrant | # 1 sec bins | Bins with >0 counts | Bins with >2000 counts | High rate bins dominated by noise | Noise dominated (total time) | Noise dominated (detector-on time) | Marked lightcurve |
|---|---|---|---|---|---|---|---|
| A | 8456 | 7683 | 3 | 3 | 0.04% | 0.04% | 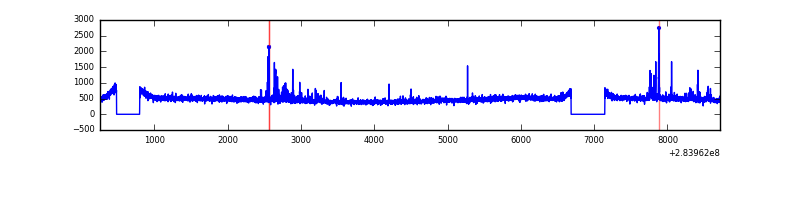 |
| B | 8457 | 7684 | 15 | 15 | 0.18% | 0.20% | 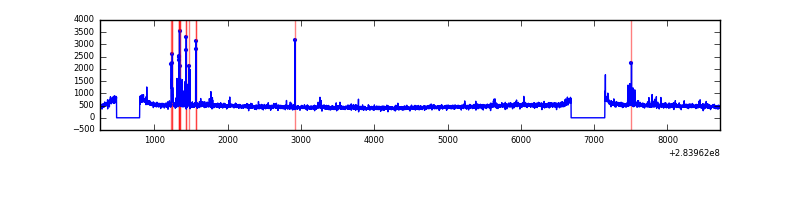 |
| C | 8457 | 7684 | 7 | 7 | 0.08% | 0.09% | 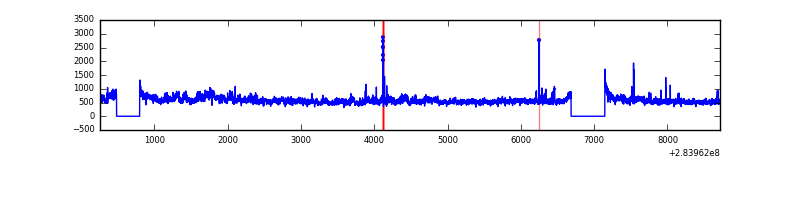 |
| D | 8456 | 7683 | 50 | 50 | 0.59% | 0.65% | 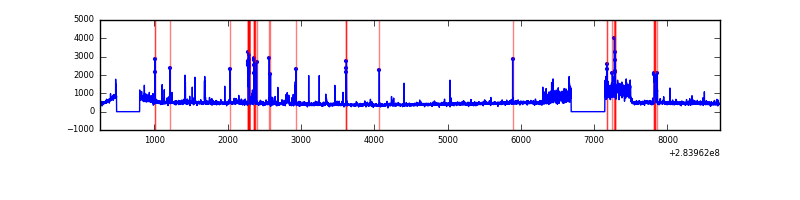 |
Top three noisy pixels from each quadrant. If the there are fewer than three noisy pixels in the level2.evt file, extra rows are filled as -1
| Pixel properties | Quadrant properties | ||||||
|---|---|---|---|---|---|---|---|
| Quadrant | DetID | PixID | Counts | Sigma | Mean | Median | Sigma |
| A | 14 | 237 | 128658 | 661.23 | 941 | 919 | 193.2 |
| A | 0 | 226 | 8221 | 37.8 | 941 | 919 | 193.2 |
| A | 3 | 137 | 7124 | 32.12 | 941 | 919 | 193.2 |
| B | 7 | 220 | 111782 | 616.56 | 934 | 909 | 179.8 |
| B | 12 | 111 | 21047 | 111.99 | 934 | 909 | 179.8 |
| B | 11 | 111 | 18352 | 97.0 | 934 | 909 | 179.8 |
| C | 3 | 233 | 728039 | 3475.17 | 891 | 896 | 209.2 |
| C | 14 | 238 | 137065 | 650.78 | 891 | 896 | 209.2 |
| C | 5 | 218 | 65662 | 309.53 | 891 | 896 | 209.2 |
| D | 12 | 144 | 334873 | 1479.31 | 913 | 883 | 225.8 |
| D | 13 | 189 | 94089 | 412.83 | 913 | 883 | 225.8 |
| D | 15 | 0 | 88573 | 388.4 | 913 | 883 | 225.8 |
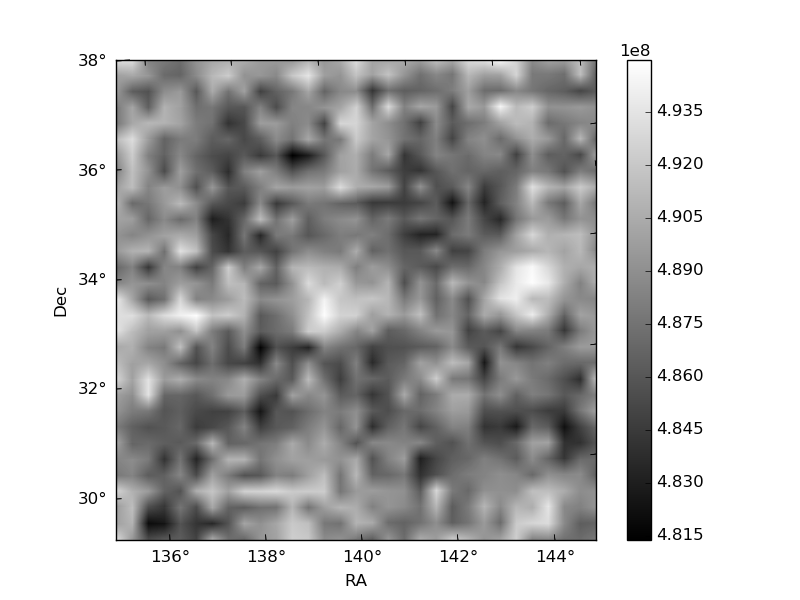
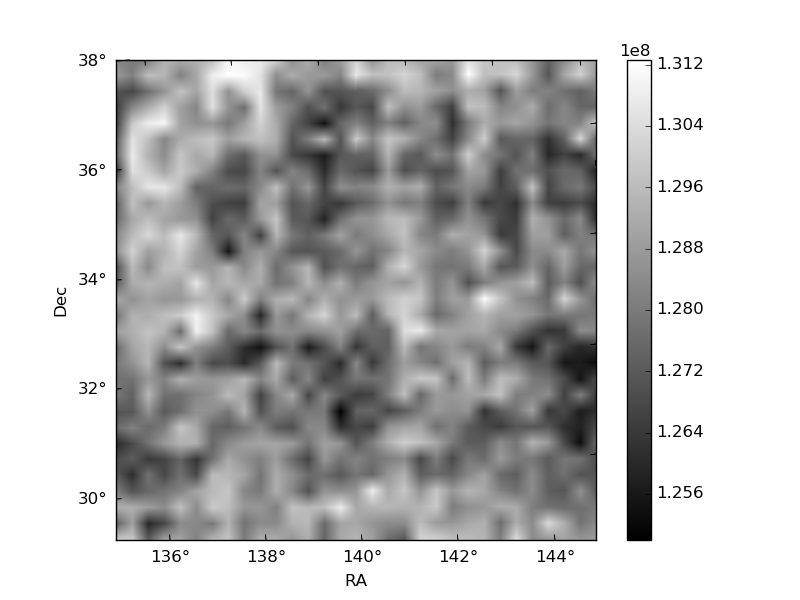
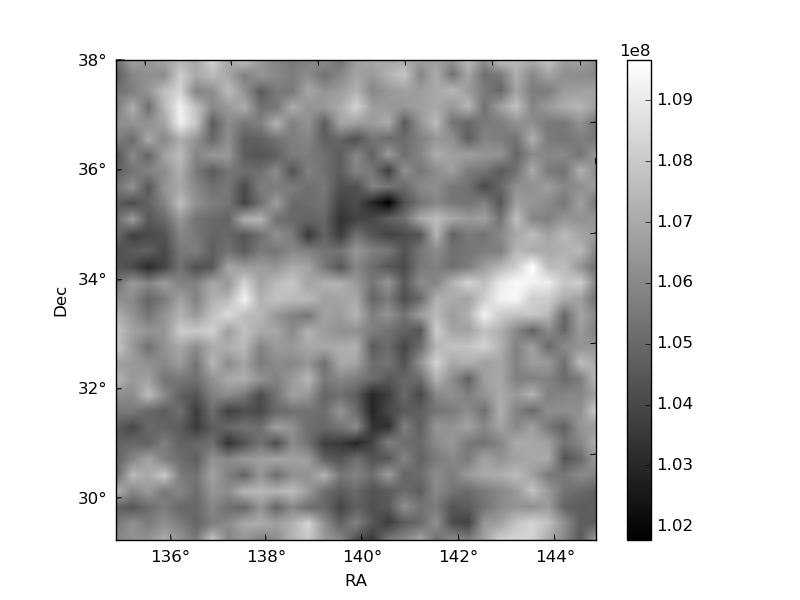
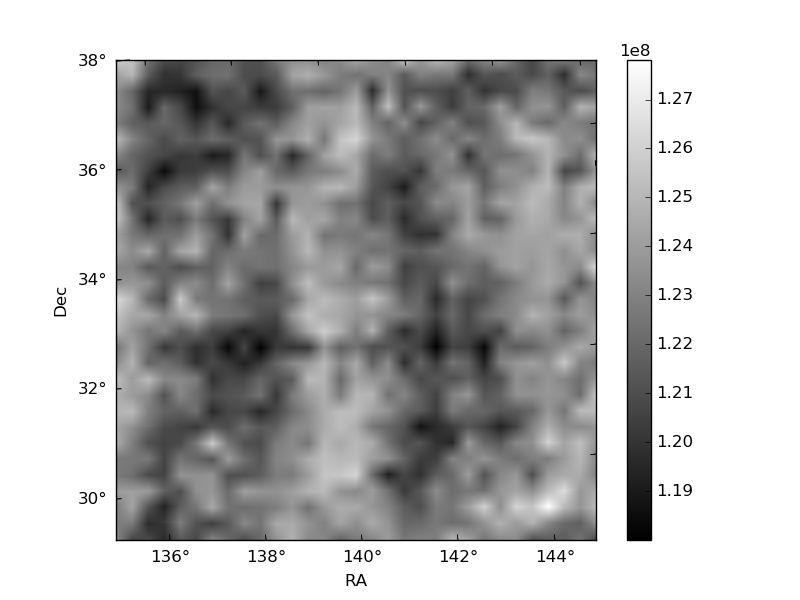
Histogram calculated using DETX and DETY for each event in the final _common_clean file
| Quadrant A | 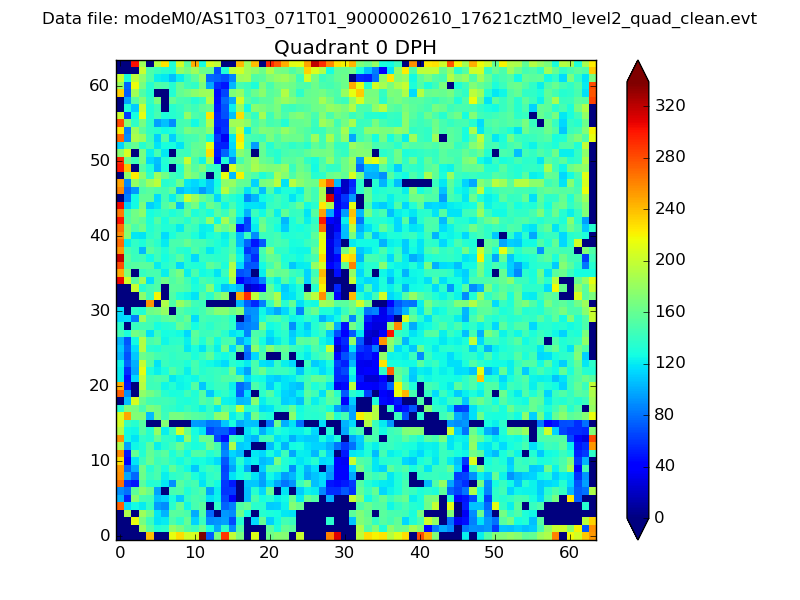 |
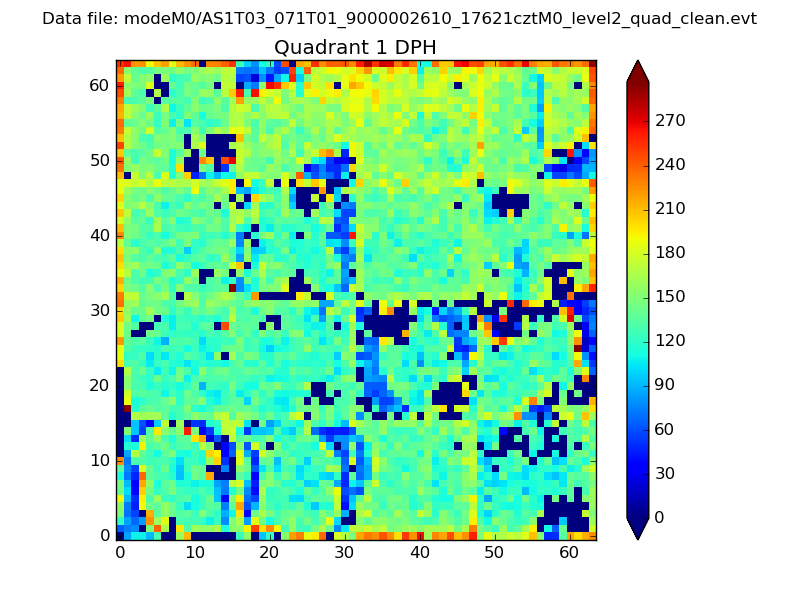 |
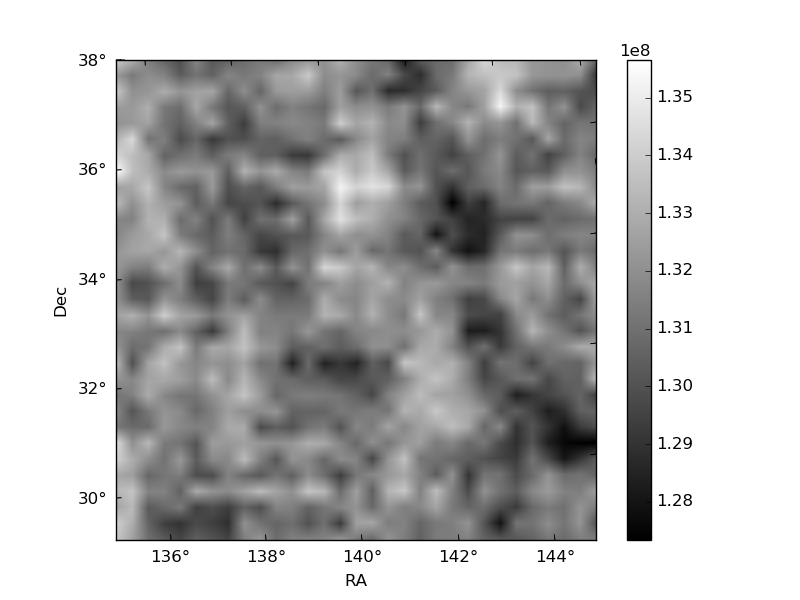
Quadrant B |
|---|---|---|---|
| Quadrant D | 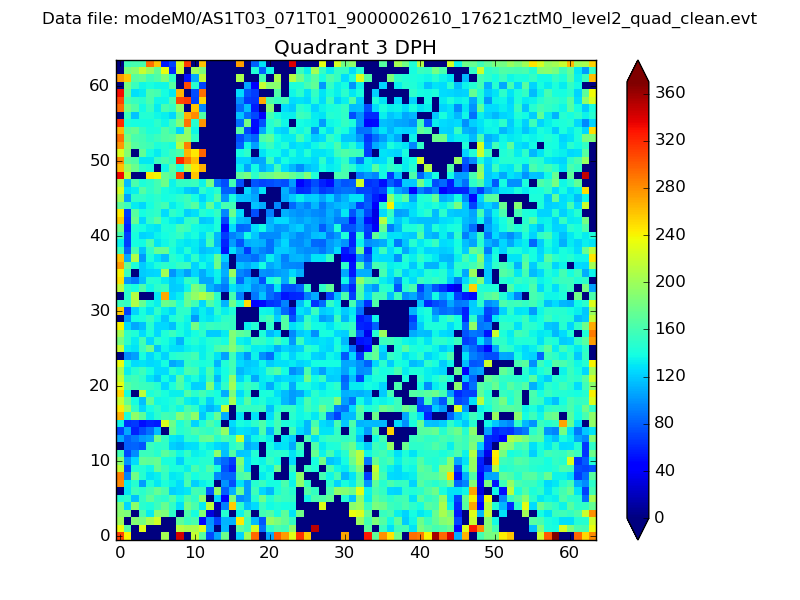 |
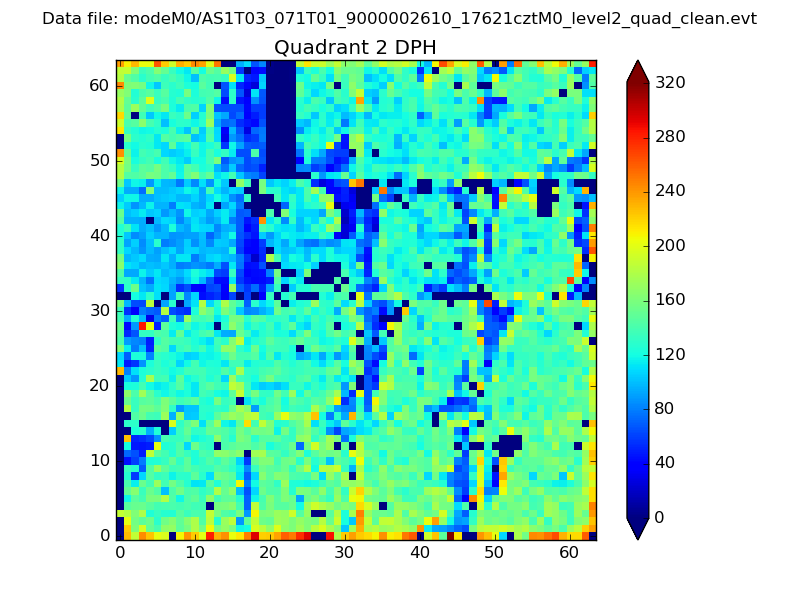 |
Quadrant C |
| Plot type | Count rate plots | Images |
|---|---|---|
| Comparison with Poisson distribution Blue bars denote a histogram of data divided into 1 sec bins. Red curve is a Poisson curve with rate = median count rate of data. |
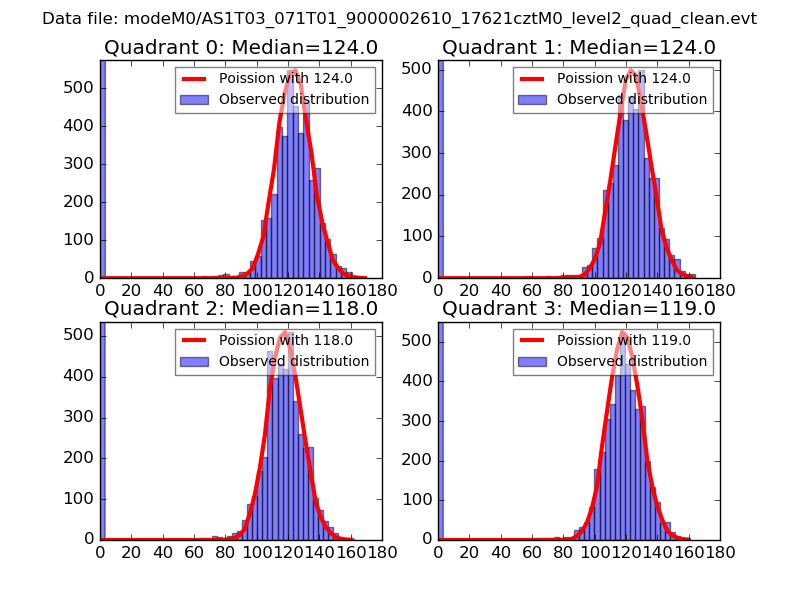 |
 |
| Quadrant-wise count rates Data is divided into 100 sec bins |
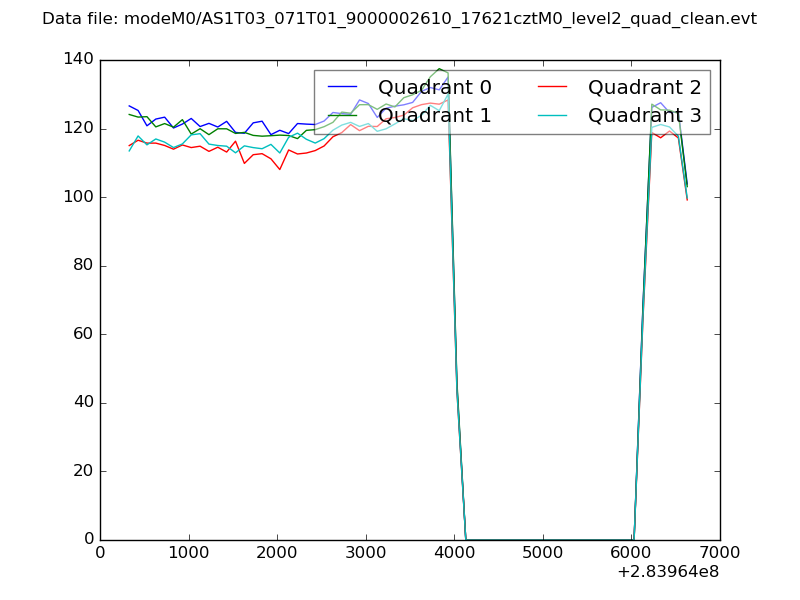 |
|
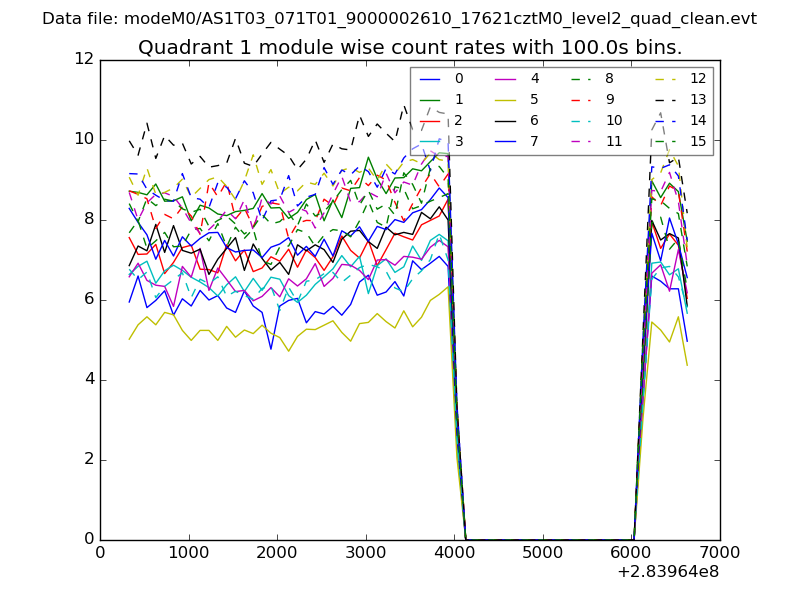
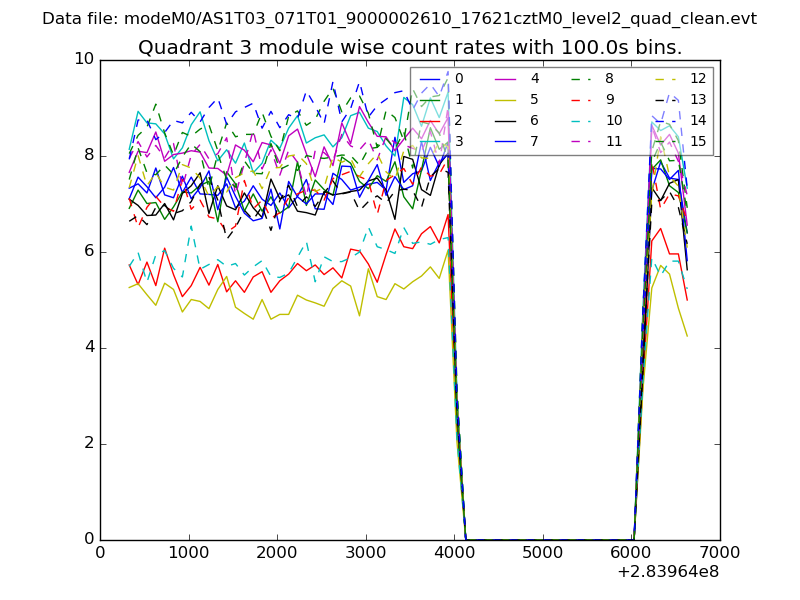
| Module-wise count rates for Quadrant A Data is divided into 100 sec bins |
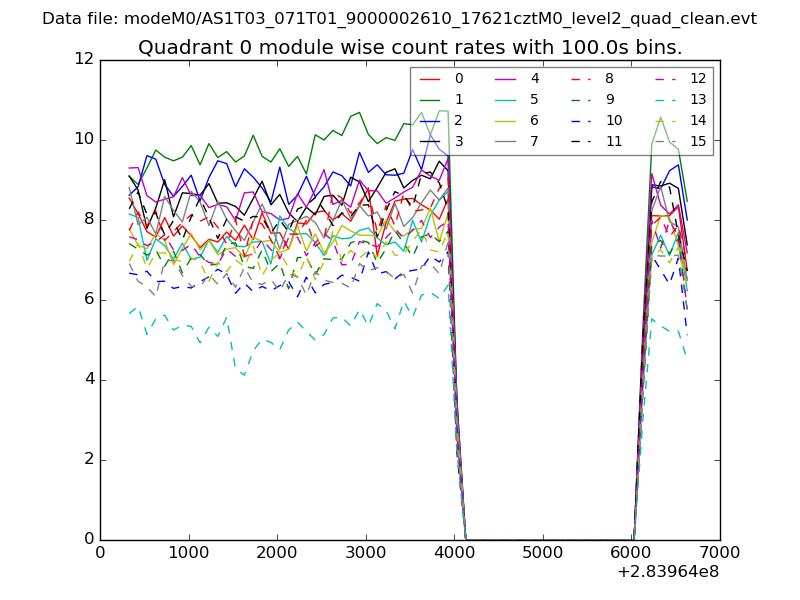 |
 |
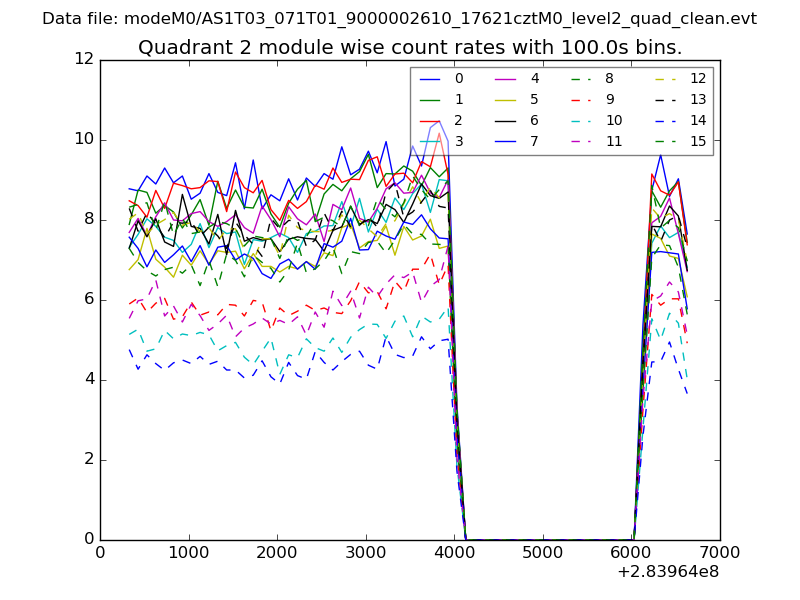
| Module-wise count rates for Quadrant B Data is divided into 100 sec bins |
 |
 |
| Module-wise count rates for Quadrant C Data is divided into 100 sec bins |
 |
 |
| Module-wise count rates for Quadrant D Data is divided into 100 sec bins |
 |
 |
| Parameter | Plot |
|---|---|
| CZT HV Monitor | 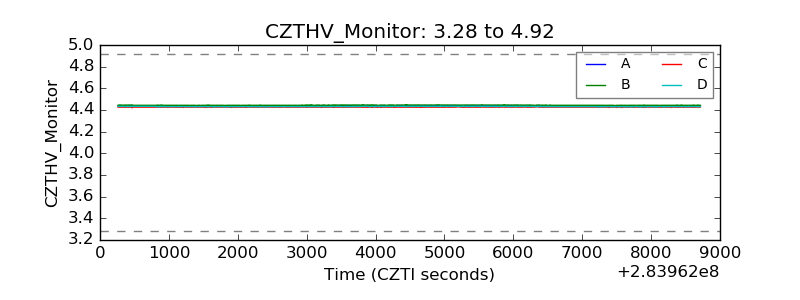 |
| D_VDD | 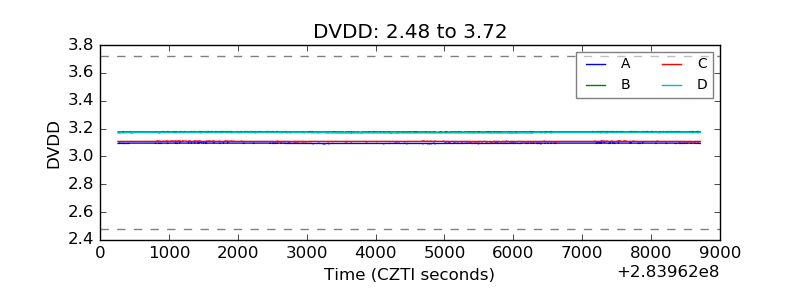 |
| Temperature 1 | 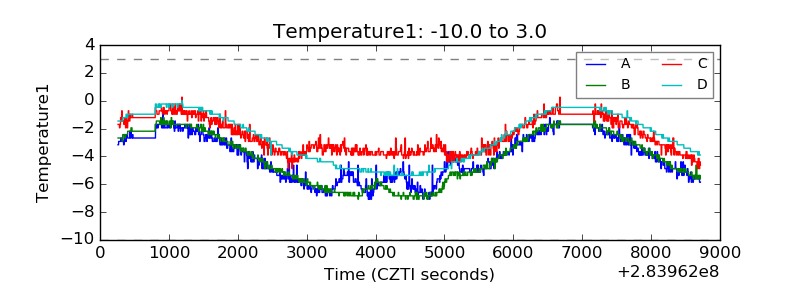 |
| Veto HV Monitor | 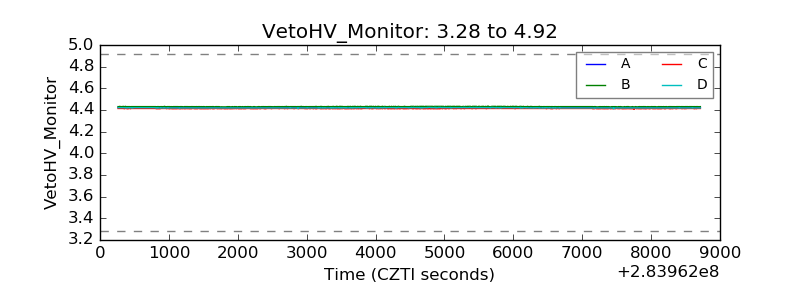 |
| Veto LLD | 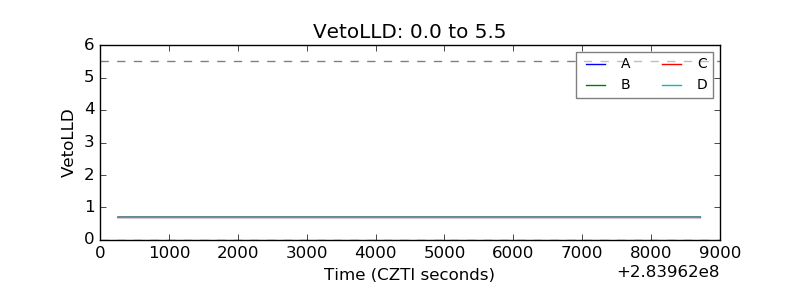 |
| Alpha Counter | 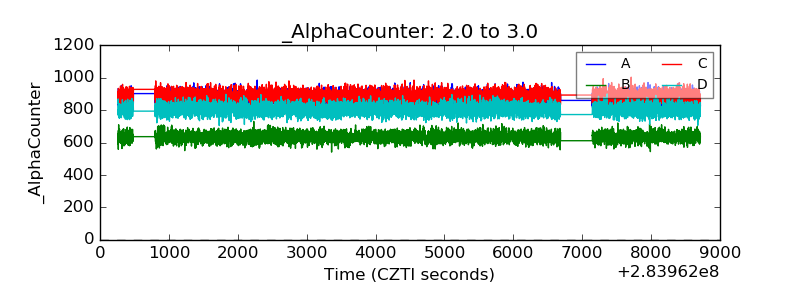 |
| _CPM_Rate | 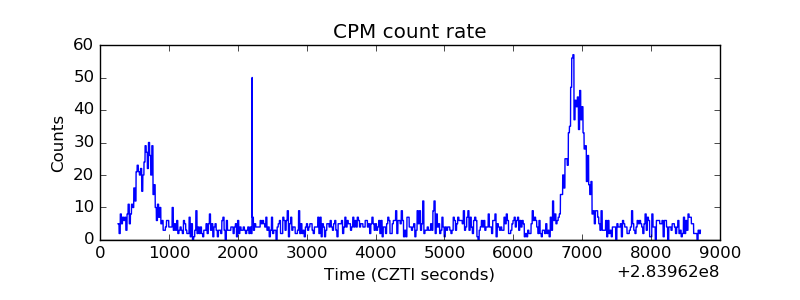 |
| CZT Counter | 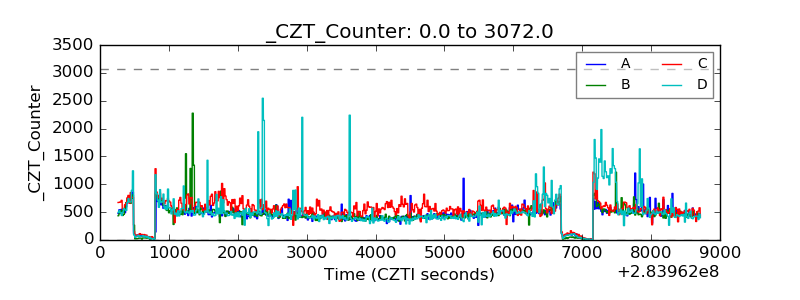 |
| +2.5 Volts monitor |  |
| +5 Volts monitor |  |
| _ROLL_ROT | 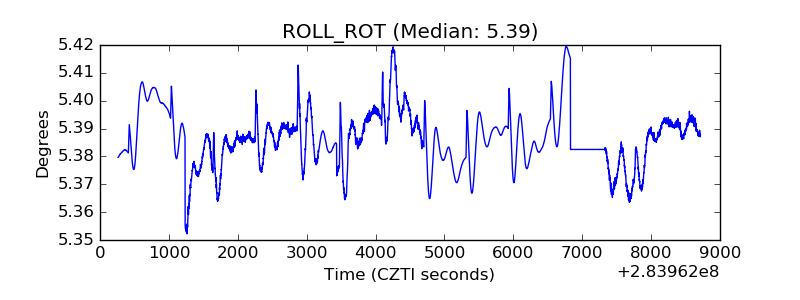 |
| _Roll_DEC | 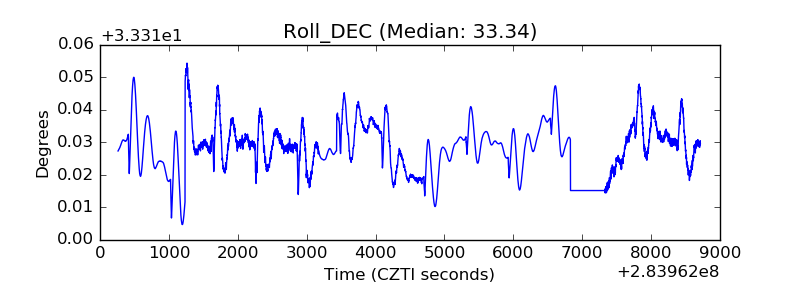 |
| _Roll_RA | 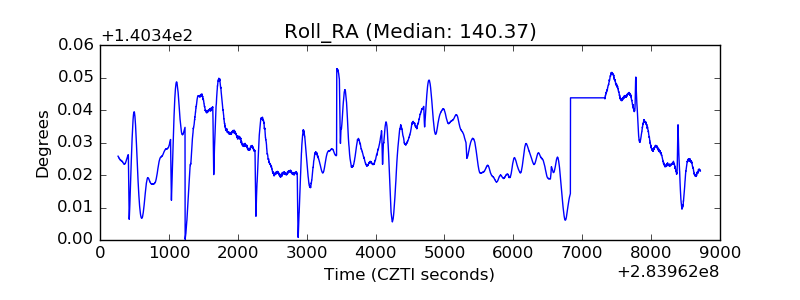 |
| Veto Counter | 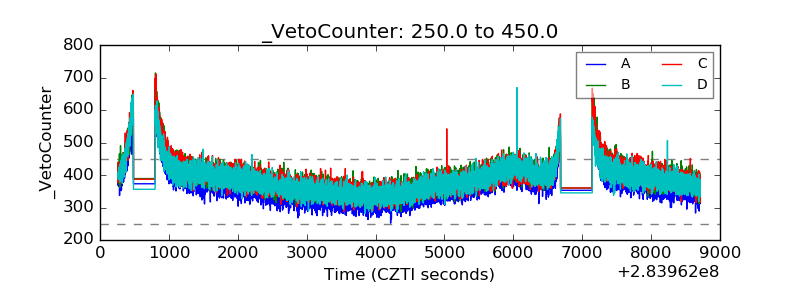 |