| Param | Original file | Final file |
|---|---|---|
| Filename | modeM0/AS1T03_071T01_9000002610_17623cztM0_level2.evt | modeM0/AS1T03_071T01_9000002610_17623cztM0_level2_quad_clean.evt |
| Size (bytes) | 713,655,360 | 141,312,960 |
| Size | 680.6 MB | 134.8 MB |
| Events in quadrant A | 5,063,326 | 902,879 |
| Events in quadrant B | 4,944,226 | 903,571 |
| Events in quadrant C | 5,699,427 | 866,239 |
| Events in quadrant D | 5,182,027 | 867,449 |
| Mode M0 | |||
|---|---|---|---|
| Quadrant | BADHDUFLAG | Total packets | Discarded packets |
| A | 0 | 22226 | 1 |
| B | 0 | 21945 | 1 |
| C | 0 | 23605 | 1 |
| D | 0 | 23186 | 1 |
| Mode SS | |||
|---|---|---|---|
| Quadrant | BADHDUFLAG | Total packets | Discarded packets |
| A | 0 | 216 | 0 |
| B | 0 | 216 | 0 |
| C | 0 | 216 | 0 |
| D | 0 | 216 | 0 |
| Mode M9 | |||
|---|---|---|---|
| Quadrant | BADHDUFLAG | Total packets | Discarded packets |
| A | 0 | 6 | 0 |
| B | 0 | 6 | 0 |
| C | 0 | 6 | 0 |
| D | 0 | 6 | 0 |
| Quadrant | Total seconds | Saturated seconds | Saturation percentage |
|---|---|---|---|
| A | 10682 | 29 | 0.271485% |
| B | 10683 | 33 | 0.308902% |
| C | 10682 | 102 | 0.954877% |
| D | 10682 | 91 | 0.851900% |
Noise dominated data is calculated using 1-second bins in cleaned event files. If a bin has >2000 counts, and if more than 50% of those come from <1% of pixels, then it is considered to be noise-dominated and hence unusable.
| Quadrant | # 1 sec bins | Bins with >0 counts | Bins with >2000 counts | High rate bins dominated by noise | Noise dominated (total time) | Noise dominated (detector-on time) | Marked lightcurve |
|---|---|---|---|---|---|---|---|
| A | 11272 | 10683 | 5 | 5 | 0.04% | 0.05% | 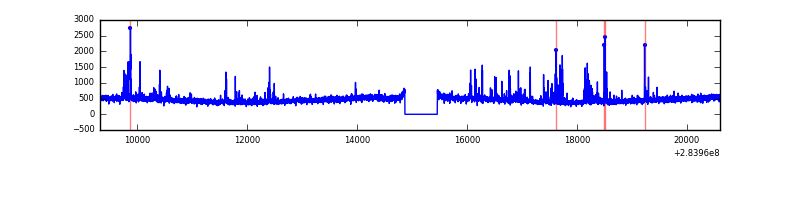 |
| B | 11273 | 10684 | 3 | 3 | 0.03% | 0.03% | 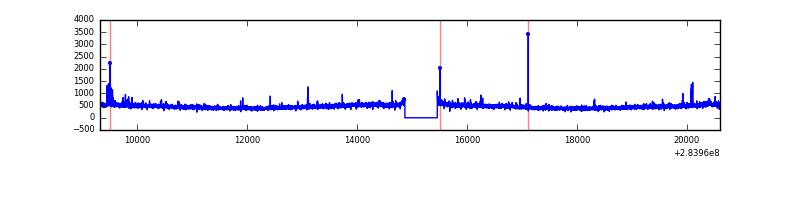 |
| C | 11272 | 10683 | 6 | 6 | 0.05% | 0.06% | 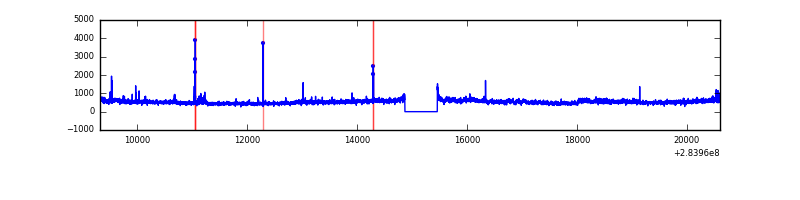 |
| D | 11272 | 10683 | 32 | 32 | 0.28% | 0.30% | 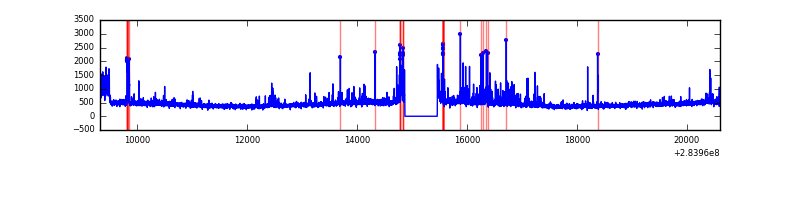 |
Top three noisy pixels from each quadrant. If the there are fewer than three noisy pixels in the level2.evt file, extra rows are filled as -1
| Pixel properties | Quadrant properties | ||||||
|---|---|---|---|---|---|---|---|
| Quadrant | DetID | PixID | Counts | Sigma | Mean | Median | Sigma |
| A | 14 | 237 | 275709 | 1084.26 | 1244 | 1218 | 253.2 |
| A | 0 | 226 | 10737 | 37.6 | 1244 | 1218 | 253.2 |
| A | 3 | 137 | 9229 | 31.64 | 1244 | 1218 | 253.2 |
| B | 7 | 220 | 35249 | 143.44 | 1238 | 1203 | 237.3 |
| B | 0 | 189 | 31275 | 126.7 | 1238 | 1203 | 237.3 |
| B | 12 | 111 | 28538 | 115.17 | 1238 | 1203 | 237.3 |
| C | 3 | 233 | 727080 | 2612.57 | 1184 | 1190 | 277.8 |
| C | 14 | 238 | 182056 | 650.96 | 1184 | 1190 | 277.8 |
| C | 0 | 207 | 95166 | 338.23 | 1184 | 1190 | 277.8 |
| D | 1 | 52 | 244395 | 827.99 | 1202 | 1166 | 293.8 |
| D | 13 | 189 | 140331 | 473.74 | 1202 | 1166 | 293.8 |
| D | 12 | 144 | 111689 | 376.24 | 1202 | 1166 | 293.8 |
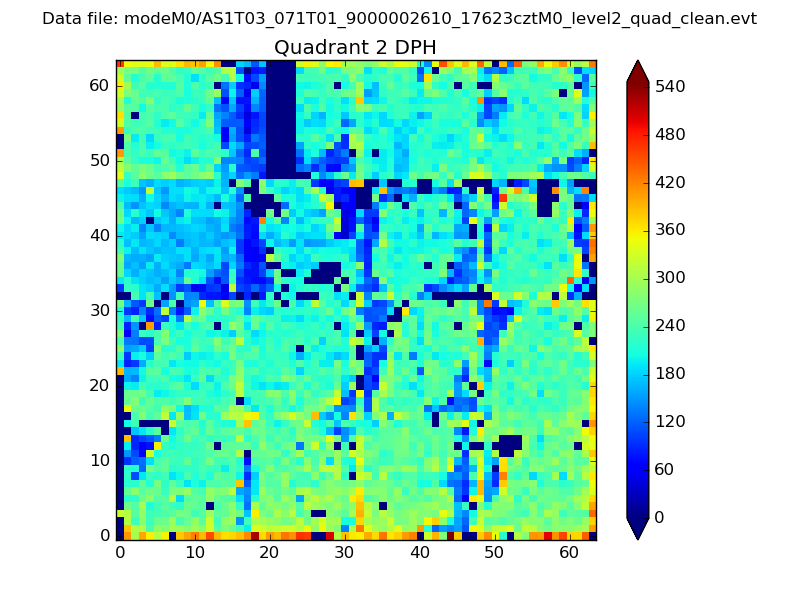
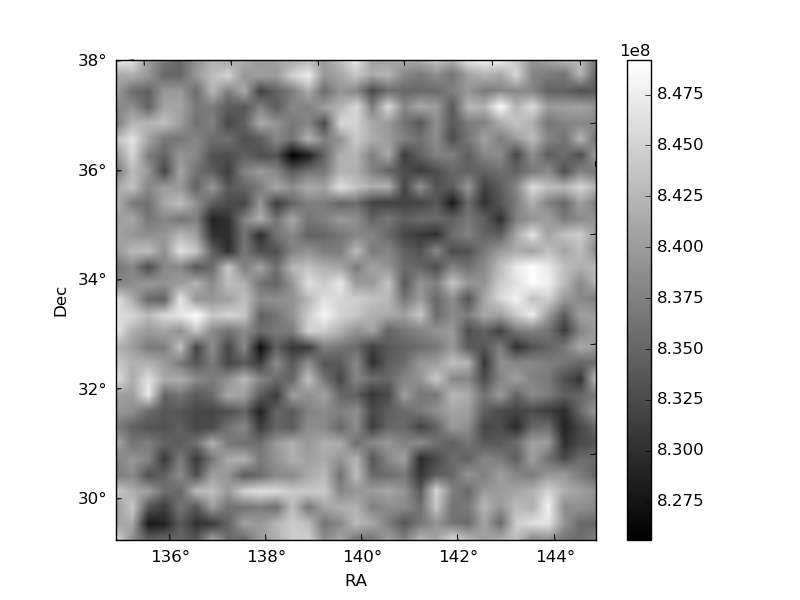
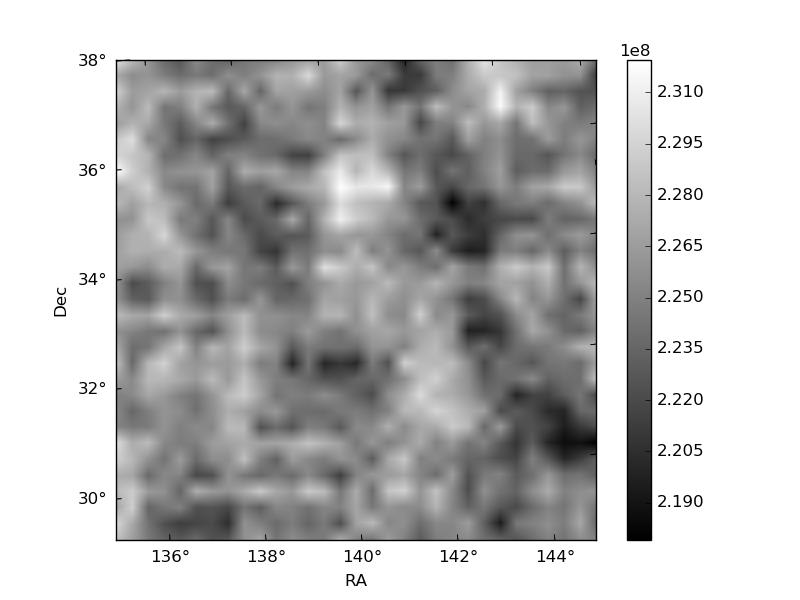
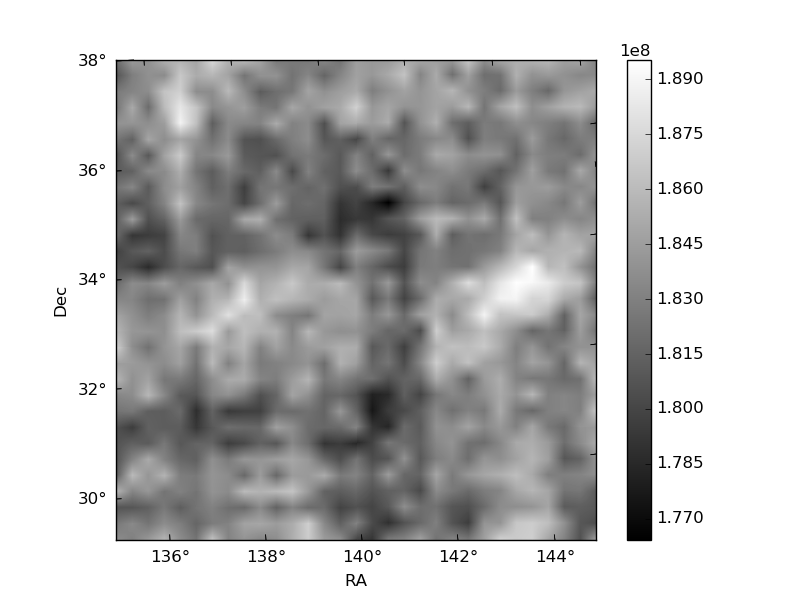
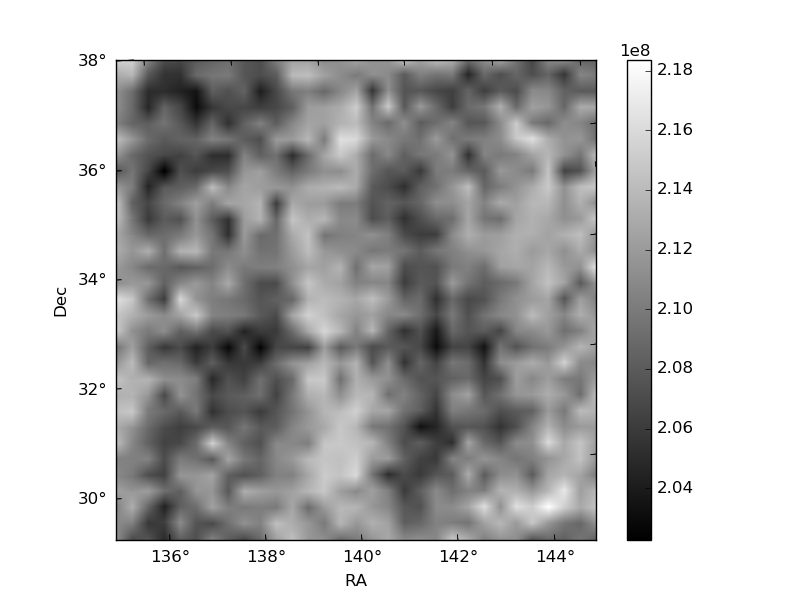
Histogram calculated using DETX and DETY for each event in the final _common_clean file
| Quadrant A | 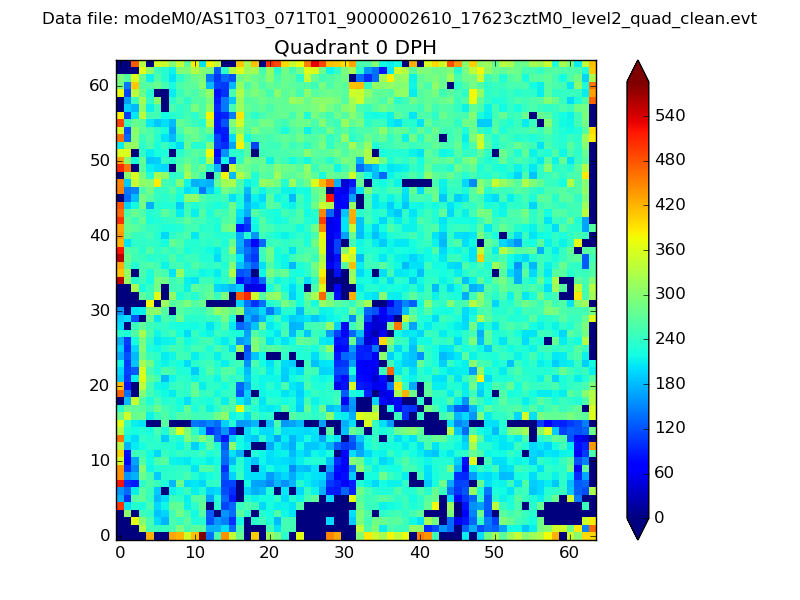 |
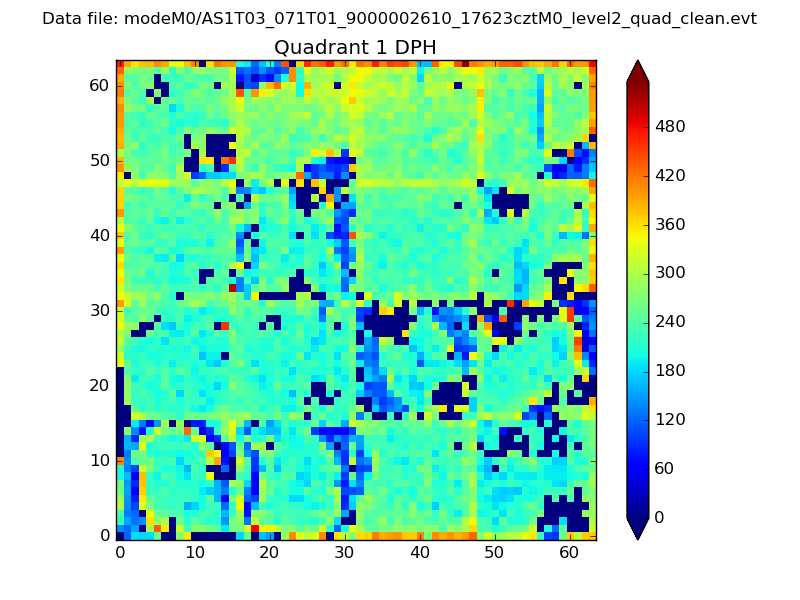 |
Quadrant B |
|---|---|---|---|
| Quadrant D | 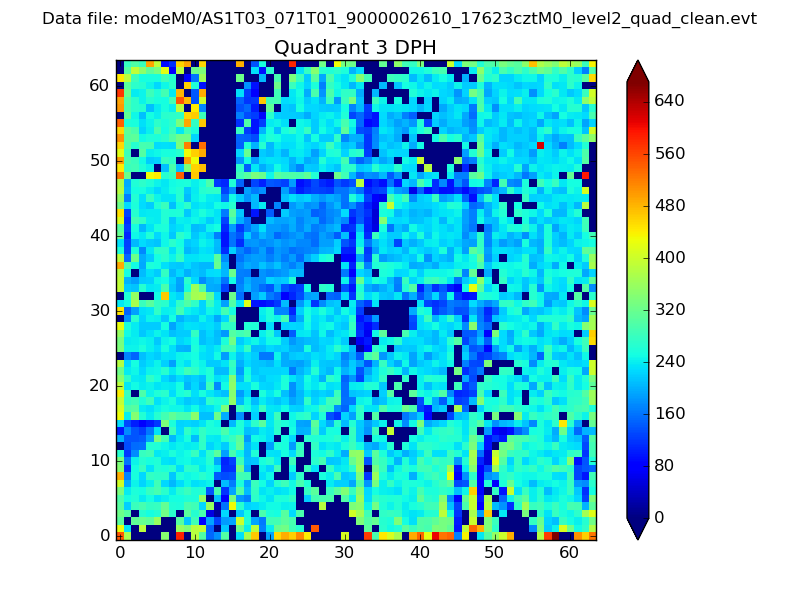 |
 |
Quadrant C |
| Plot type | Count rate plots | Images |
|---|---|---|
| Comparison with Poisson distribution Blue bars denote a histogram of data divided into 1 sec bins. Red curve is a Poisson curve with rate = median count rate of data. |
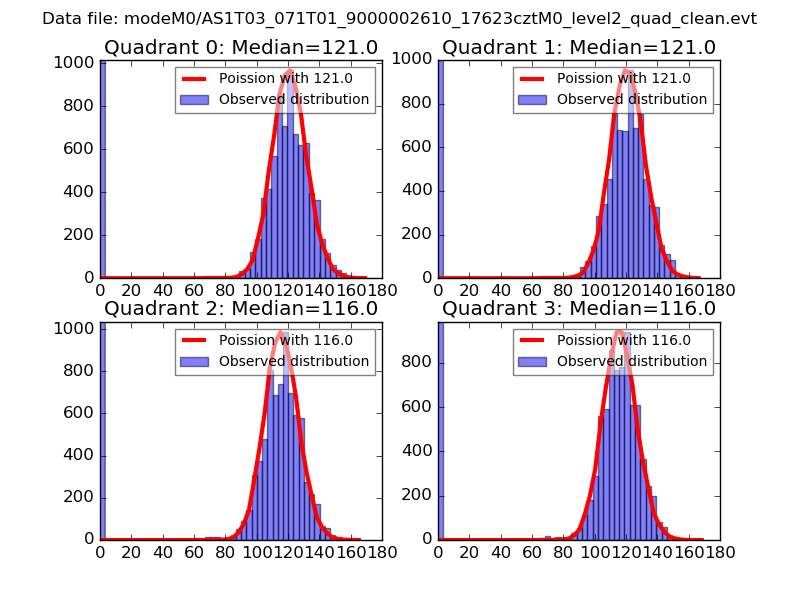 |
 |
| Quadrant-wise count rates Data is divided into 100 sec bins |
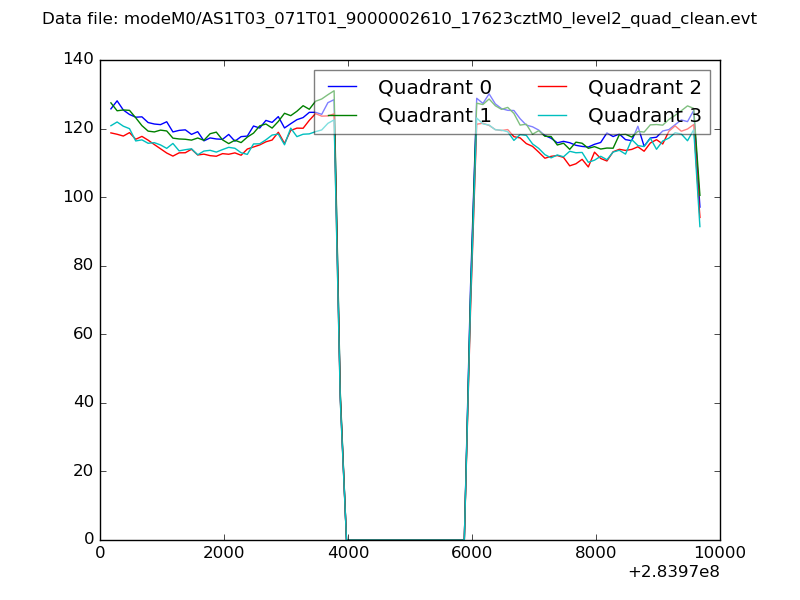 |
|
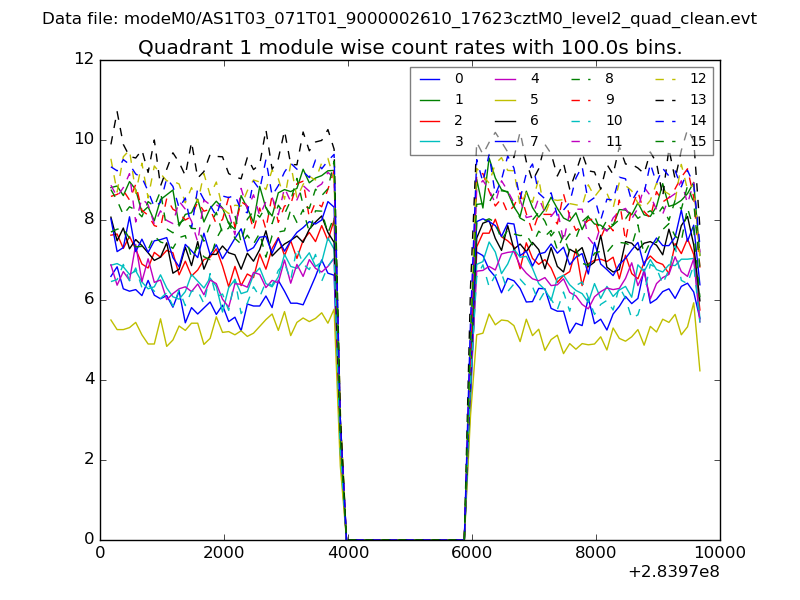
| Module-wise count rates for Quadrant A Data is divided into 100 sec bins |
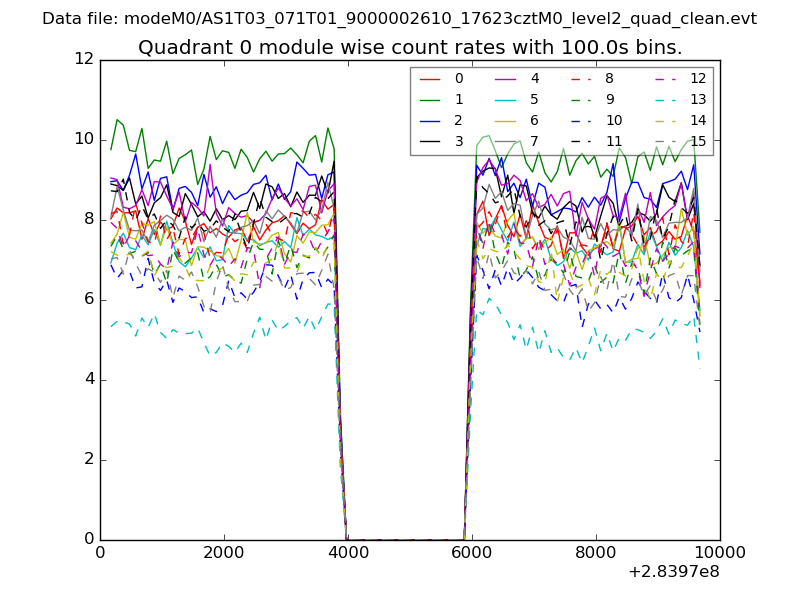 |
 |
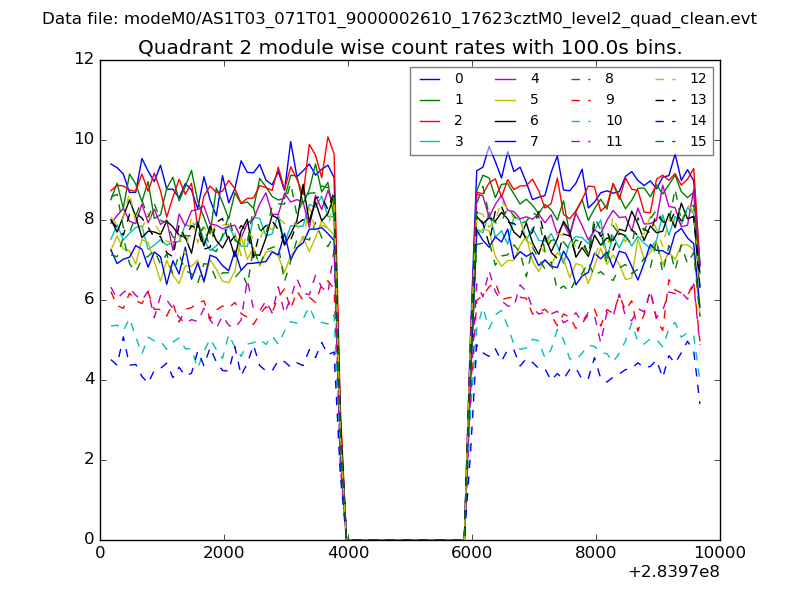
| Module-wise count rates for Quadrant B Data is divided into 100 sec bins |
 |
 |
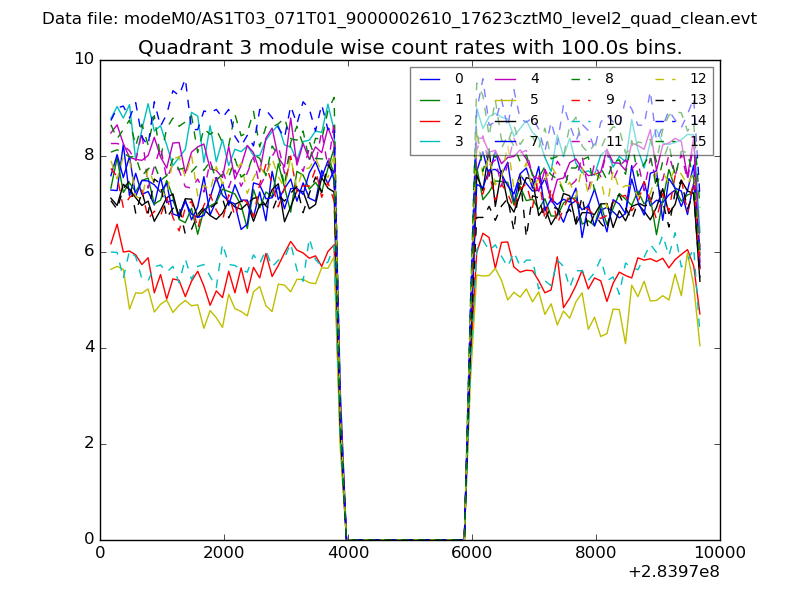
| Module-wise count rates for Quadrant C Data is divided into 100 sec bins |
 |
 |
| Module-wise count rates for Quadrant D Data is divided into 100 sec bins |
 |
 |
| Parameter | Plot |
|---|---|
| CZT HV Monitor | 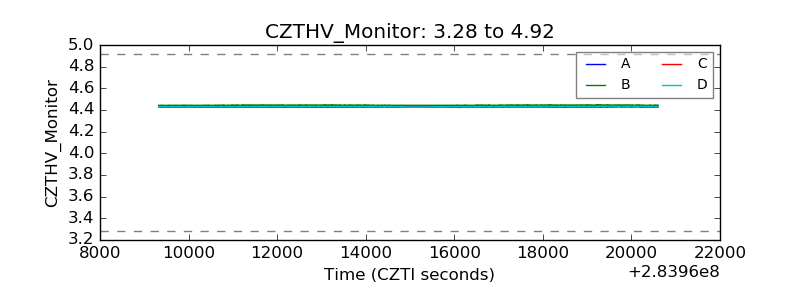 |
| D_VDD | 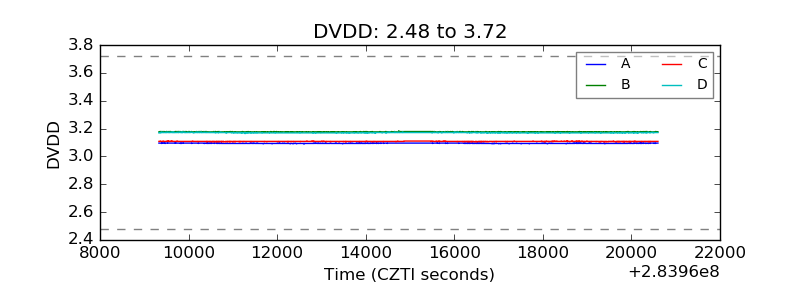 |
| Temperature 1 | 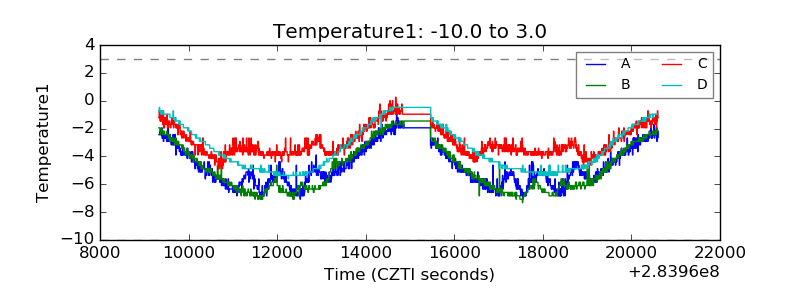 |
| Veto HV Monitor | 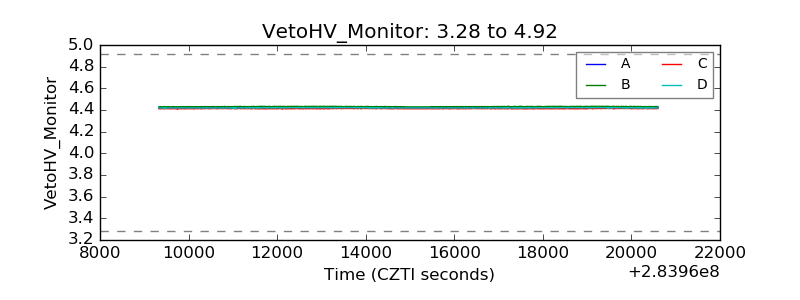 |
| Veto LLD | 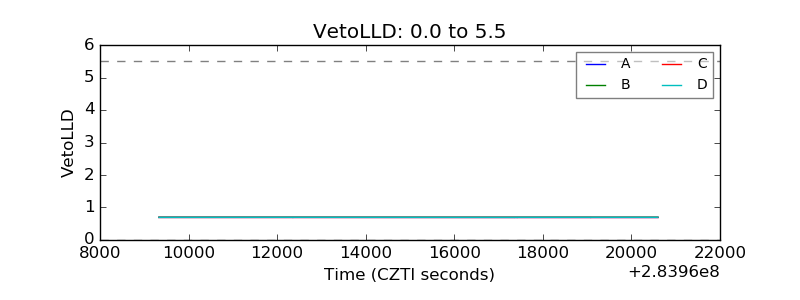 |
| Alpha Counter | 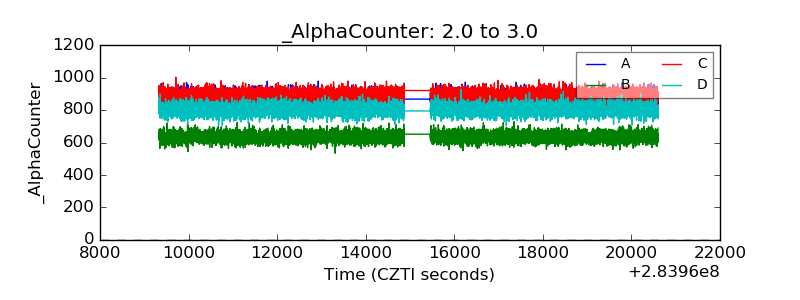 |
| _CPM_Rate | 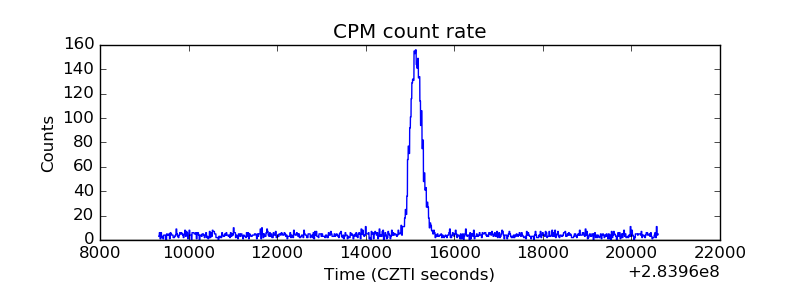 |
| CZT Counter | 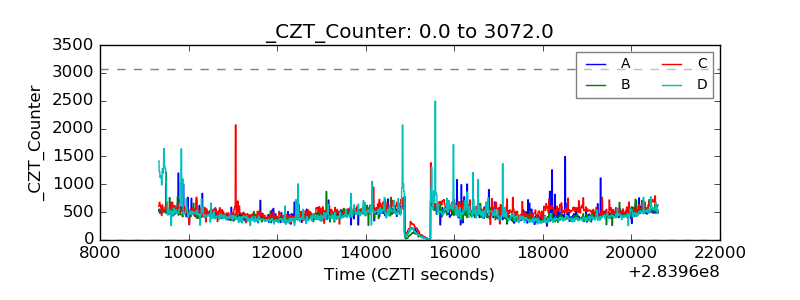 |
| +2.5 Volts monitor |  |
| +5 Volts monitor |  |
| _ROLL_ROT | 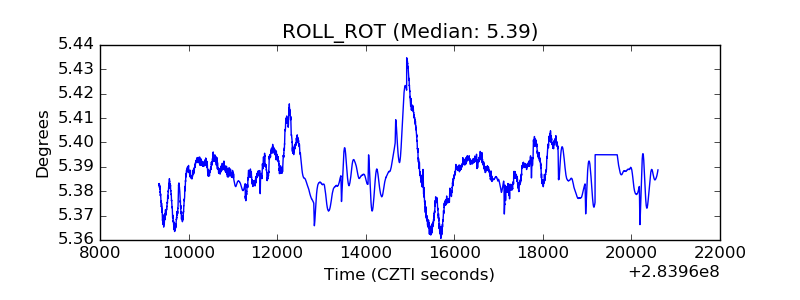 |
| _Roll_DEC | 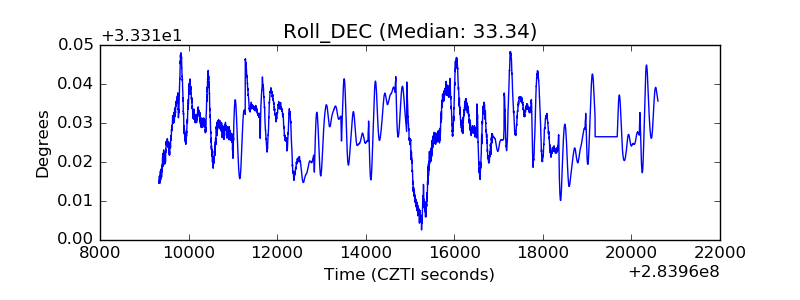 |
| _Roll_RA | 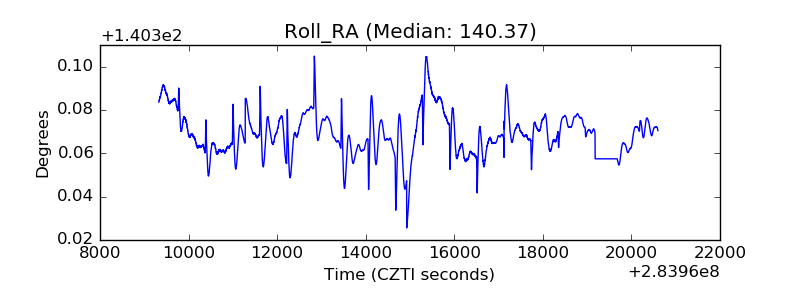 |
| Veto Counter | 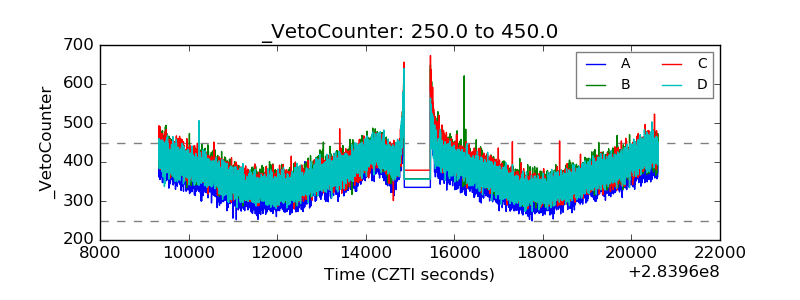 |