| Param | Original file | Final file |
|---|---|---|
| Filename | modeM0/AS1T03_071T01_9000002610_17624cztM0_level2.evt | modeM0/AS1T03_071T01_9000002610_17624cztM0_level2_quad_clean.evt |
| Size (bytes) | 594,936,000 | 101,079,360 |
| Size | 567.4 MB | 96.4 MB |
| Events in quadrant A | 3,778,119 | 640,028 |
| Events in quadrant B | 3,934,280 | 641,380 |
| Events in quadrant C | 4,336,457 | 613,960 |
| Events in quadrant D | 5,421,162 | 604,513 |
| Mode M0 | |||
|---|---|---|---|
| Quadrant | BADHDUFLAG | Total packets | Discarded packets |
| A | 0 | 16535 | 2 |
| B | 0 | 16911 | 2 |
| C | 0 | 17995 | 2 |
| D | 0 | 21844 | 2 |
| Mode SS | |||
|---|---|---|---|
| Quadrant | BADHDUFLAG | Total packets | Discarded packets |
| A | 0 | 166 | 0 |
| B | 0 | 166 | 0 |
| C | 0 | 166 | 0 |
| D | 0 | 166 | 0 |
| Mode M9 | |||
|---|---|---|---|
| Quadrant | BADHDUFLAG | Total packets | Discarded packets |
| A | 0 | 16 | 0 |
| B | 0 | 16 | 0 |
| C | 0 | 16 | 0 |
| D | 0 | 16 | 0 |
| Quadrant | Total seconds | Saturated seconds | Saturation percentage |
|---|---|---|---|
| A | 8073 | 38 | 0.470705% |
| B | 8074 | 74 | 0.916522% |
| C | 8074 | 137 | 1.696805% |
| D | 8073 | 491 | 6.082002% |
Noise dominated data is calculated using 1-second bins in cleaned event files. If a bin has >2000 counts, and if more than 50% of those come from <1% of pixels, then it is considered to be noise-dominated and hence unusable.
| Quadrant | # 1 sec bins | Bins with >0 counts | Bins with >2000 counts | High rate bins dominated by noise | Noise dominated (total time) | Noise dominated (detector-on time) | Marked lightcurve |
|---|---|---|---|---|---|---|---|
| A | 9703 | 8074 | 0 | 0 | 0.00% | 0.00% | 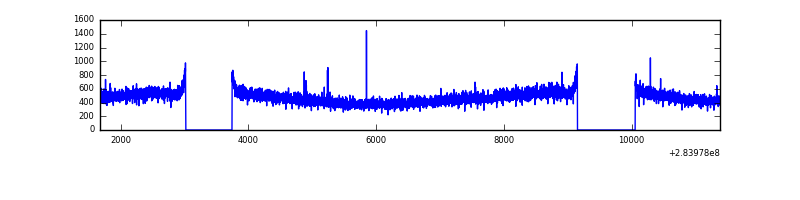 |
| B | 9704 | 8074 | 2 | 2 | 0.02% | 0.02% | 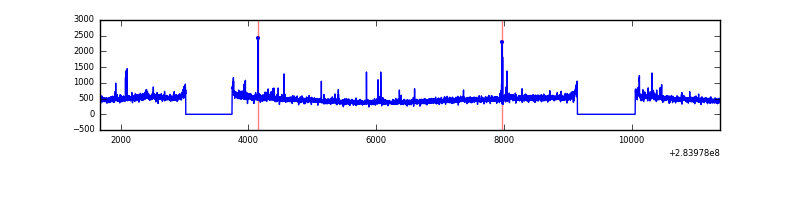 |
| C | 9704 | 8076 | 7 | 7 | 0.07% | 0.09% | 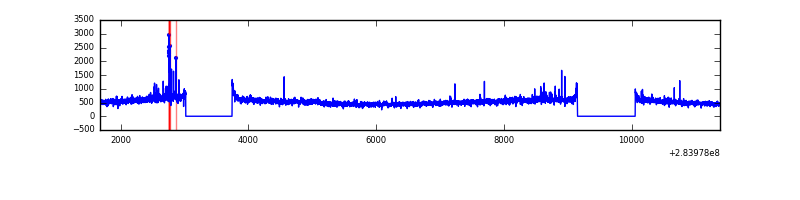 |
| D | 9703 | 8075 | 286 | 286 | 2.95% | 3.54% | 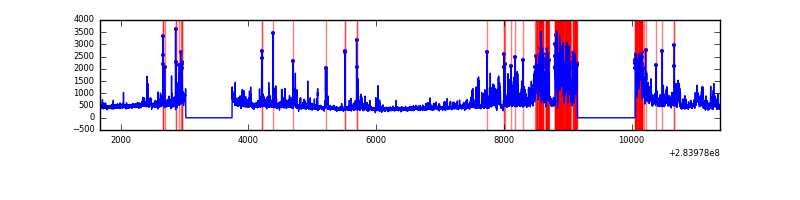 |
Top three noisy pixels from each quadrant. If the there are fewer than three noisy pixels in the level2.evt file, extra rows are filled as -1
| Pixel properties | Quadrant properties | ||||||
|---|---|---|---|---|---|---|---|
| Quadrant | DetID | PixID | Counts | Sigma | Mean | Median | Sigma |
| A | 14 | 237 | 13522 | 63.46 | 979 | 959 | 198.0 |
| A | 0 | 226 | 8451 | 37.85 | 979 | 959 | 198.0 |
| A | 3 | 137 | 7603 | 33.56 | 979 | 959 | 198.0 |
| B | 0 | 230 | 40083 | 208.85 | 976 | 950 | 187.4 |
| B | 4 | 80 | 31512 | 163.1 | 976 | 950 | 187.4 |
| B | 12 | 111 | 22836 | 116.8 | 976 | 950 | 187.4 |
| C | 3 | 233 | 419521 | 1912.43 | 933 | 936 | 218.9 |
| C | 14 | 238 | 144778 | 657.18 | 933 | 936 | 218.9 |
| C | 0 | 207 | 87061 | 393.49 | 933 | 936 | 218.9 |
| D | 1 | 52 | 1587653 | 7011.61 | 927 | 900 | 226.3 |
| D | 13 | 189 | 173145 | 761.12 | 927 | 900 | 226.3 |
| D | 7 | 223 | 39922 | 172.43 | 927 | 900 | 226.3 |
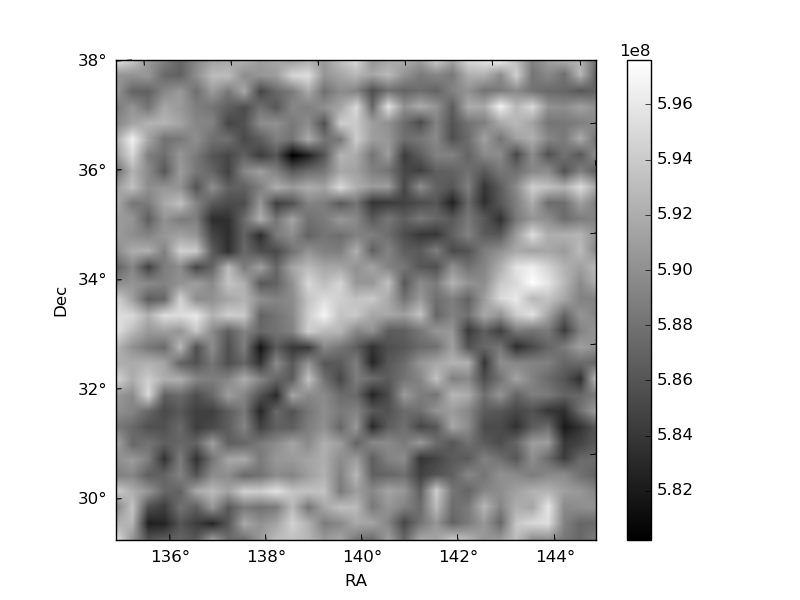
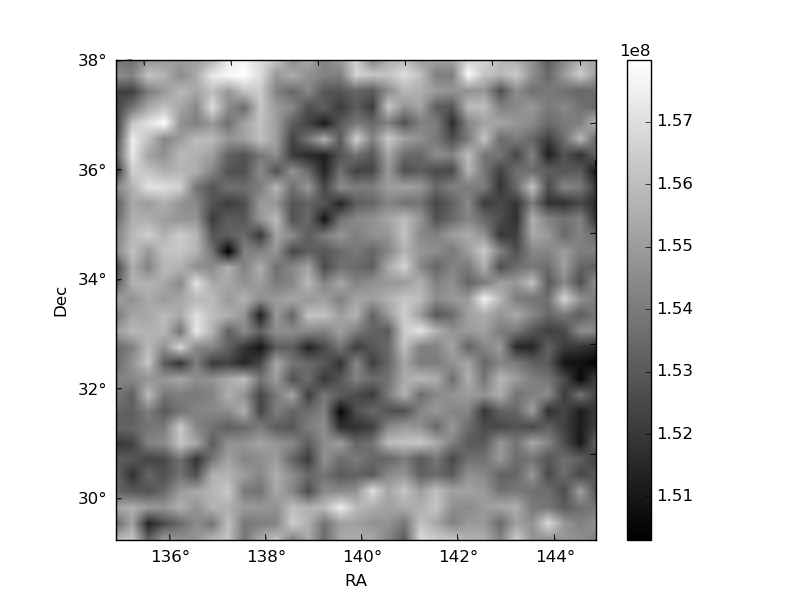
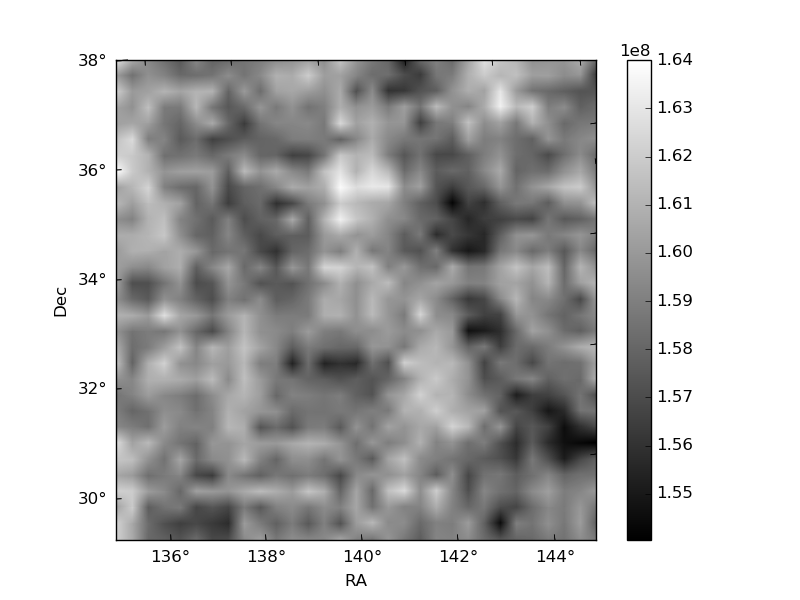
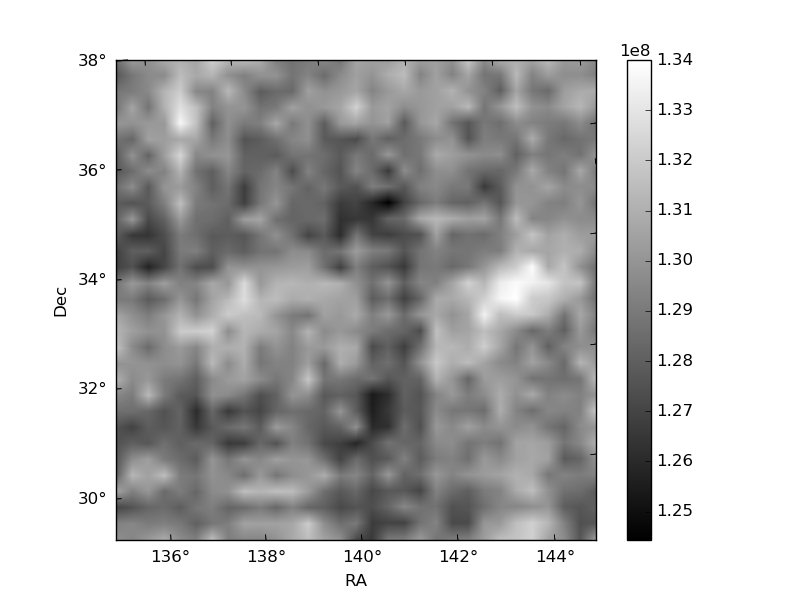
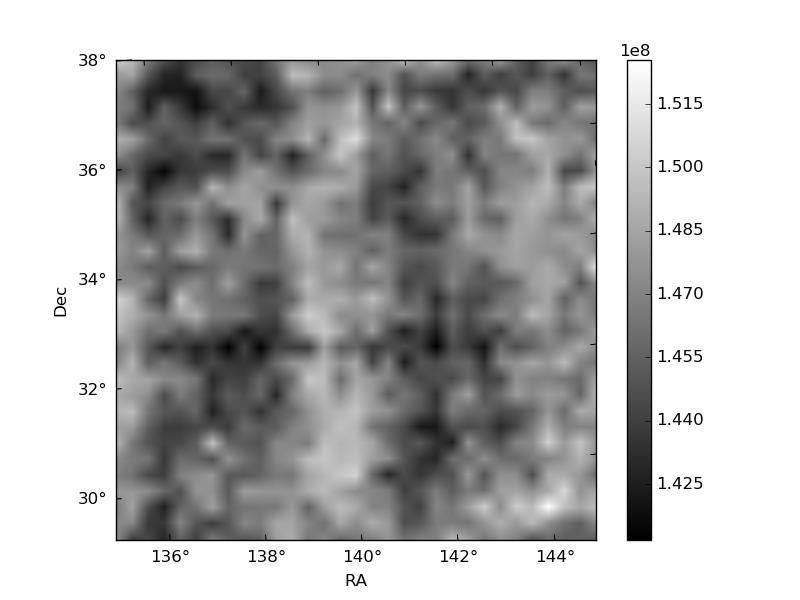
Histogram calculated using DETX and DETY for each event in the final _common_clean file
| Quadrant A | 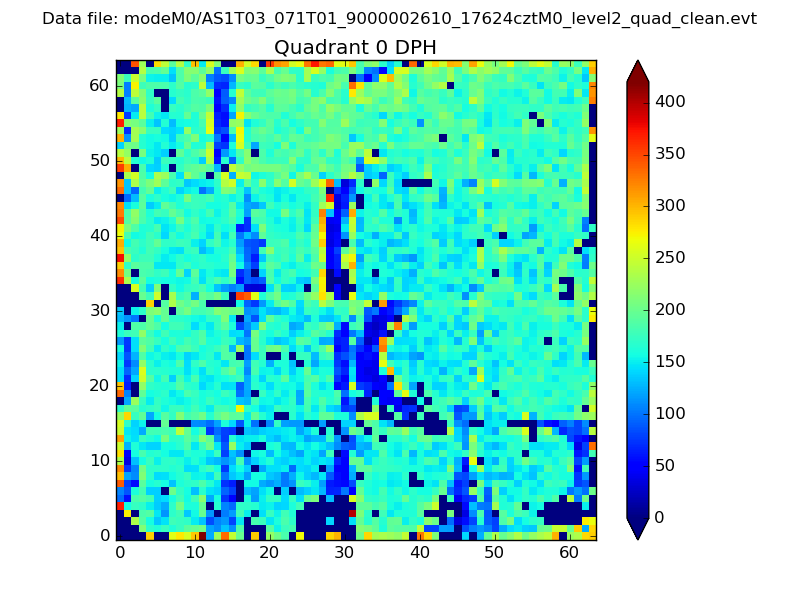 |
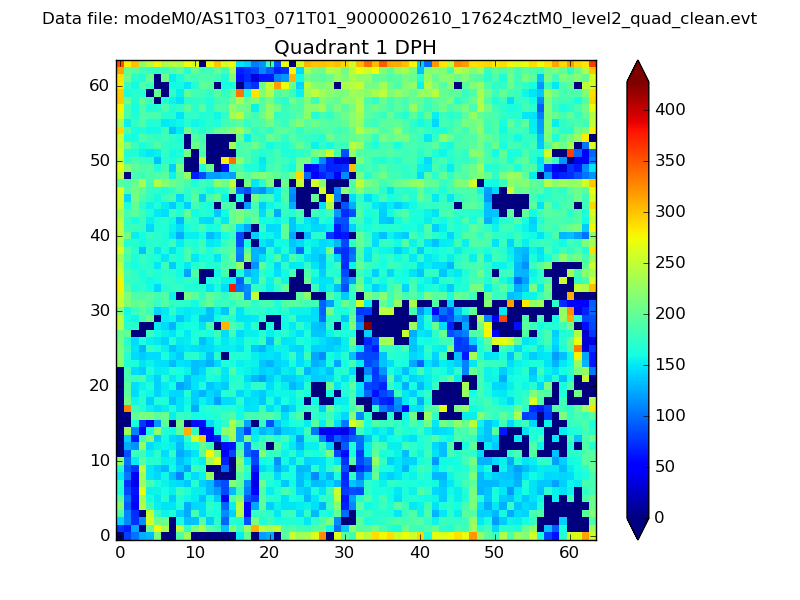 |
Quadrant B |
|---|---|---|---|
| Quadrant D | 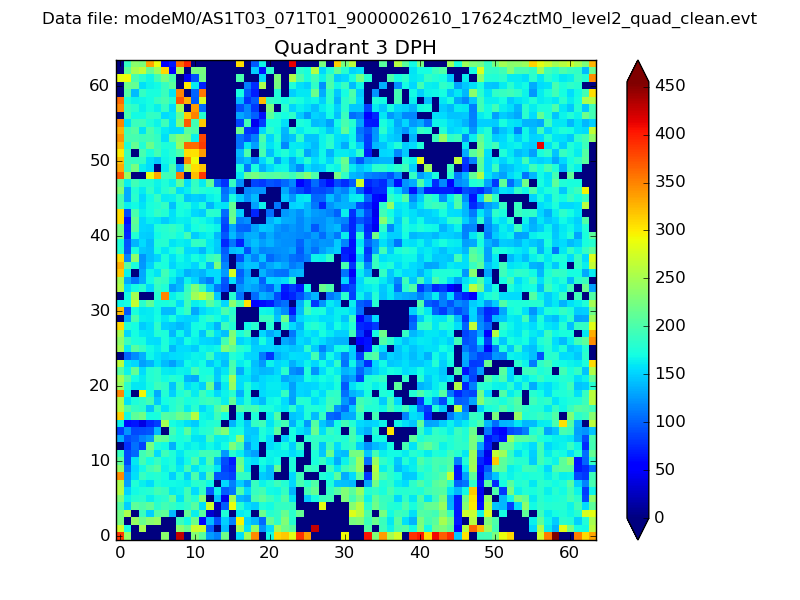 |
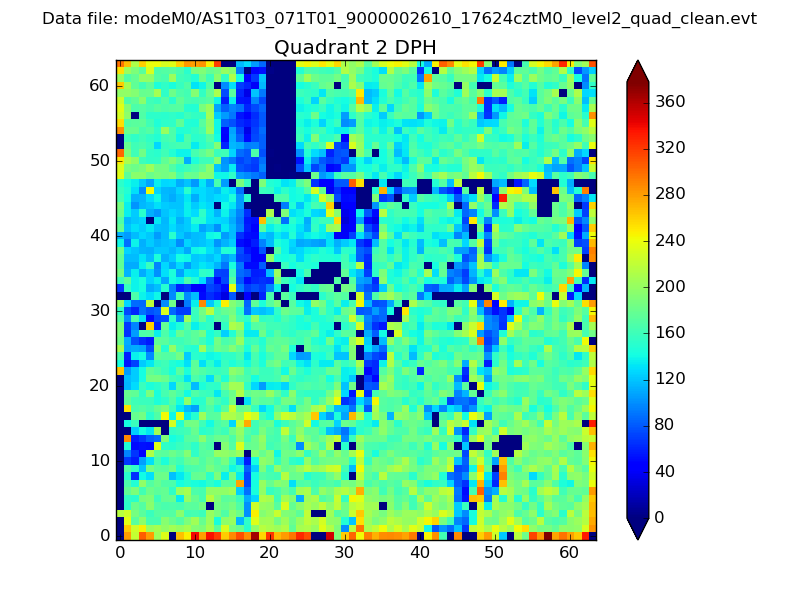 |
Quadrant C |
| Plot type | Count rate plots | Images |
|---|---|---|
| Comparison with Poisson distribution Blue bars denote a histogram of data divided into 1 sec bins. Red curve is a Poisson curve with rate = median count rate of data. |
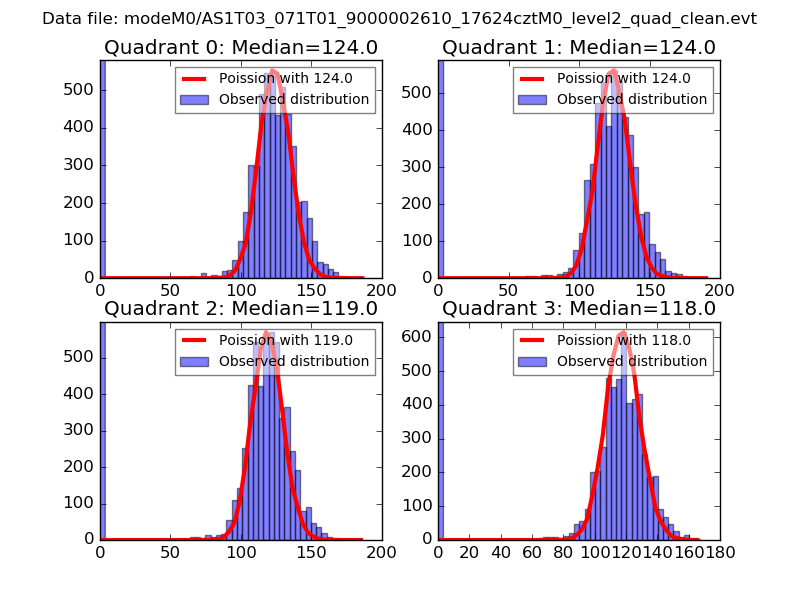 |
 |
| Quadrant-wise count rates Data is divided into 100 sec bins |
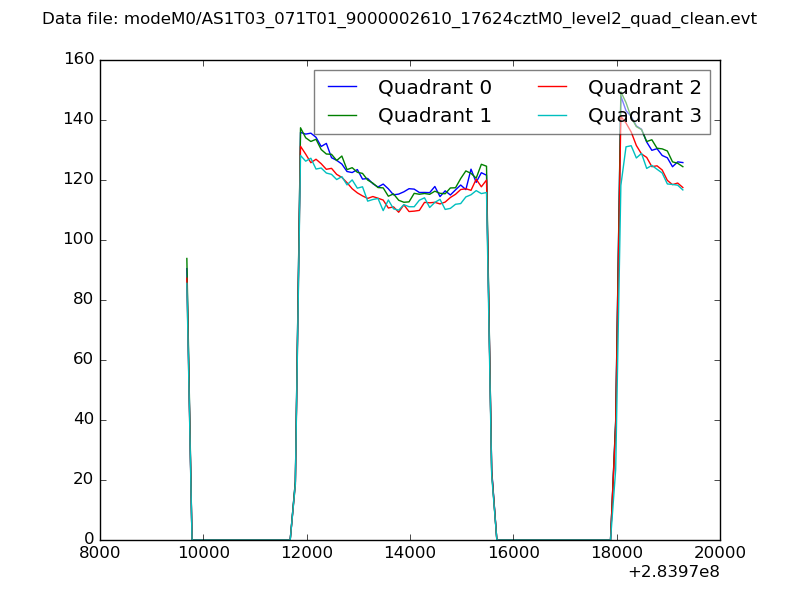 |
|
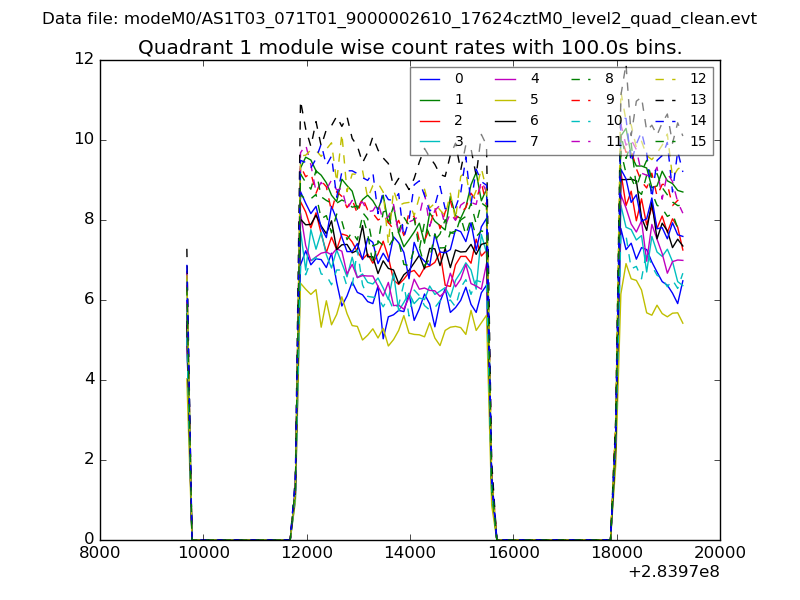
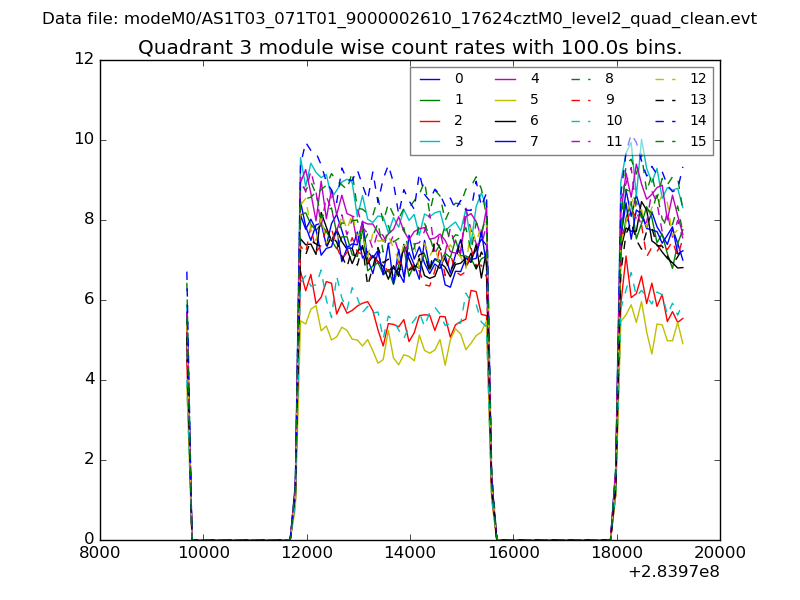
| Module-wise count rates for Quadrant A Data is divided into 100 sec bins |
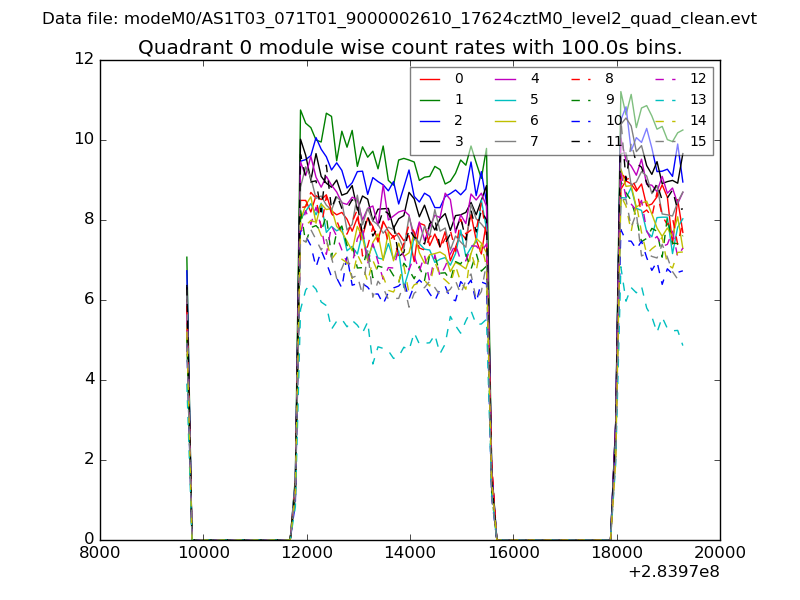 |
 |
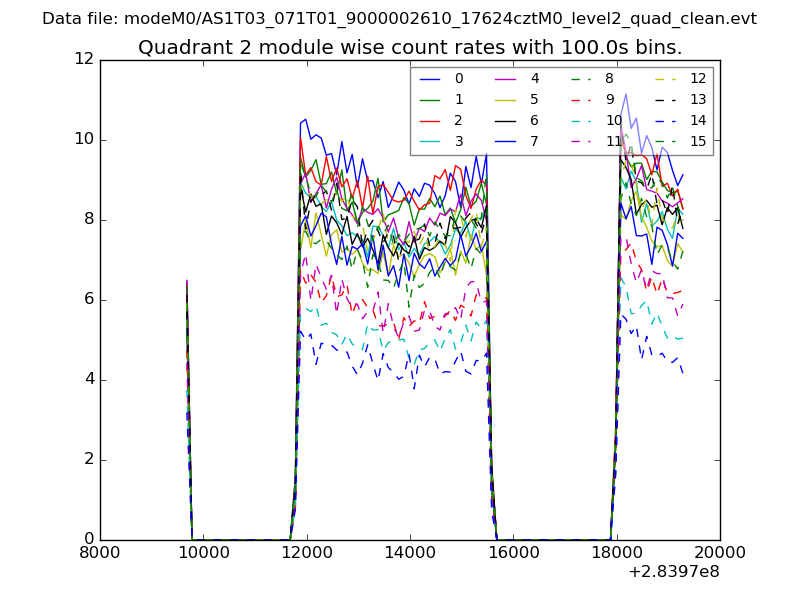
| Module-wise count rates for Quadrant B Data is divided into 100 sec bins |
 |
 |
| Module-wise count rates for Quadrant C Data is divided into 100 sec bins |
 |
 |
| Module-wise count rates for Quadrant D Data is divided into 100 sec bins |
 |
 |
| Parameter | Plot |
|---|---|
| CZT HV Monitor | 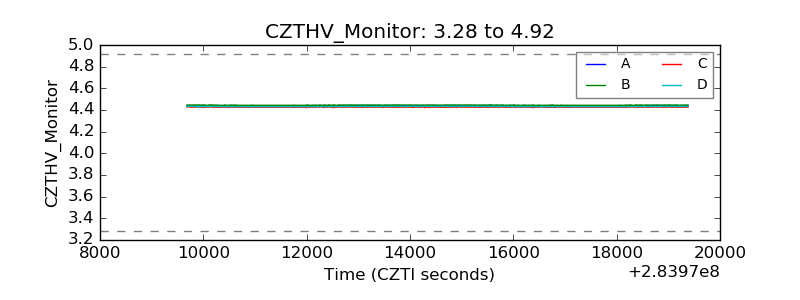 |
| D_VDD | 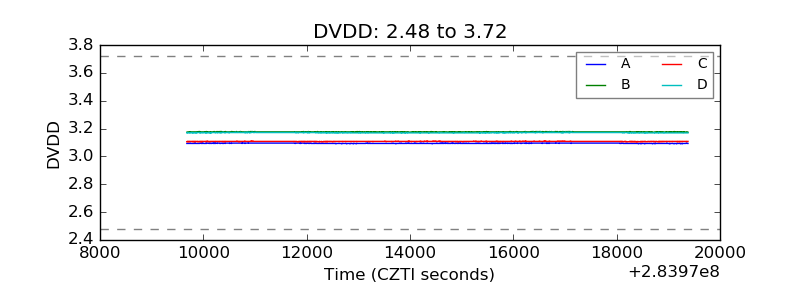 |
| Temperature 1 |  |
| Veto HV Monitor | 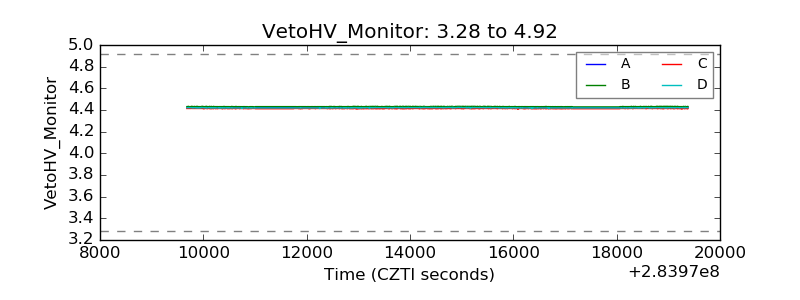 |
| Veto LLD |  |
| Alpha Counter | 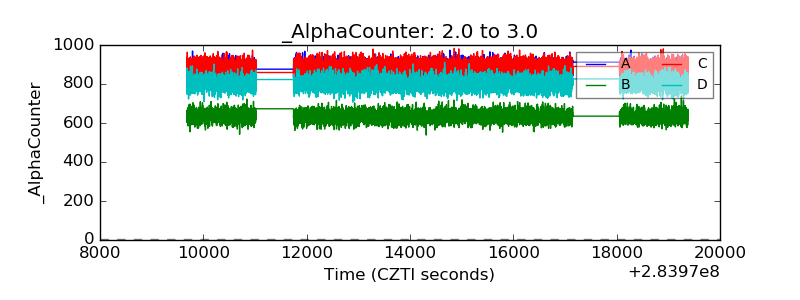 |
| _CPM_Rate | 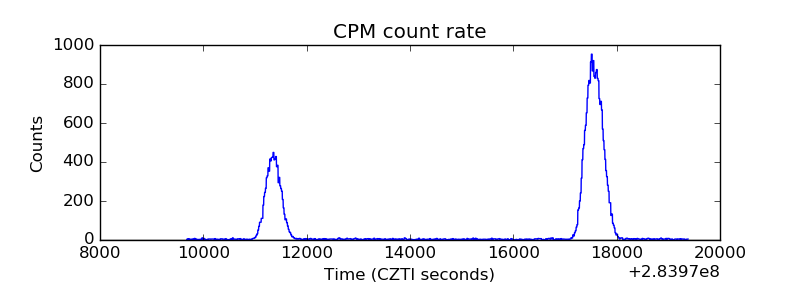 |
| CZT Counter | 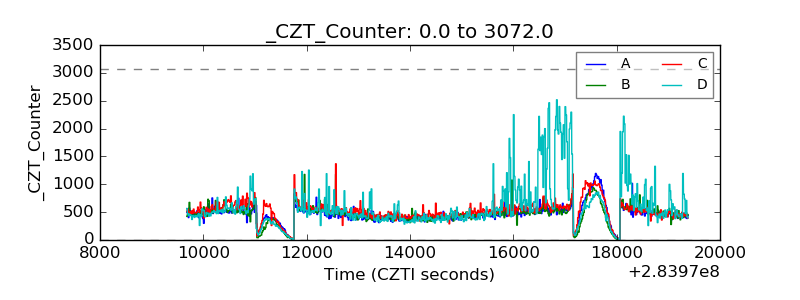 |
| +2.5 Volts monitor |  |
| +5 Volts monitor |  |
| _ROLL_ROT | 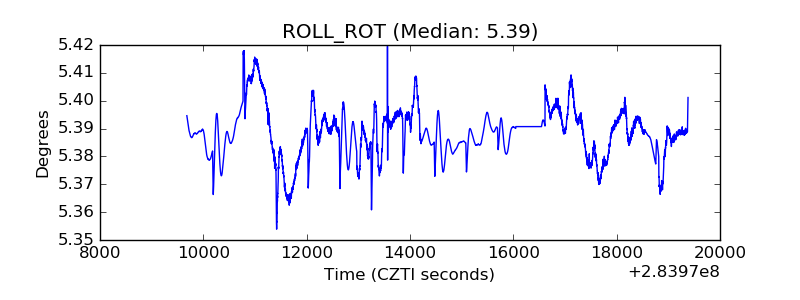 |
| _Roll_DEC | 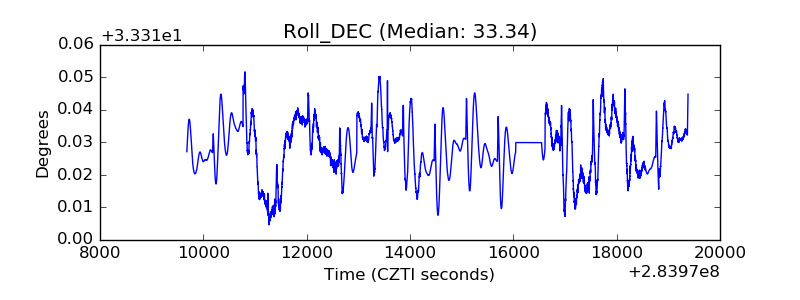 |
| _Roll_RA | 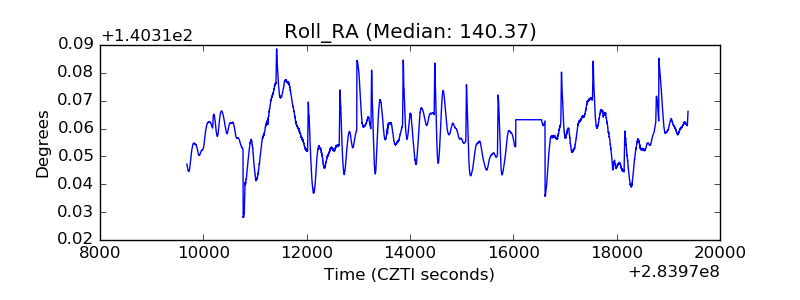 |
| Veto Counter | 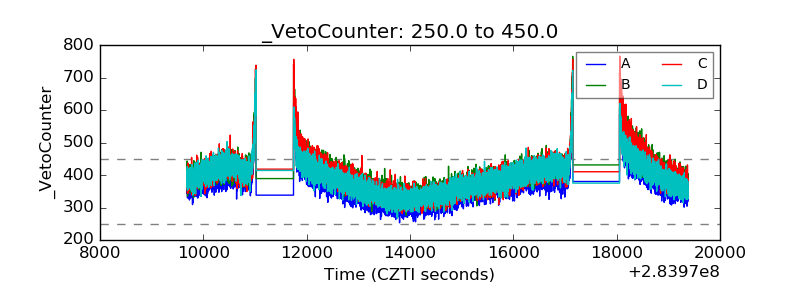 |