| Param | Original file | Final file |
|---|---|---|
| Filename | modeM0/AS1T03_071T01_9000002610_17627cztM0_level2.evt | modeM0/AS1T03_071T01_9000002610_17627cztM0_level2_quad_clean.evt |
| Size (bytes) | 444,286,080 | 90,057,600 |
| Size | 423.7 MB | 85.9 MB |
| Events in quadrant A | 3,143,688 | 581,989 |
| Events in quadrant B | 3,120,570 | 591,001 |
| Events in quadrant C | 3,298,719 | 558,010 |
| Events in quadrant D | 3,454,350 | 547,021 |
| Mode M0 | |||
|---|---|---|---|
| Quadrant | BADHDUFLAG | Total packets | Discarded packets |
| A | 0 | 13573 | 2 |
| B | 0 | 13423 | 2 |
| C | 0 | 13645 | 2 |
| D | 0 | 14736 | 2 |
| Mode SS | |||
|---|---|---|---|
| Quadrant | BADHDUFLAG | Total packets | Discarded packets |
| A | 0 | 132 | 0 |
| B | 0 | 132 | 0 |
| C | 0 | 132 | 0 |
| D | 0 | 132 | 0 |
| Mode M9 | |||
|---|---|---|---|
| Quadrant | BADHDUFLAG | Total packets | Discarded packets |
| A | 0 | 22 | 0 |
| B | 0 | 22 | 0 |
| C | 0 | 22 | 0 |
| D | 0 | 22 | 0 |
| Quadrant | Total seconds | Saturated seconds | Saturation percentage |
|---|---|---|---|
| A | 6443 | 27 | 0.419059% |
| B | 6444 | 47 | 0.729361% |
| C | 6444 | 78 | 1.210428% |
| D | 6443 | 139 | 2.157380% |
Noise dominated data is calculated using 1-second bins in cleaned event files. If a bin has >2000 counts, and if more than 50% of those come from <1% of pixels, then it is considered to be noise-dominated and hence unusable.
| Quadrant | # 1 sec bins | Bins with >0 counts | Bins with >2000 counts | High rate bins dominated by noise | Noise dominated (total time) | Noise dominated (detector-on time) | Marked lightcurve |
|---|---|---|---|---|---|---|---|
| A | 8623 | 6445 | 2 | 2 | 0.02% | 0.03% | 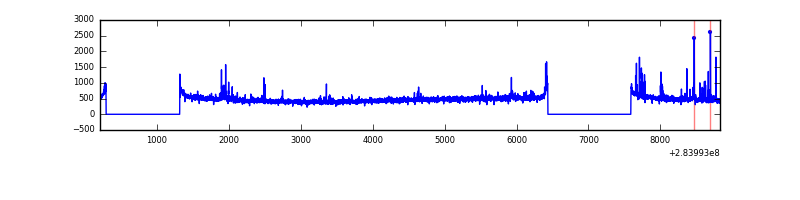 |
| B | 8624 | 6446 | 0 | 0 | 0.00% | 0.00% |  |
| C | 8624 | 6446 | 0 | 0 | 0.00% | 0.00% | 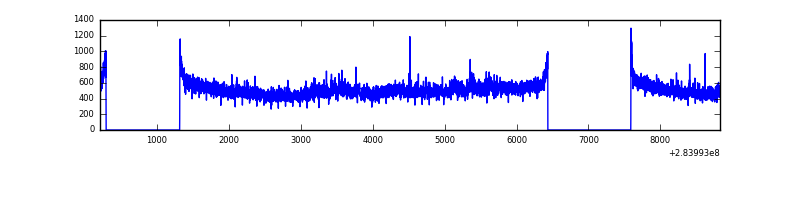 |
| D | 8623 | 6445 | 87 | 87 | 1.01% | 1.35% | 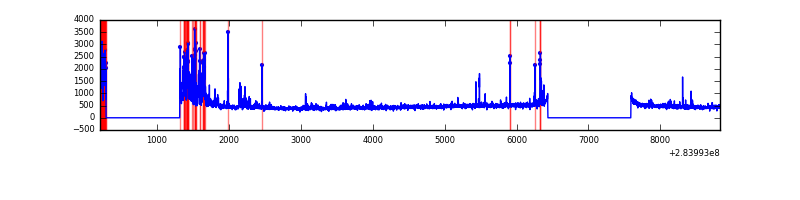 |
Top three noisy pixels from each quadrant. If the there are fewer than three noisy pixels in the level2.evt file, extra rows are filled as -1
| Pixel properties | Quadrant properties | ||||||
|---|---|---|---|---|---|---|---|
| Quadrant | DetID | PixID | Counts | Sigma | Mean | Median | Sigma |
| A | 14 | 237 | 116476 | 732.98 | 788 | 771 | 157.9 |
| A | 0 | 226 | 7082 | 39.98 | 788 | 771 | 157.9 |
| A | 3 | 137 | 5704 | 31.25 | 788 | 771 | 157.9 |
| B | 0 | 189 | 21460 | 136.57 | 791 | 773 | 151.5 |
| B | 12 | 111 | 17592 | 111.04 | 791 | 773 | 151.5 |
| B | 11 | 111 | 15302 | 95.92 | 791 | 773 | 151.5 |
| C | 3 | 233 | 231668 | 1319.8 | 749 | 753 | 175.0 |
| C | 14 | 238 | 117867 | 669.37 | 749 | 753 | 175.0 |
| C | 0 | 207 | 16674 | 91.0 | 749 | 753 | 175.0 |
| D | 1 | 52 | 420082 | 2310.49 | 751 | 730 | 181.5 |
| D | 13 | 189 | 100562 | 550.04 | 751 | 730 | 181.5 |
| D | 4 | 239 | 44823 | 242.94 | 751 | 730 | 181.5 |
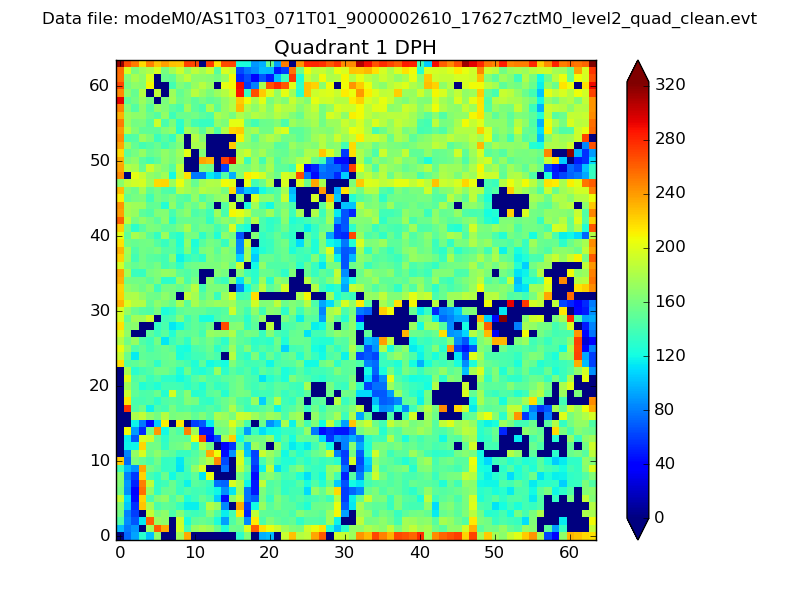
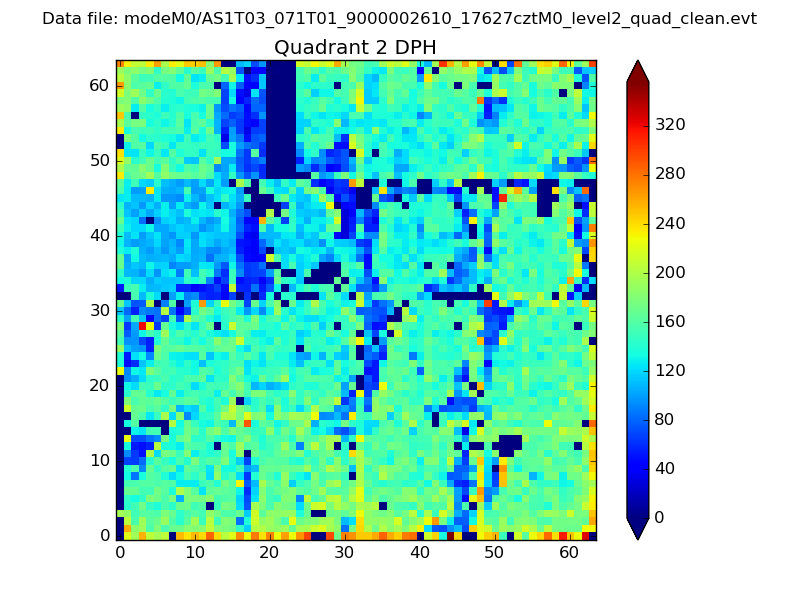
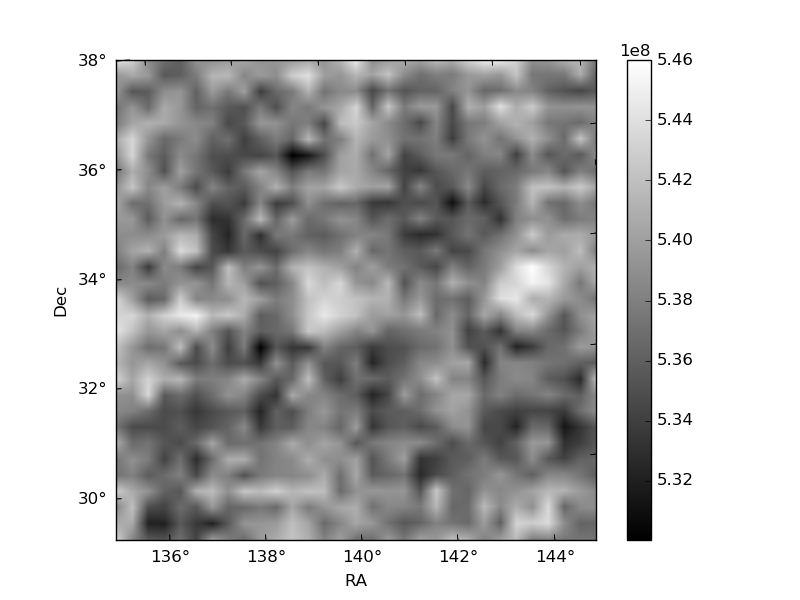
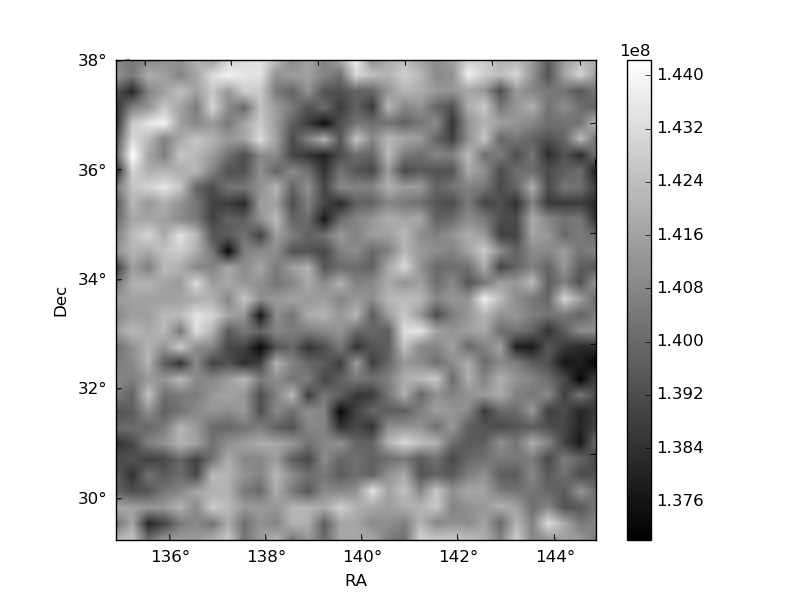
Histogram calculated using DETX and DETY for each event in the final _common_clean file
| Quadrant A | 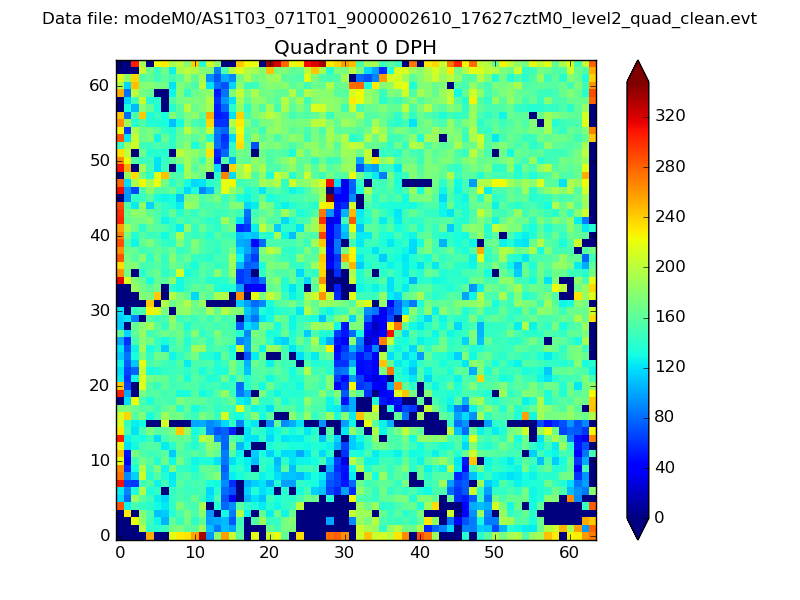 |
 |
Quadrant B |
|---|---|---|---|
| Quadrant D | 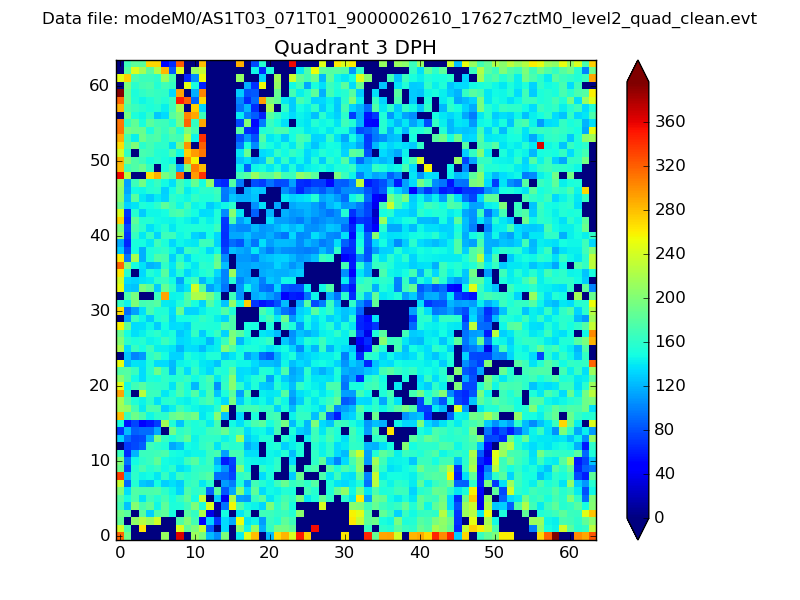 |
 |
Quadrant C |
| Plot type | Count rate plots | Images |
|---|---|---|
| Comparison with Poisson distribution Blue bars denote a histogram of data divided into 1 sec bins. Red curve is a Poisson curve with rate = median count rate of data. |
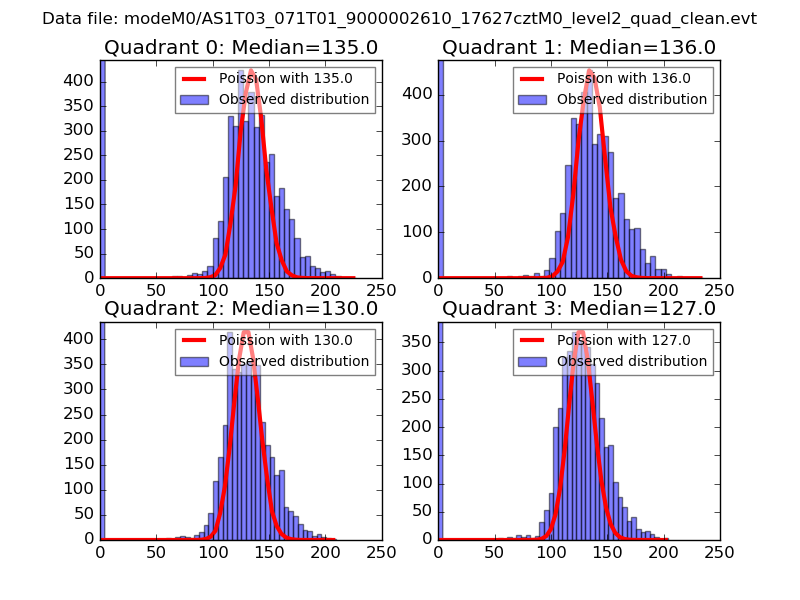 |
 |
| Quadrant-wise count rates Data is divided into 100 sec bins |
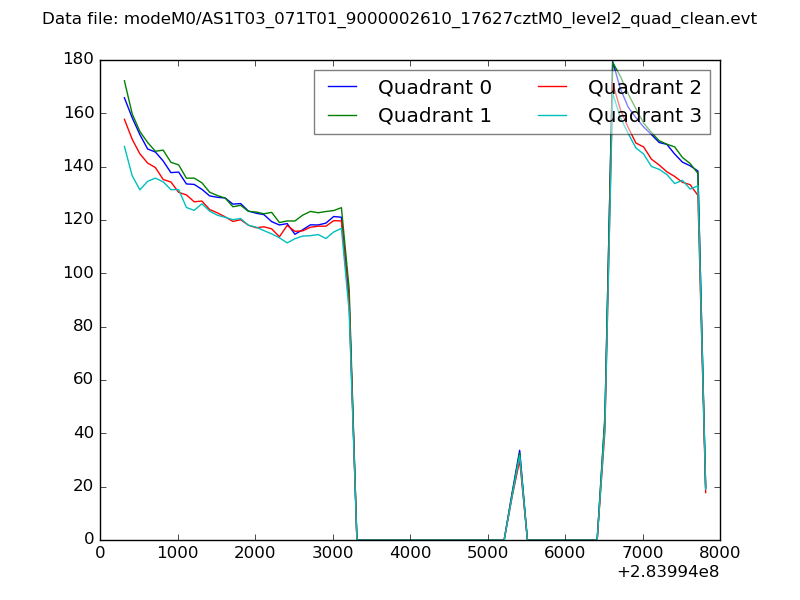 |
|
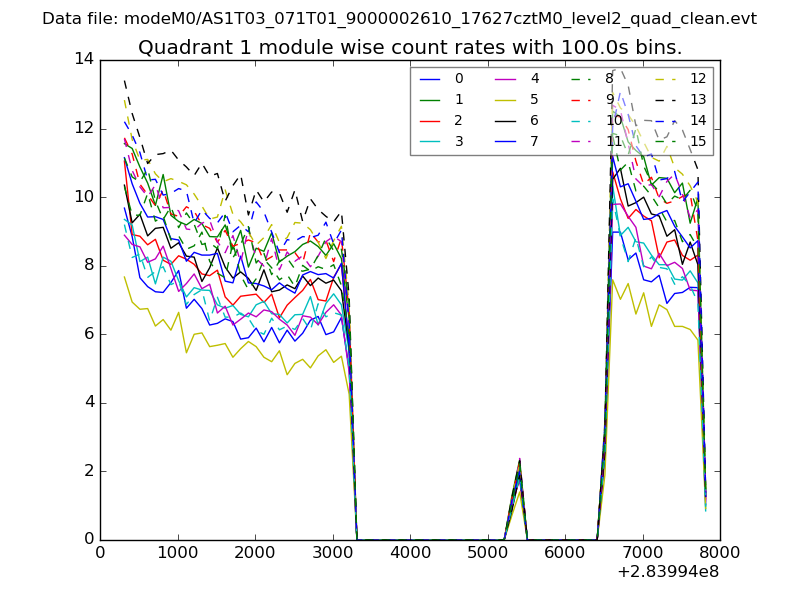
| Module-wise count rates for Quadrant A Data is divided into 100 sec bins |
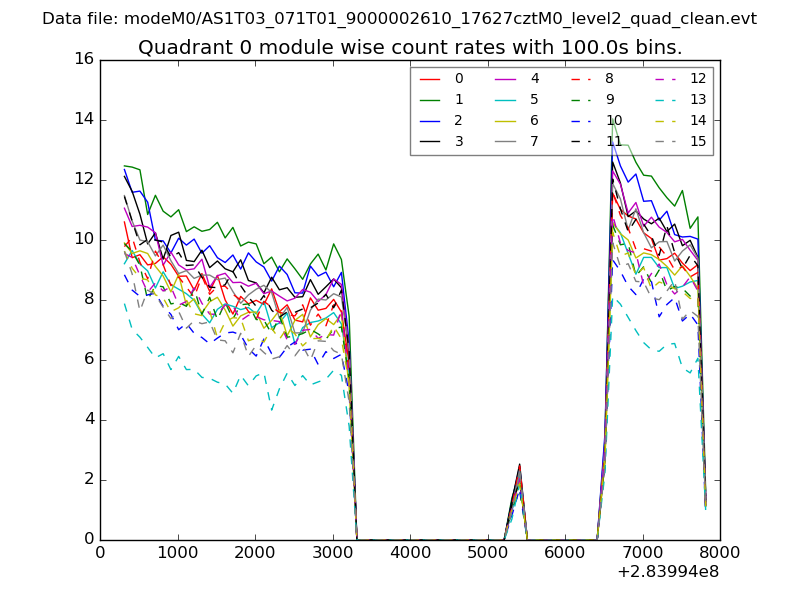 |
 |
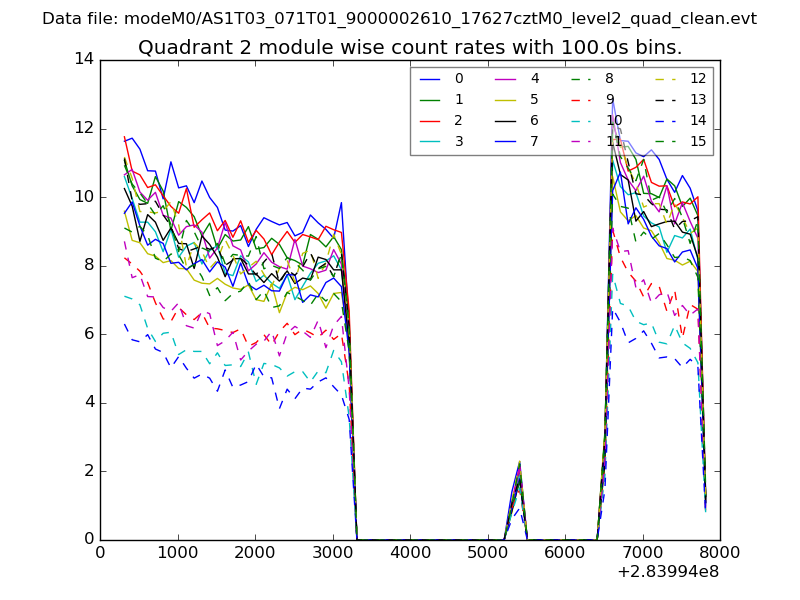
| Module-wise count rates for Quadrant B Data is divided into 100 sec bins |
 |
 |
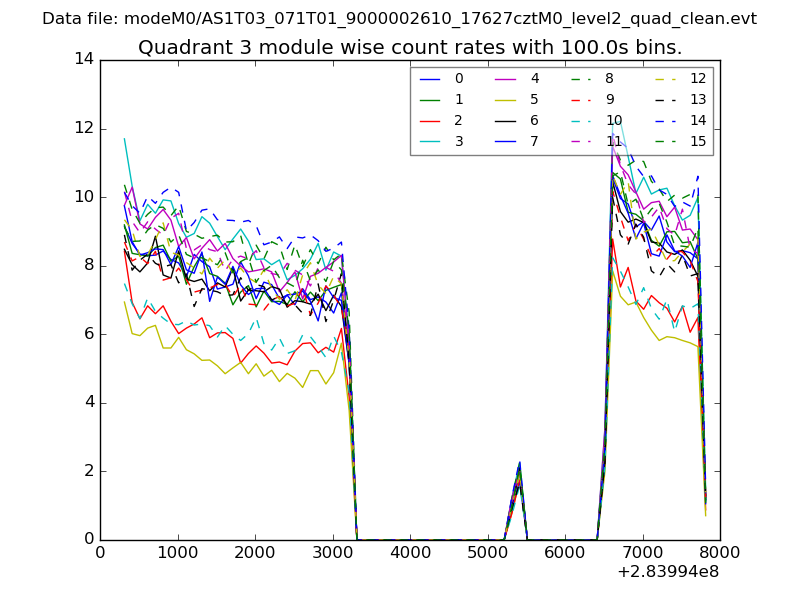
| Module-wise count rates for Quadrant C Data is divided into 100 sec bins |
 |
 |
| Module-wise count rates for Quadrant D Data is divided into 100 sec bins |
 |
 |
| Parameter | Plot |
|---|---|
| CZT HV Monitor | 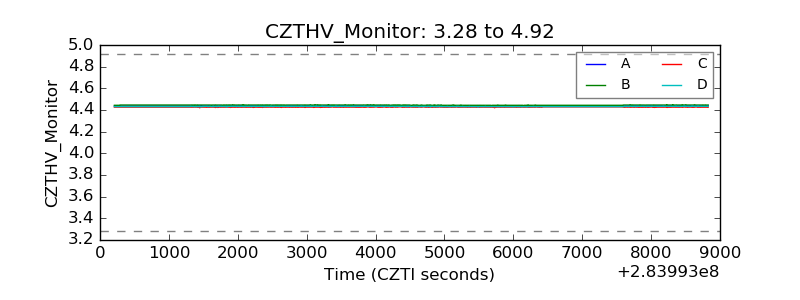 |
| D_VDD | 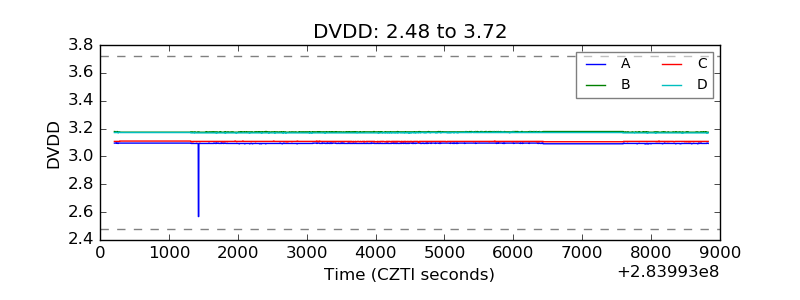 |
| Temperature 1 | 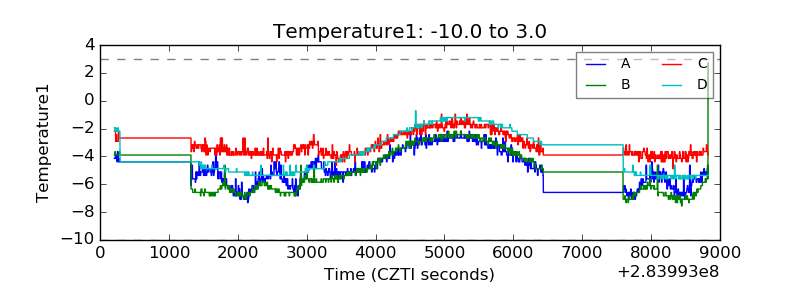 |
| Veto HV Monitor | 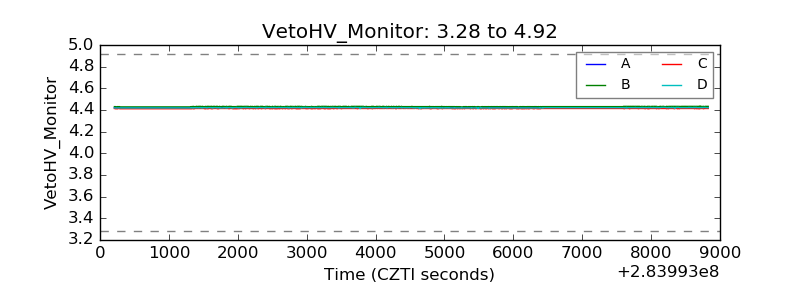 |
| Veto LLD | 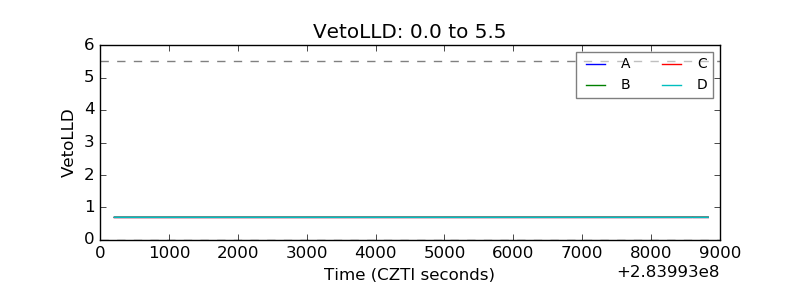 |
| Alpha Counter | 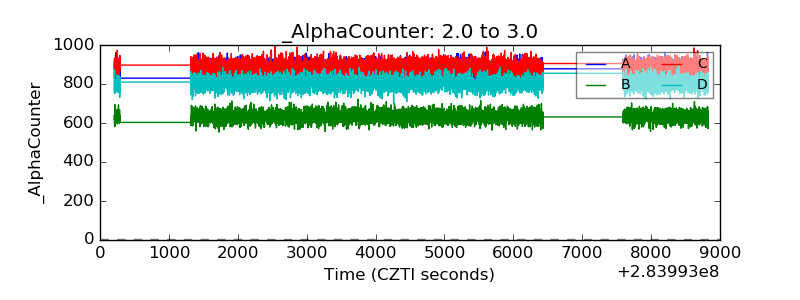 |
| _CPM_Rate | 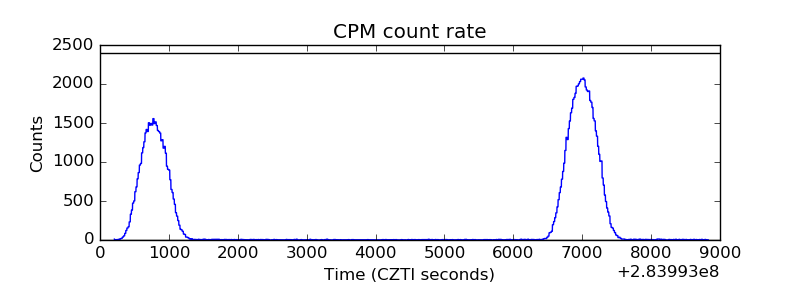 |
| CZT Counter | 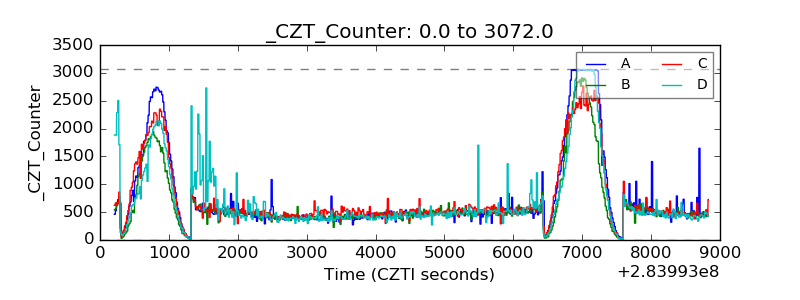 |
| +2.5 Volts monitor |  |
| +5 Volts monitor |  |
| _ROLL_ROT | 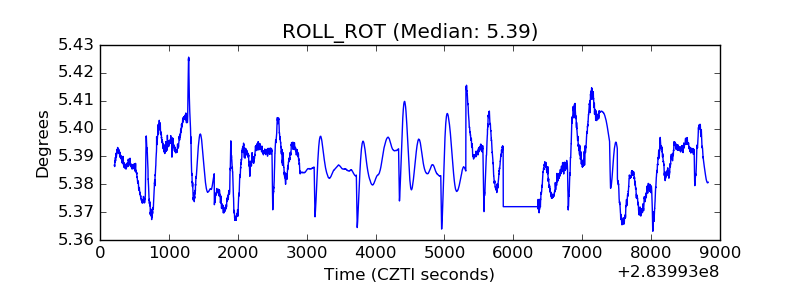 |
| _Roll_DEC | 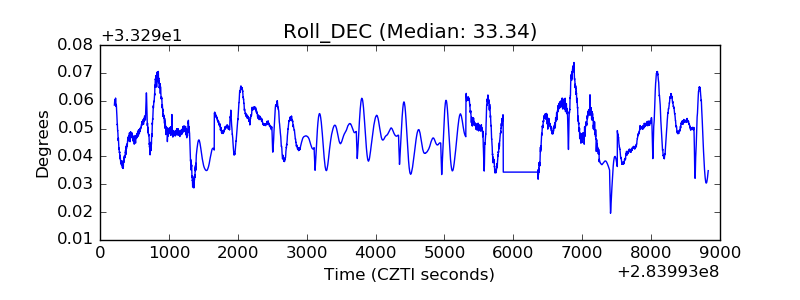 |
| _Roll_RA | 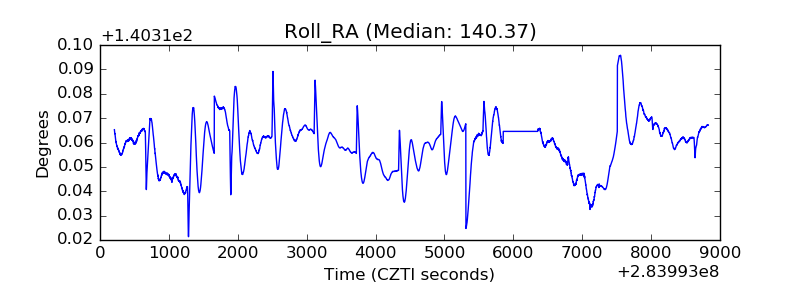 |
| Veto Counter | 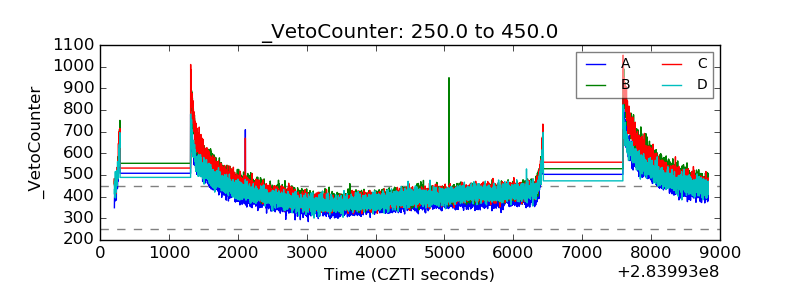 |