| Param | Original file | Final file |
|---|---|---|
| Filename | modeM0/AS1T03_071T01_9000002610_17629cztM0_level2.evt | modeM0/AS1T03_071T01_9000002610_17629cztM0_level2_quad_clean.evt |
| Size (bytes) | 580,507,200 | 97,084,800 |
| Size | 553.6 MB | 92.6 MB |
| Events in quadrant A | 3,740,532 | 641,351 |
| Events in quadrant B | 3,236,932 | 654,235 |
| Events in quadrant C | 3,274,557 | 612,577 |
| Events in quadrant D | 6,898,744 | 588,333 |
| Mode M0 | |||
|---|---|---|---|
| Quadrant | BADHDUFLAG | Total packets | Discarded packets |
| A | 0 | 14995 | 1 |
| B | 0 | 13335 | 1 |
| C | 0 | 13363 | 1 |
| D | 0 | 24904 | 1 |
| Mode SS | |||
|---|---|---|---|
| Quadrant | BADHDUFLAG | Total packets | Discarded packets |
| A | 0 | 130 | 0 |
| B | 0 | 130 | 0 |
| C | 0 | 130 | 0 |
| D | 0 | 130 | 0 |
| Mode M9 | |||
|---|---|---|---|
| Quadrant | BADHDUFLAG | Total packets | Discarded packets |
| A | 0 | 12 | 0 |
| B | 0 | 12 | 0 |
| C | 0 | 12 | 0 |
| D | 0 | 12 | 0 |
| Quadrant | Total seconds | Saturated seconds | Saturation percentage |
|---|---|---|---|
| A | 6355 | 137 | 2.155783% |
| B | 6355 | 53 | 0.833989% |
| C | 6356 | 68 | 1.069855% |
| D | 6356 | 209 | 3.288232% |
Noise dominated data is calculated using 1-second bins in cleaned event files. If a bin has >2000 counts, and if more than 50% of those come from <1% of pixels, then it is considered to be noise-dominated and hence unusable.
| Quadrant | # 1 sec bins | Bins with >0 counts | Bins with >2000 counts | High rate bins dominated by noise | Noise dominated (total time) | Noise dominated (detector-on time) | Marked lightcurve |
|---|---|---|---|---|---|---|---|
| A | 7630 | 6356 | 75 | 75 | 0.98% | 1.18% | 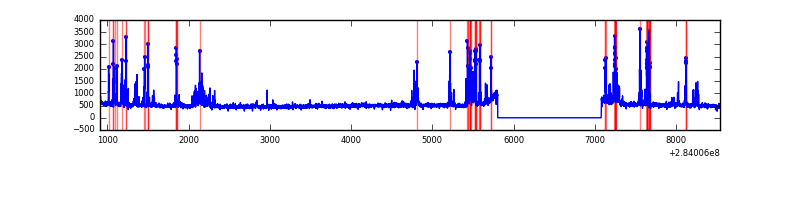 |
| B | 7630 | 6355 | 1 | 1 | 0.01% | 0.02% |  |
| C | 7631 | 6357 | 0 | 0 | 0.00% | 0.00% | 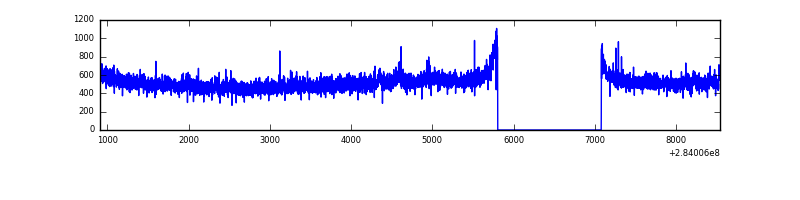 |
| D | 7631 | 6357 | 86 | 86 | 1.13% | 1.35% | 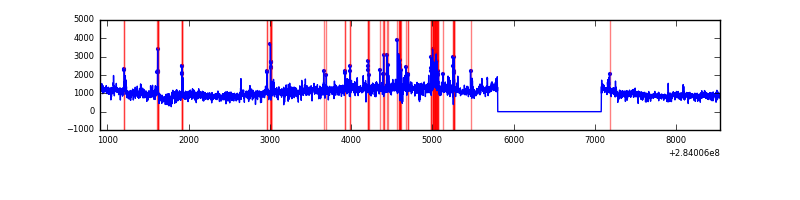 |
Top three noisy pixels from each quadrant. If the there are fewer than three noisy pixels in the level2.evt file, extra rows are filled as -1
| Pixel properties | Quadrant properties | ||||||
|---|---|---|---|---|---|---|---|
| Quadrant | DetID | PixID | Counts | Sigma | Mean | Median | Sigma |
| A | 14 | 237 | 581242 | 3545.51 | 822 | 809 | 163.7 |
| A | 0 | 226 | 7162 | 38.8 | 822 | 809 | 163.7 |
| A | 12 | 194 | 6091 | 32.26 | 822 | 809 | 163.7 |
| B | 0 | 230 | 42513 | 274.56 | 813 | 798 | 151.9 |
| B | 12 | 111 | 17404 | 109.3 | 813 | 798 | 151.9 |
| B | 0 | 189 | 16147 | 101.02 | 813 | 798 | 151.9 |
| C | 14 | 238 | 123087 | 686.85 | 773 | 780 | 178.1 |
| C | 3 | 233 | 93751 | 522.1 | 773 | 780 | 178.1 |
| C | 0 | 207 | 20640 | 111.53 | 773 | 780 | 178.1 |
| D | 12 | 144 | 3656820 | 19553.49 | 781 | 758 | 187.0 |
| D | 13 | 189 | 207512 | 1105.77 | 781 | 758 | 187.0 |
| D | 1 | 52 | 41410 | 217.41 | 781 | 758 | 187.0 |
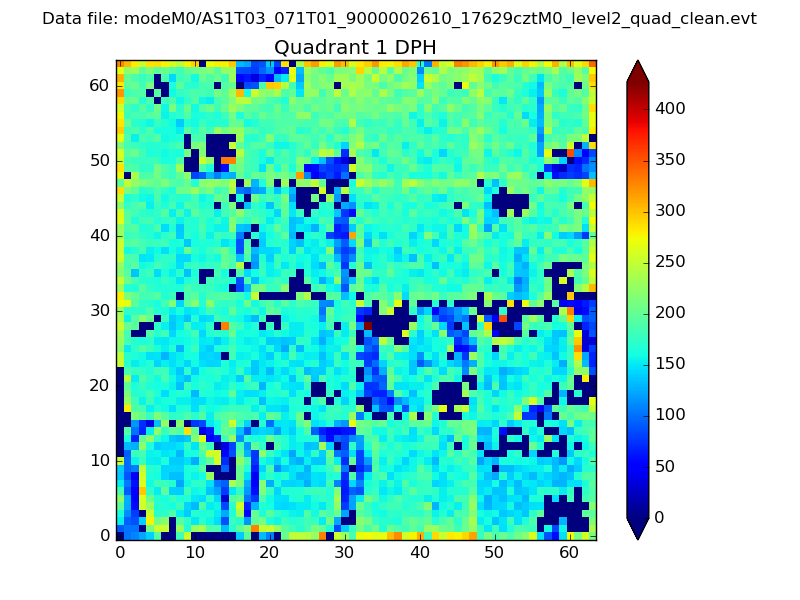
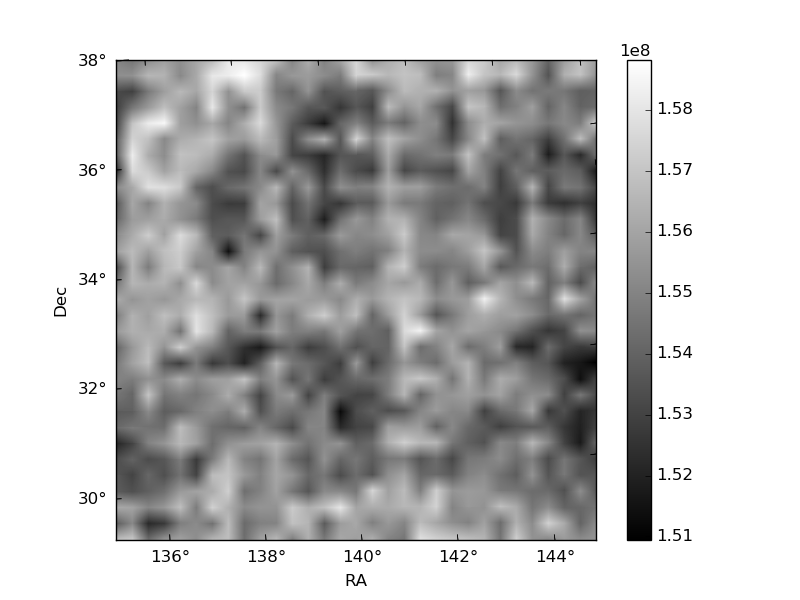
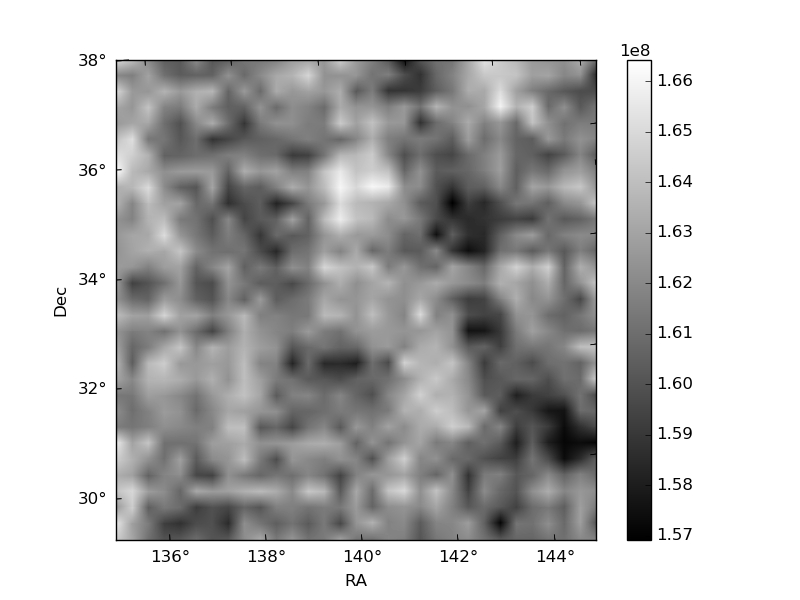
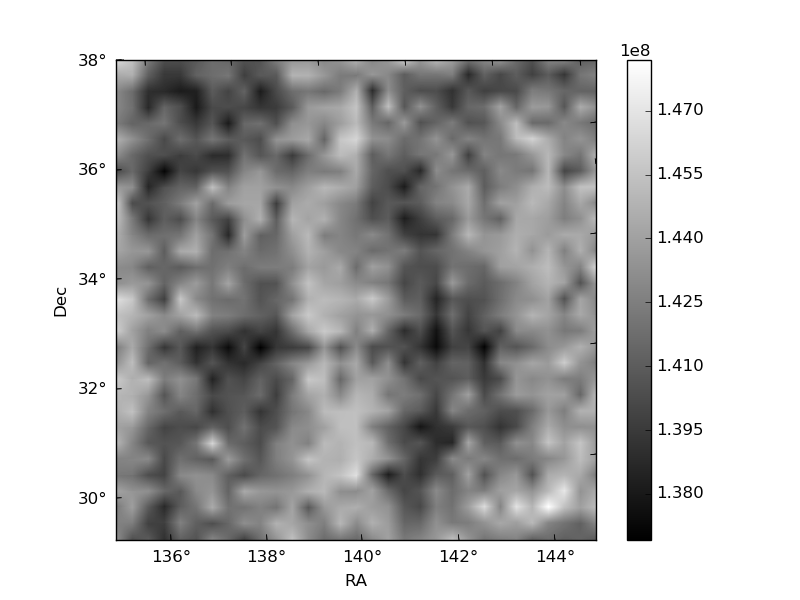
Histogram calculated using DETX and DETY for each event in the final _common_clean file
| Quadrant A | 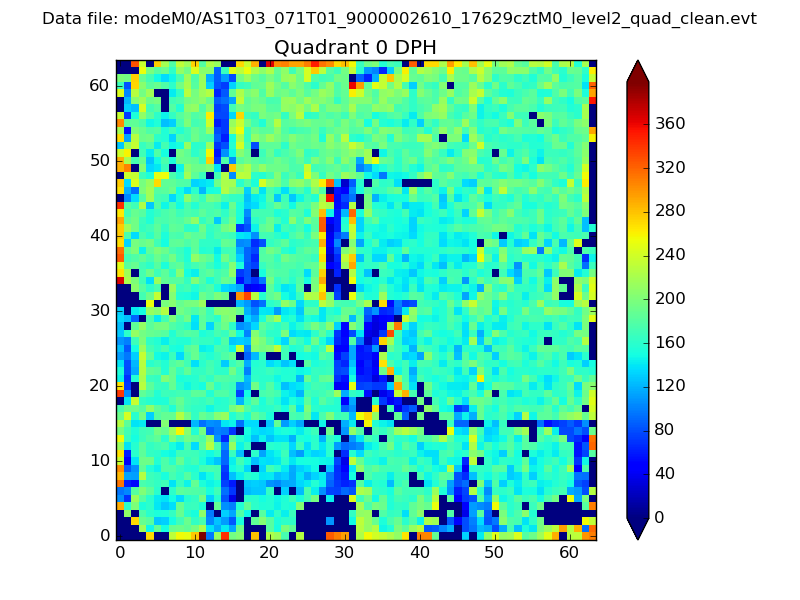 |
 |
Quadrant B |
|---|---|---|---|
| Quadrant D | 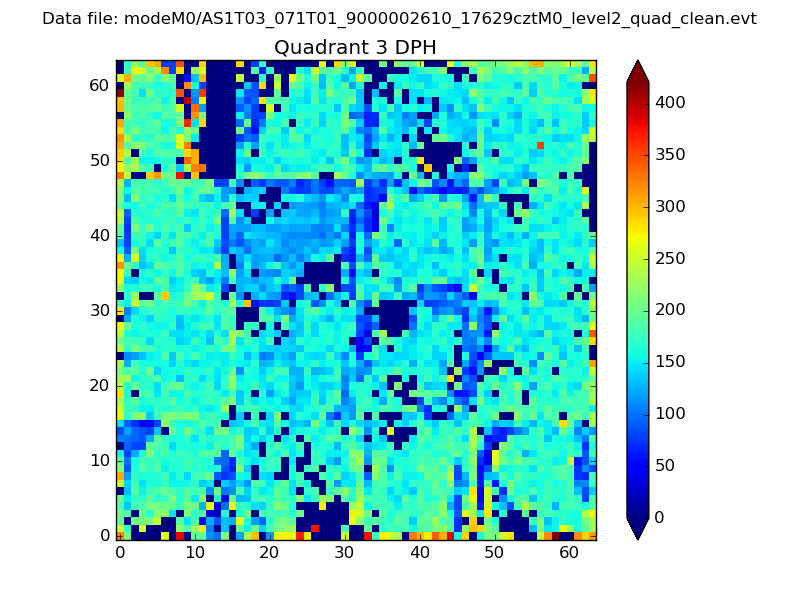 |
 |
Quadrant C |
| Plot type | Count rate plots | Images |
|---|---|---|
| Comparison with Poisson distribution Blue bars denote a histogram of data divided into 1 sec bins. Red curve is a Poisson curve with rate = median count rate of data. |
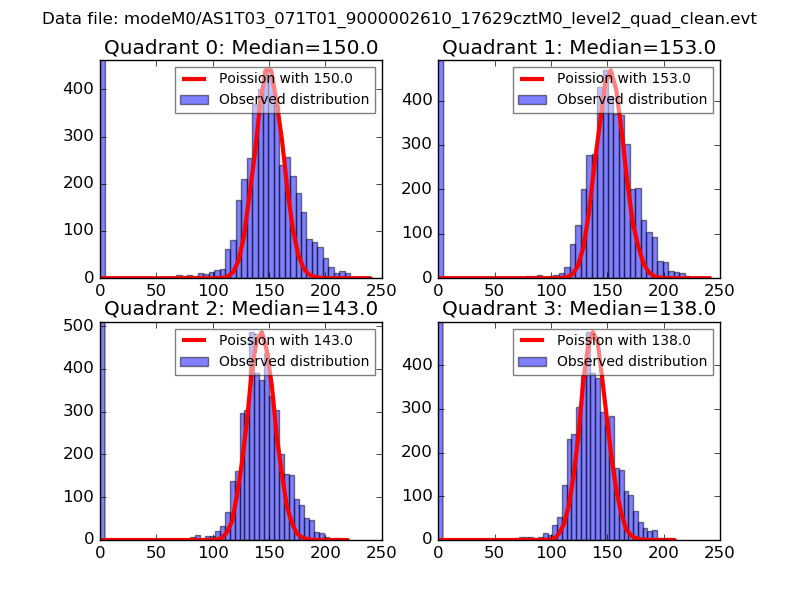 |
 |
| Quadrant-wise count rates Data is divided into 100 sec bins |
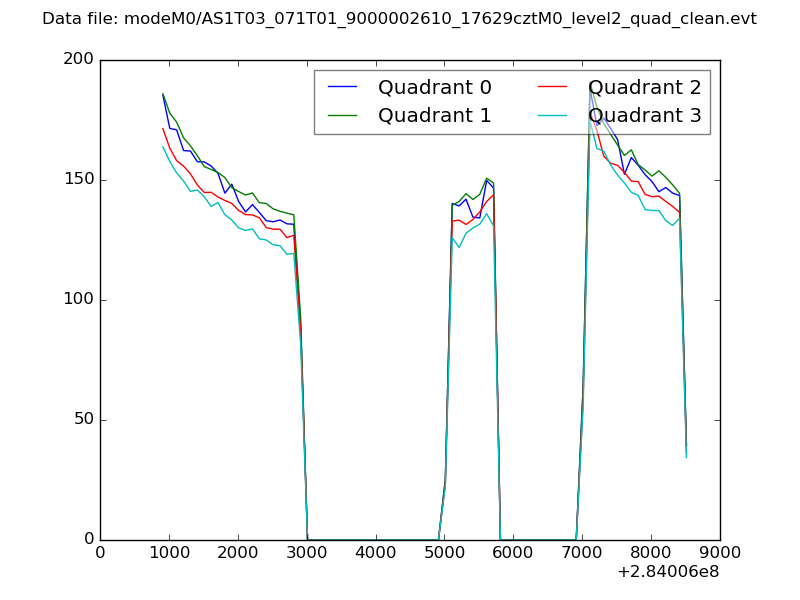 |
|
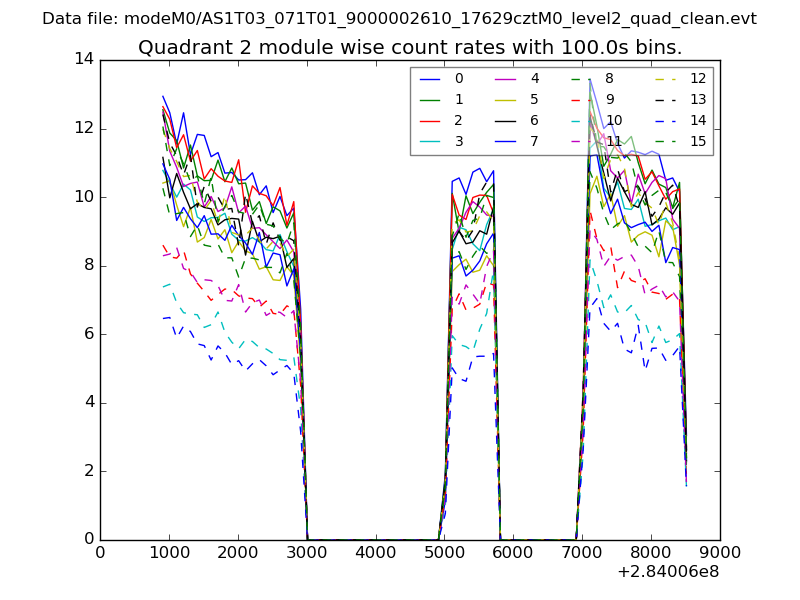
| Module-wise count rates for Quadrant A Data is divided into 100 sec bins |
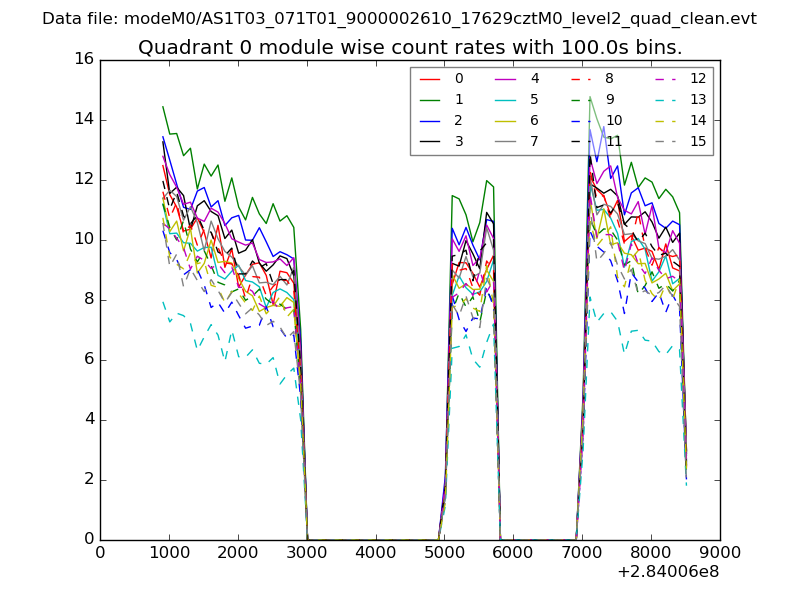 |
 |
| Module-wise count rates for Quadrant B Data is divided into 100 sec bins |
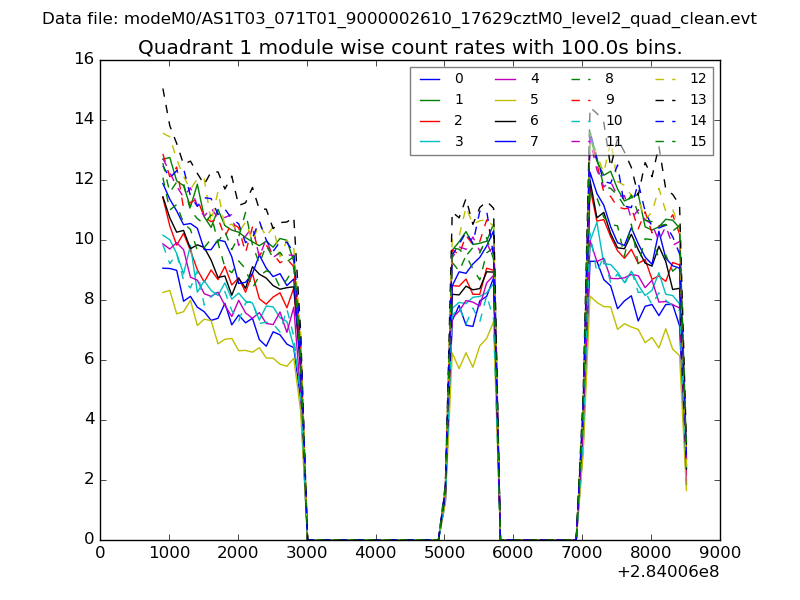 |
 |
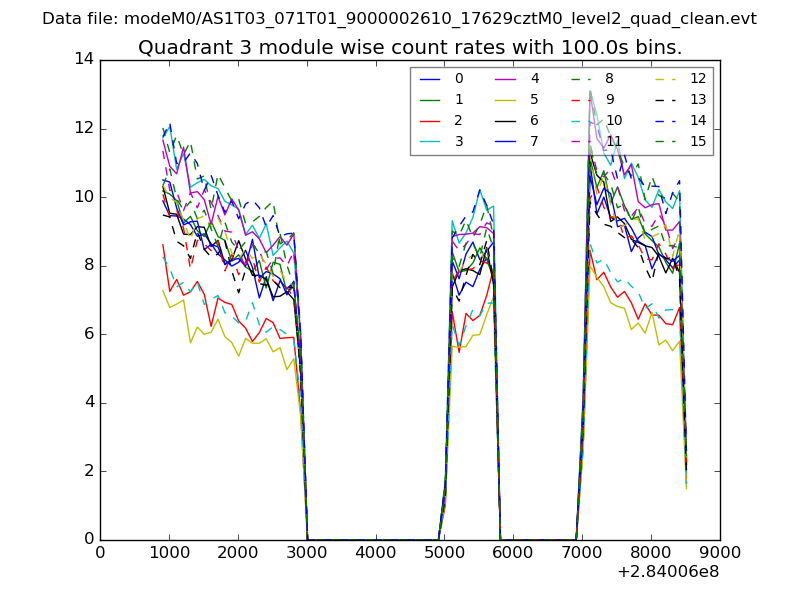
| Module-wise count rates for Quadrant C Data is divided into 100 sec bins |
 |
 |
| Module-wise count rates for Quadrant D Data is divided into 100 sec bins |
 |
 |
| Parameter | Plot |
|---|---|
| CZT HV Monitor | 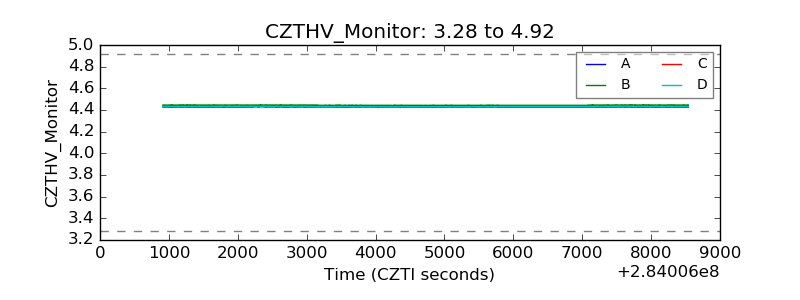 |
| D_VDD | 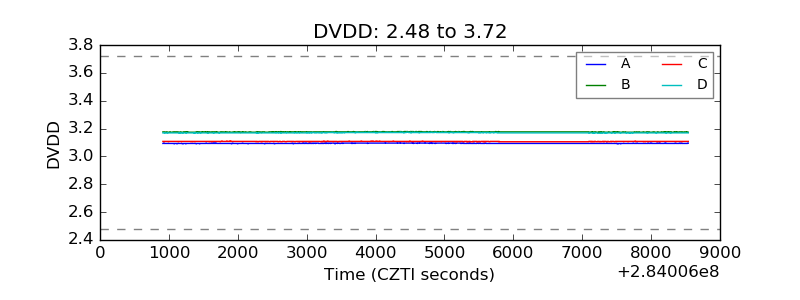 |
| Temperature 1 | 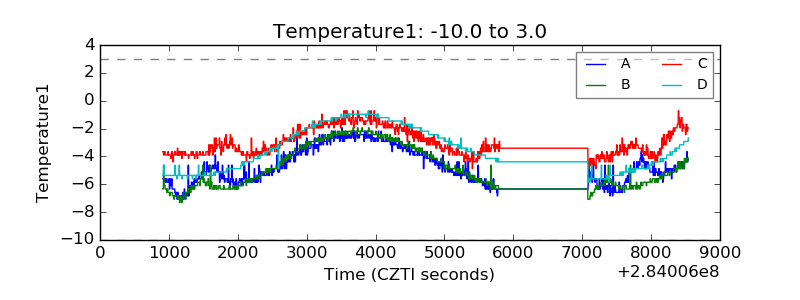 |
| Veto HV Monitor |  |
| Veto LLD | 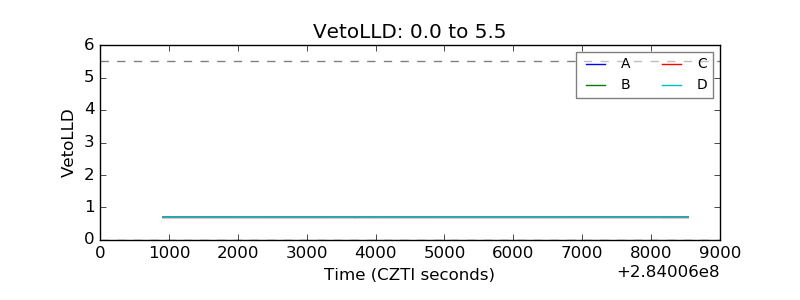 |
| Alpha Counter | 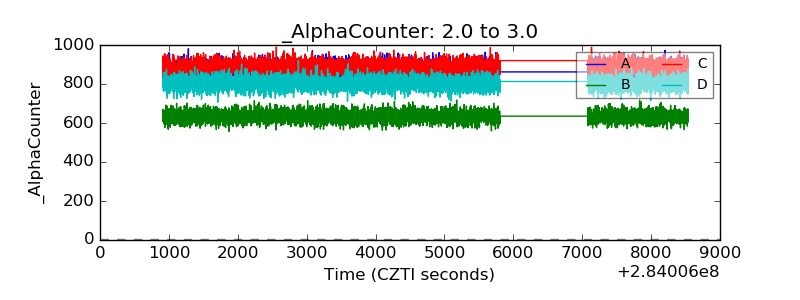 |
| _CPM_Rate | 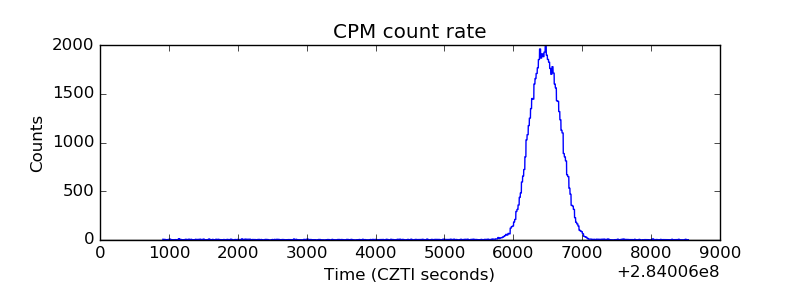 |
| CZT Counter |  |
| +2.5 Volts monitor |  |
| +5 Volts monitor |  |
| _ROLL_ROT | 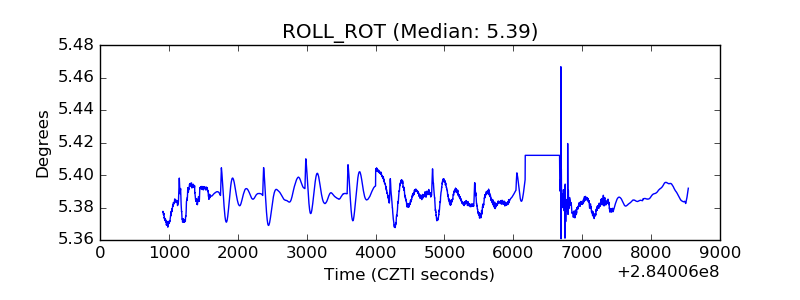 |
| _Roll_DEC | 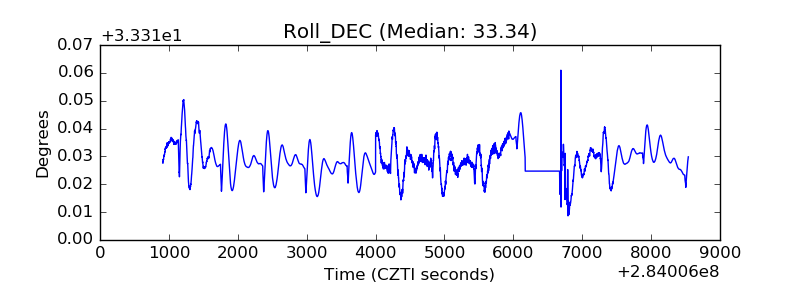 |
| _Roll_RA | 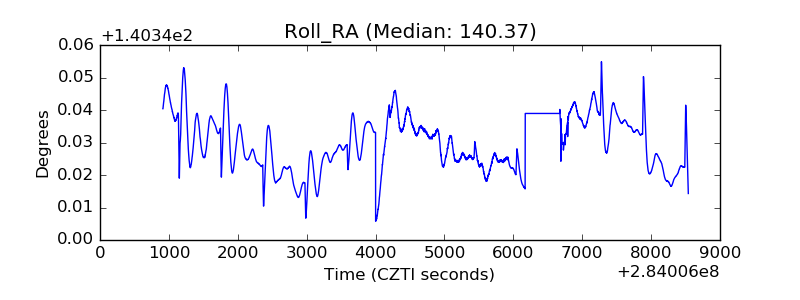 |
| Veto Counter | 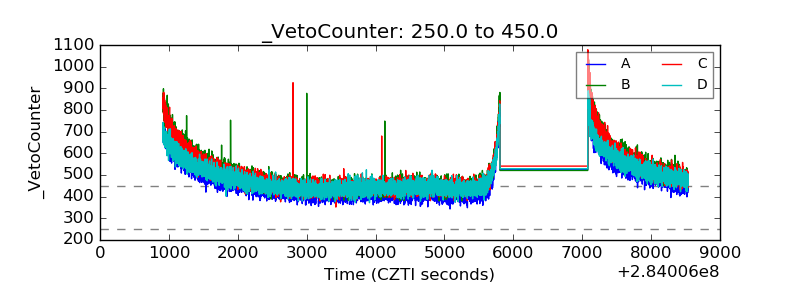 |