| Param | Original file | Final file |
|---|---|---|
| Filename | modeM0/AS1T03_071T01_9000002610_17630cztM0_level2.evt | modeM0/AS1T03_071T01_9000002610_17630cztM0_level2_quad_clean.evt |
| Size (bytes) | 526,921,920 | 96,134,400 |
| Size | 502.5 MB | 91.7 MB |
| Events in quadrant A | 3,570,868 | 635,032 |
| Events in quadrant B | 3,245,031 | 640,276 |
| Events in quadrant C | 3,740,656 | 604,766 |
| Events in quadrant D | 4,975,458 | 592,560 |
| Mode M0 | |||
|---|---|---|---|
| Quadrant | BADHDUFLAG | Total packets | Discarded packets |
| A | 0 | 14319 | 2 |
| B | 0 | 13250 | 2 |
| C | 0 | 14867 | 2 |
| D | 0 | 18951 | 2 |
| Mode SS | |||
|---|---|---|---|
| Quadrant | BADHDUFLAG | Total packets | Discarded packets |
| A | 0 | 128 | 0 |
| B | 0 | 128 | 0 |
| C | 0 | 128 | 0 |
| D | 0 | 128 | 0 |
| Mode M9 | |||
|---|---|---|---|
| Quadrant | BADHDUFLAG | Total packets | Discarded packets |
| A | 0 | 16 | 0 |
| B | 0 | 17 | 0 |
| C | 0 | 17 | 0 |
| D | 0 | 17 | 0 |
| Quadrant | Total seconds | Saturated seconds | Saturation percentage |
|---|---|---|---|
| A | 6286 | 149 | 2.370347% |
| B | 6286 | 72 | 1.145402% |
| C | 6286 | 92 | 1.463570% |
| D | 6285 | 102 | 1.622912% |
Noise dominated data is calculated using 1-second bins in cleaned event files. If a bin has >2000 counts, and if more than 50% of those come from <1% of pixels, then it is considered to be noise-dominated and hence unusable.
| Quadrant | # 1 sec bins | Bins with >0 counts | Bins with >2000 counts | High rate bins dominated by noise | Noise dominated (total time) | Noise dominated (detector-on time) | Marked lightcurve |
|---|---|---|---|---|---|---|---|
| A | 7581 | 6287 | 61 | 61 | 0.80% | 0.97% | 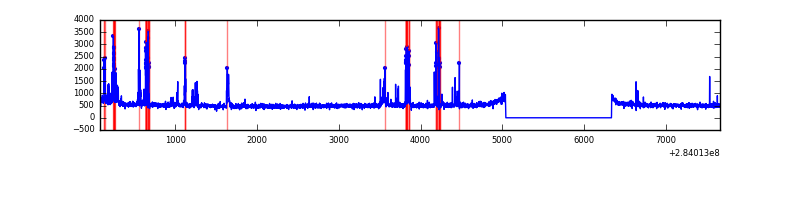 |
| B | 7581 | 6286 | 1 | 1 | 0.01% | 0.02% | 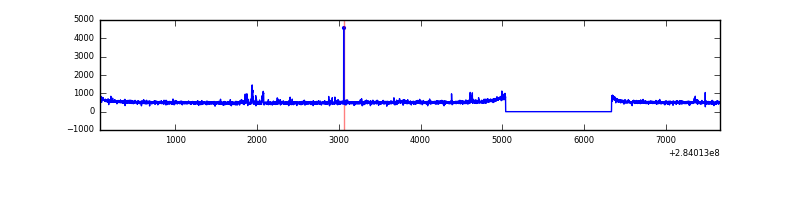 |
| C | 7581 | 6287 | 0 | 0 | 0.00% | 0.00% | 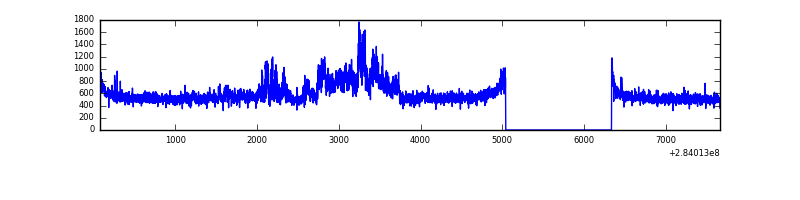 |
| D | 7580 | 6286 | 39 | 39 | 0.51% | 0.62% | 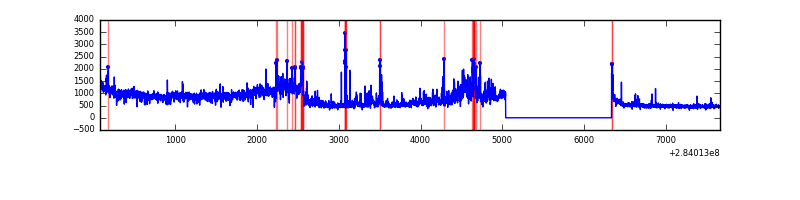 |
Top three noisy pixels from each quadrant. If the there are fewer than three noisy pixels in the level2.evt file, extra rows are filled as -1
| Pixel properties | Quadrant properties | ||||||
|---|---|---|---|---|---|---|---|
| Quadrant | DetID | PixID | Counts | Sigma | Mean | Median | Sigma |
| A | 14 | 237 | 403458 | 2469.16 | 825 | 810 | 163.1 |
| A | 0 | 226 | 7478 | 40.89 | 825 | 810 | 163.1 |
| A | 12 | 194 | 6071 | 32.26 | 825 | 810 | 163.1 |
| B | 0 | 230 | 37180 | 237.16 | 812 | 795 | 153.4 |
| B | 12 | 111 | 17644 | 109.82 | 812 | 795 | 153.4 |
| B | 4 | 80 | 16261 | 100.81 | 812 | 795 | 153.4 |
| C | 3 | 233 | 524887 | 2949.6 | 773 | 778 | 177.7 |
| C | 14 | 238 | 122790 | 686.66 | 773 | 778 | 177.7 |
| C | 8 | 208 | 63438 | 352.64 | 773 | 778 | 177.7 |
| D | 12 | 144 | 1236953 | 6420.56 | 791 | 770 | 192.5 |
| D | 1 | 52 | 565840 | 2934.9 | 791 | 770 | 192.5 |
| D | 13 | 189 | 91084 | 469.08 | 791 | 770 | 192.5 |
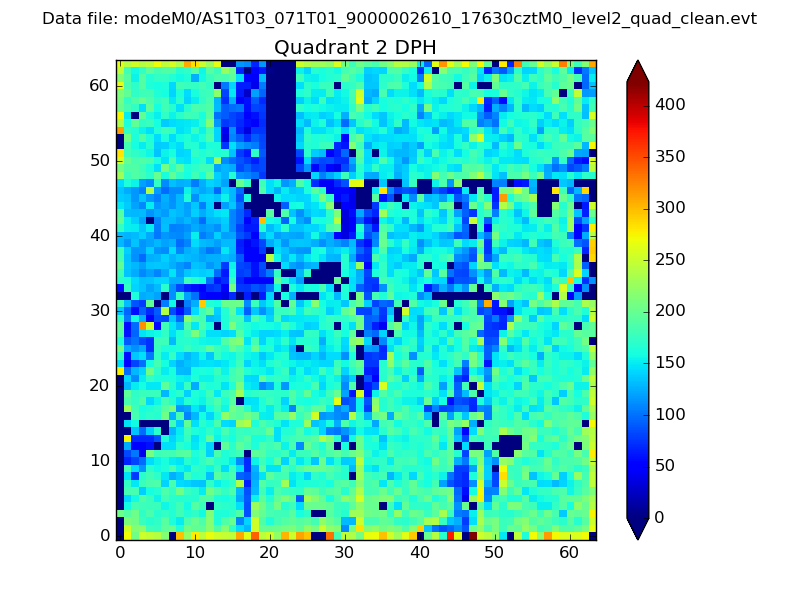
Histogram calculated using DETX and DETY for each event in the final _common_clean file
| Quadrant A | 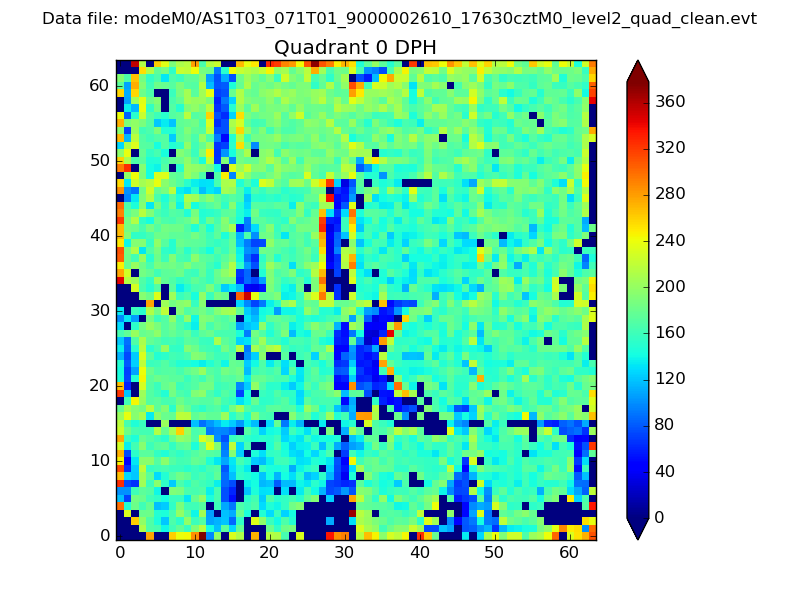 |
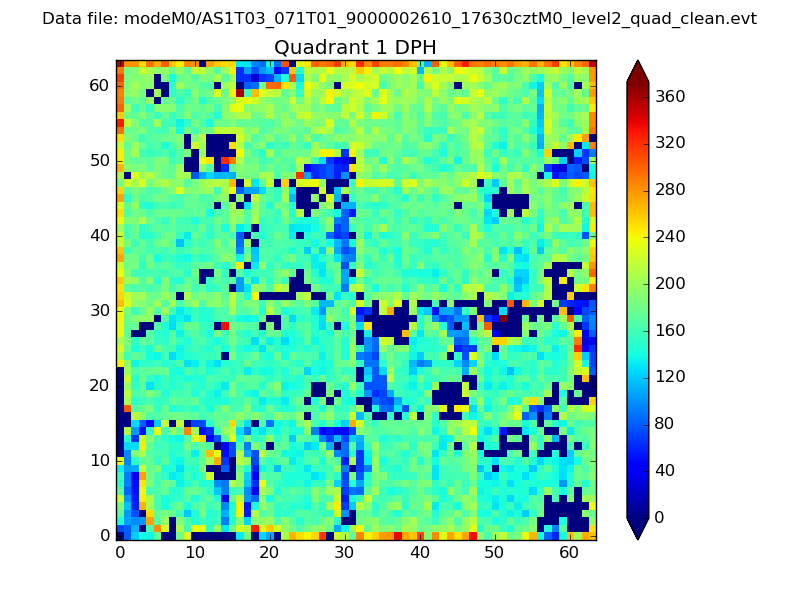 |
Quadrant B |
|---|---|---|---|
| Quadrant D | 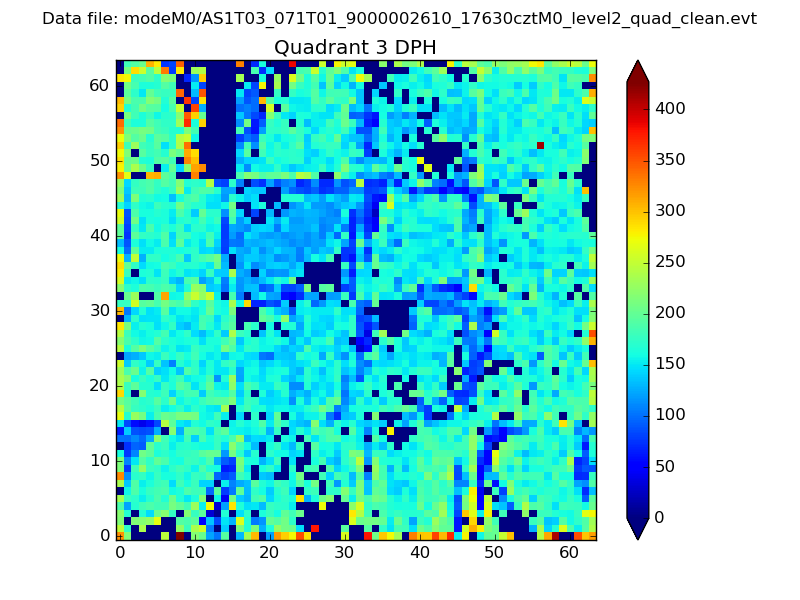 |
 |
Quadrant C |
| Plot type | Count rate plots | Images |
|---|---|---|
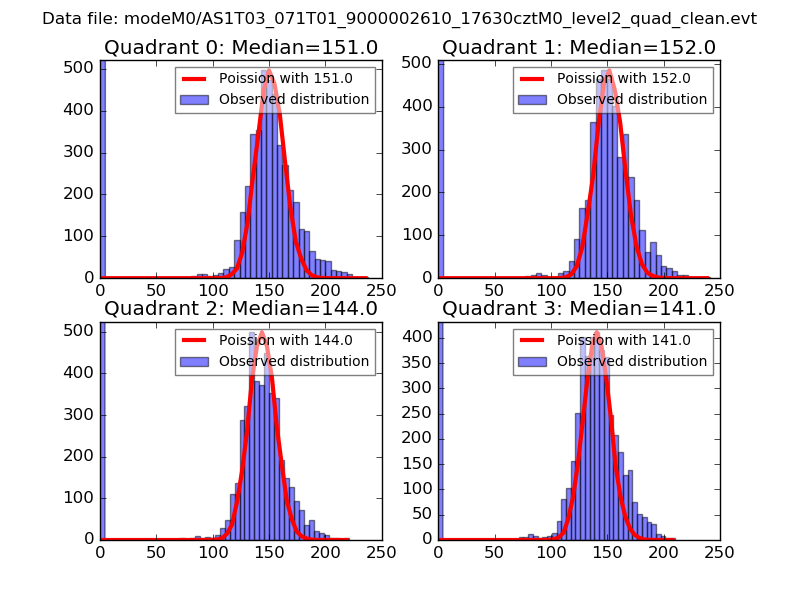
| Comparison with Poisson distribution Blue bars denote a histogram of data divided into 1 sec bins. Red curve is a Poisson curve with rate = median count rate of data. |
 |
 |
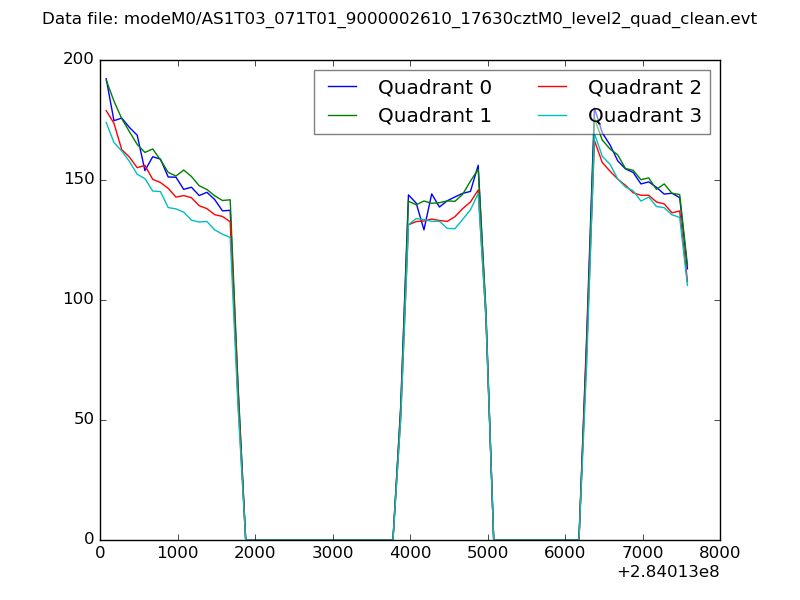
| Quadrant-wise count rates Data is divided into 100 sec bins |
 |
|
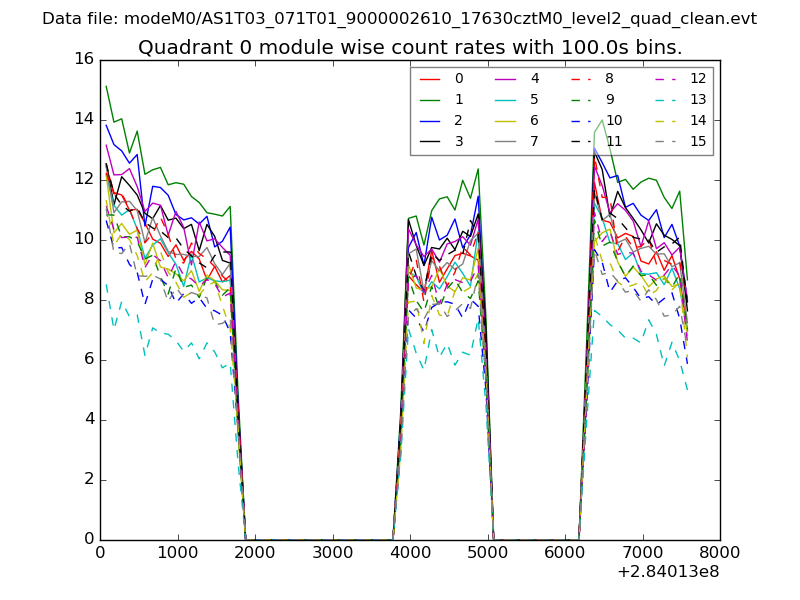
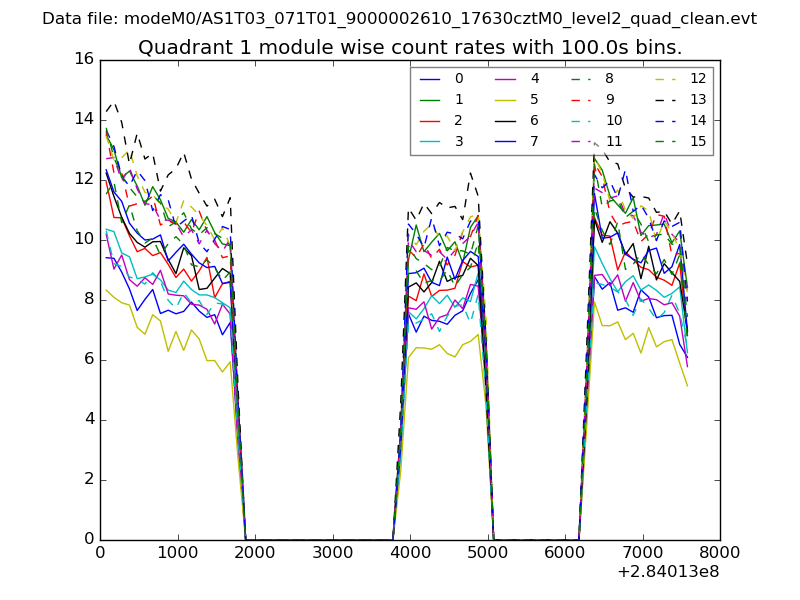
| Module-wise count rates for Quadrant A Data is divided into 100 sec bins |
 |
 |
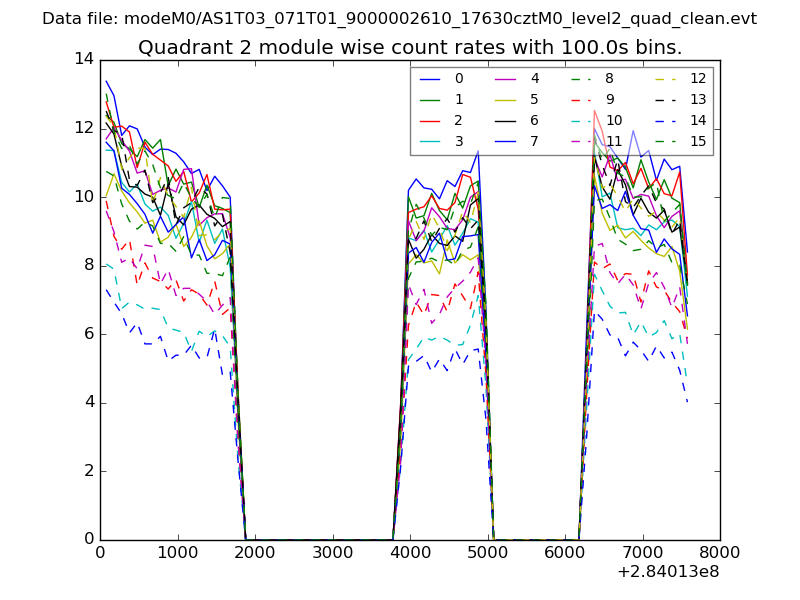
| Module-wise count rates for Quadrant B Data is divided into 100 sec bins |
 |
 |
| Module-wise count rates for Quadrant C Data is divided into 100 sec bins |
 |
 |
| Module-wise count rates for Quadrant D Data is divided into 100 sec bins |
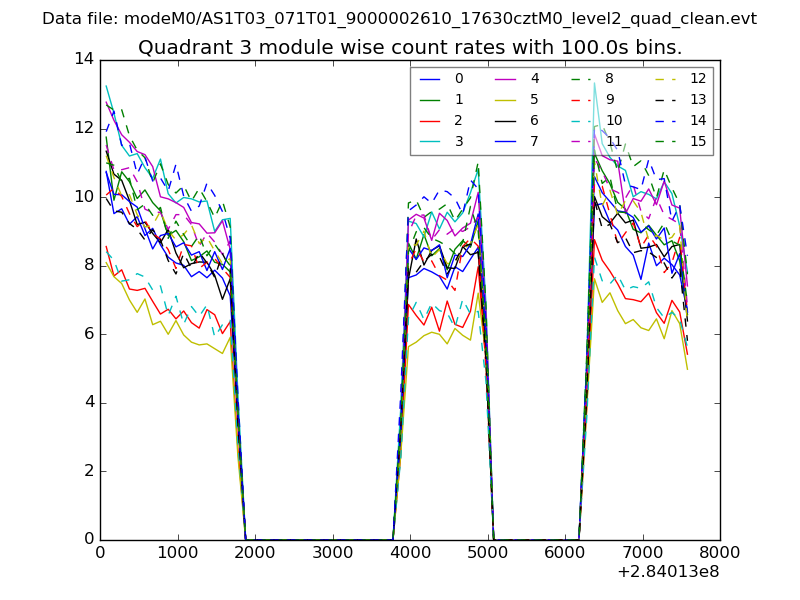 |
 |
| Parameter | Plot |
|---|---|
| CZT HV Monitor | 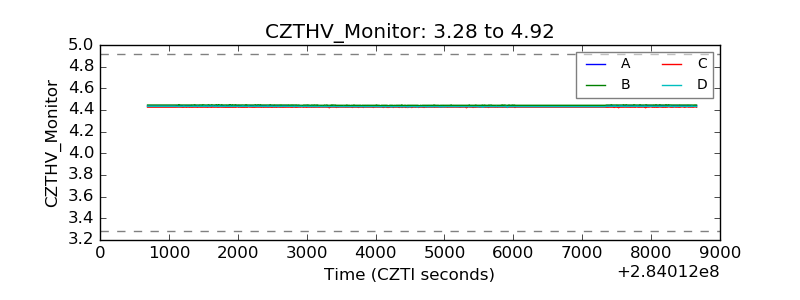 |
| D_VDD | 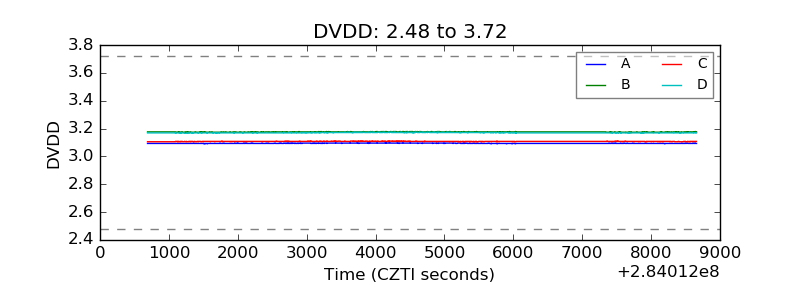 |
| Temperature 1 | 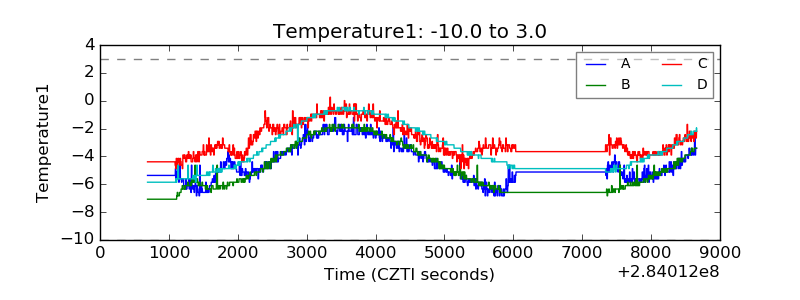 |
| Veto HV Monitor | 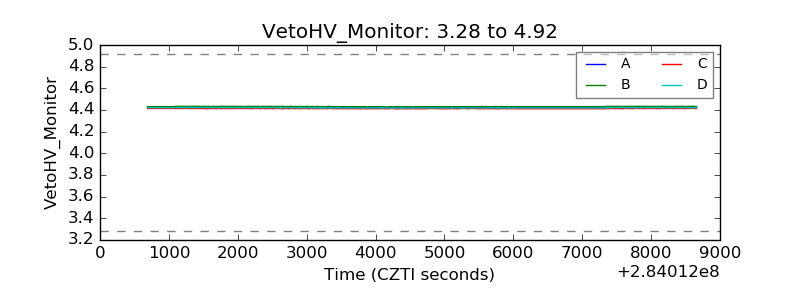 |
| Veto LLD | 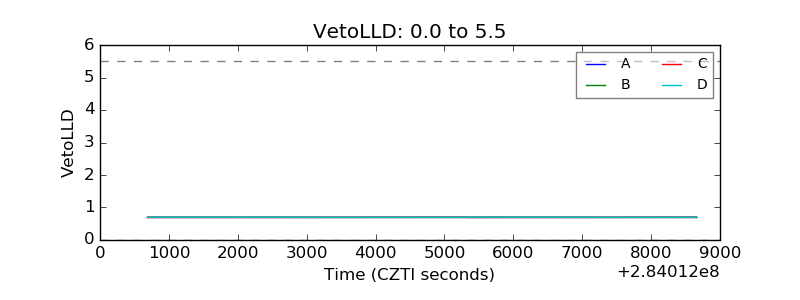 |
| Alpha Counter | 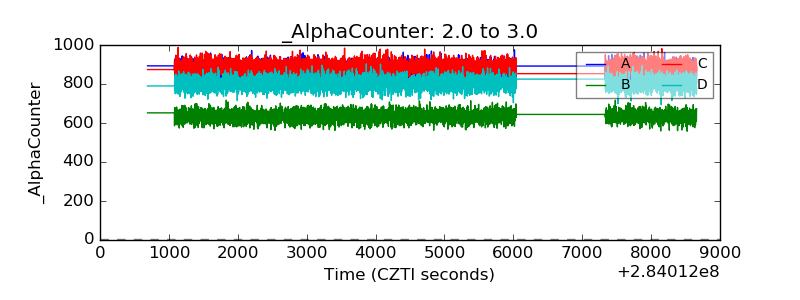 |
| _CPM_Rate | 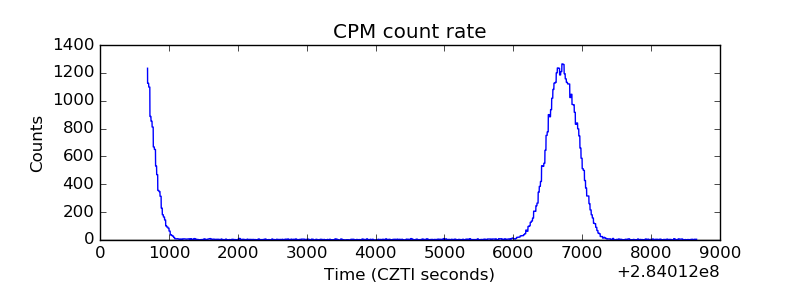 |
| CZT Counter | 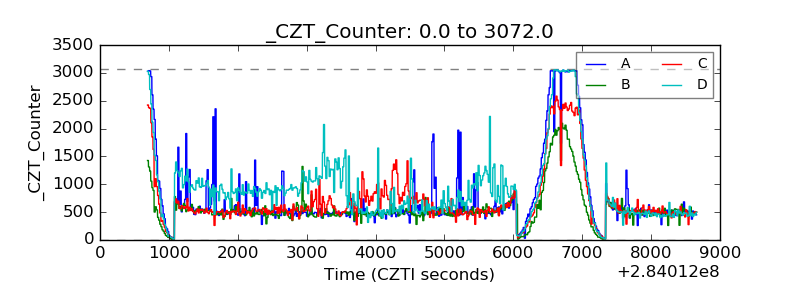 |
| +2.5 Volts monitor |  |
| +5 Volts monitor |  |
| _ROLL_ROT | 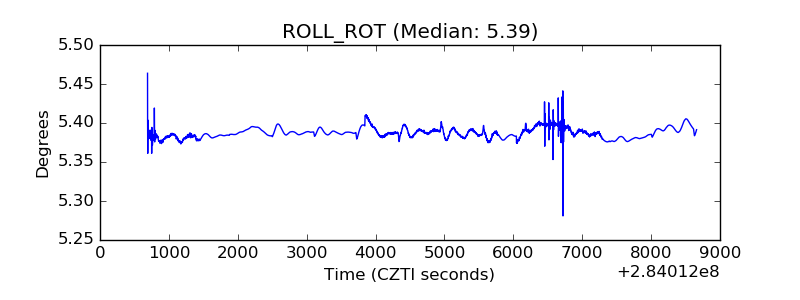 |
| _Roll_DEC | 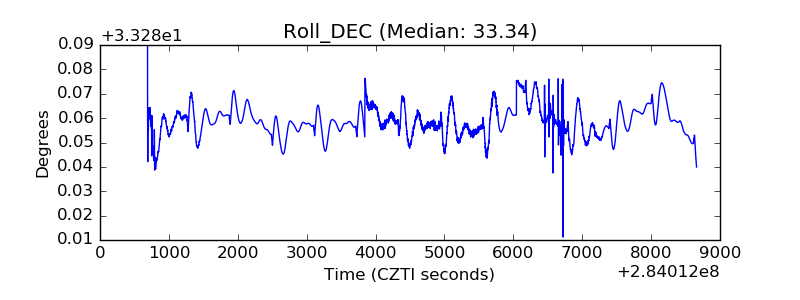 |
| _Roll_RA | 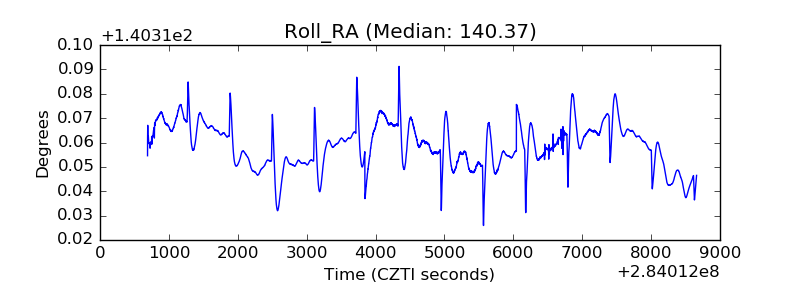 |
| Veto Counter | 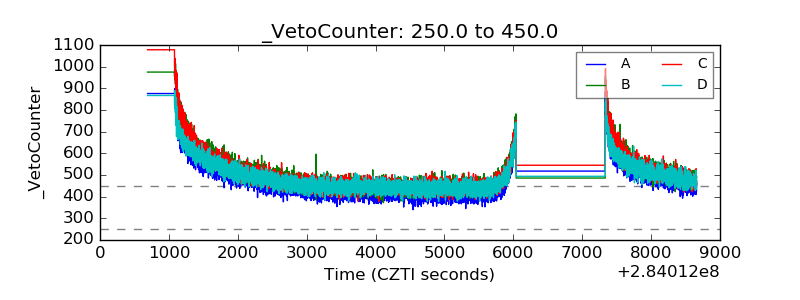 |