| Param | Original file | Final file |
|---|---|---|
| Filename | modeM0/AS1A05_118T02_9000002612_17632cztM0_level2.evt | modeM0/AS1A05_118T02_9000002612_17632cztM0_level2_quad_clean.evt |
| Size (bytes) | 462,928,320 | 83,450,880 |
| Size | 441.5 MB | 79.6 MB |
| Events in quadrant A | 3,573,464 | 526,444 |
| Events in quadrant B | 3,314,607 | 533,861 |
| Events in quadrant C | 3,467,104 | 509,555 |
| Events in quadrant D | 3,222,290 | 502,950 |
| Mode SS | |||
|---|---|---|---|
| Quadrant | BADHDUFLAG | Total packets | Discarded packets |
| A | 0 | 130 | 0 |
| B | 0 | 130 | 0 |
| C | 0 | 130 | 0 |
| D | 0 | 130 | 0 |
| Mode M0 | |||
|---|---|---|---|
| Quadrant | BADHDUFLAG | Total packets | Discarded packets |
| A | 0 | 14631 | 2 |
| B | 0 | 13745 | 2 |
| C | 0 | 14023 | 2 |
| D | 0 | 13824 | 2 |
| Mode M9 | |||
|---|---|---|---|
| Quadrant | BADHDUFLAG | Total packets | Discarded packets |
| A | 0 | 12 | 0 |
| B | 0 | 13 | 0 |
| C | 0 | 13 | 0 |
| D | 0 | 13 | 0 |
| Quadrant | Total seconds | Saturated seconds | Saturation percentage |
|---|---|---|---|
| A | 6520 | 82 | 1.257669% |
| B | 6520 | 69 | 1.058282% |
| C | 6519 | 67 | 1.027765% |
| D | 6519 | 56 | 0.859027% |
Noise dominated data is calculated using 1-second bins in cleaned event files. If a bin has >2000 counts, and if more than 50% of those come from <1% of pixels, then it is considered to be noise-dominated and hence unusable.
| Quadrant | # 1 sec bins | Bins with >0 counts | Bins with >2000 counts | High rate bins dominated by noise | Noise dominated (total time) | Noise dominated (detector-on time) | Marked lightcurve |
|---|---|---|---|---|---|---|---|
| A | 7490 | 6522 | 30 | 30 | 0.40% | 0.46% | 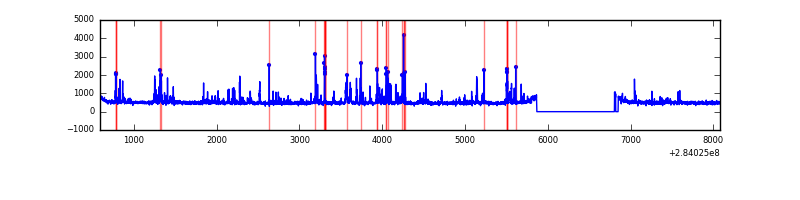 |
| B | 7490 | 6522 | 11 | 11 | 0.15% | 0.17% | 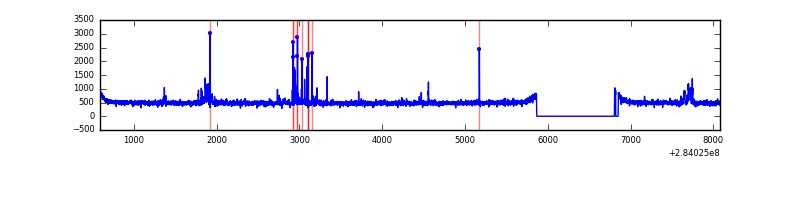 |
| C | 7489 | 6521 | 0 | 0 | 0.00% | 0.00% | 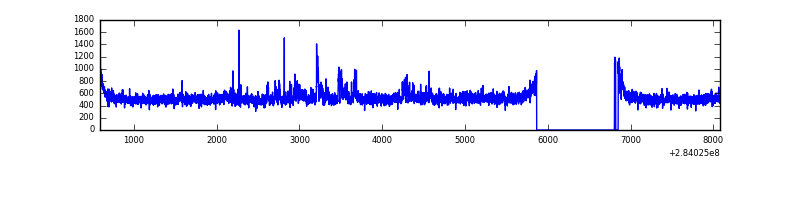 |
| D | 7489 | 6521 | 14 | 14 | 0.19% | 0.21% | 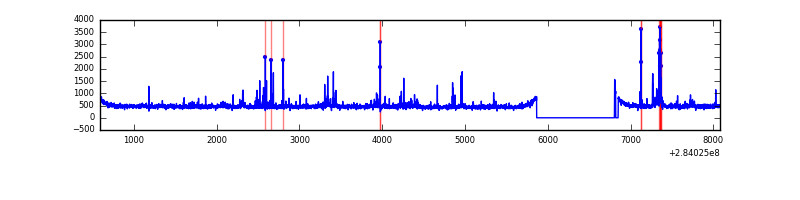 |
Top three noisy pixels from each quadrant. If the there are fewer than three noisy pixels in the level2.evt file, extra rows are filled as -1
| Pixel properties | Quadrant properties | ||||||
|---|---|---|---|---|---|---|---|
| Quadrant | DetID | PixID | Counts | Sigma | Mean | Median | Sigma |
| A | 14 | 237 | 444837 | 2690.49 | 814 | 797 | 165.0 |
| A | 0 | 226 | 7299 | 39.4 | 814 | 797 | 165.0 |
| A | 12 | 194 | 5866 | 30.71 | 814 | 797 | 165.0 |
| B | 0 | 230 | 69978 | 451.42 | 804 | 786 | 153.3 |
| B | 7 | 220 | 57636 | 370.9 | 804 | 786 | 153.3 |
| B | 12 | 111 | 18315 | 114.36 | 804 | 786 | 153.3 |
| C | 3 | 233 | 310925 | 1721.69 | 772 | 776 | 180.1 |
| C | 14 | 238 | 118804 | 655.19 | 772 | 776 | 180.1 |
| C | 5 | 218 | 16054 | 84.81 | 772 | 776 | 180.1 |
| D | 13 | 189 | 178909 | 926.49 | 789 | 764 | 192.3 |
| D | 2 | 234 | 24416 | 123.01 | 789 | 764 | 192.3 |
| D | 10 | 70 | 12106 | 58.99 | 789 | 764 | 192.3 |
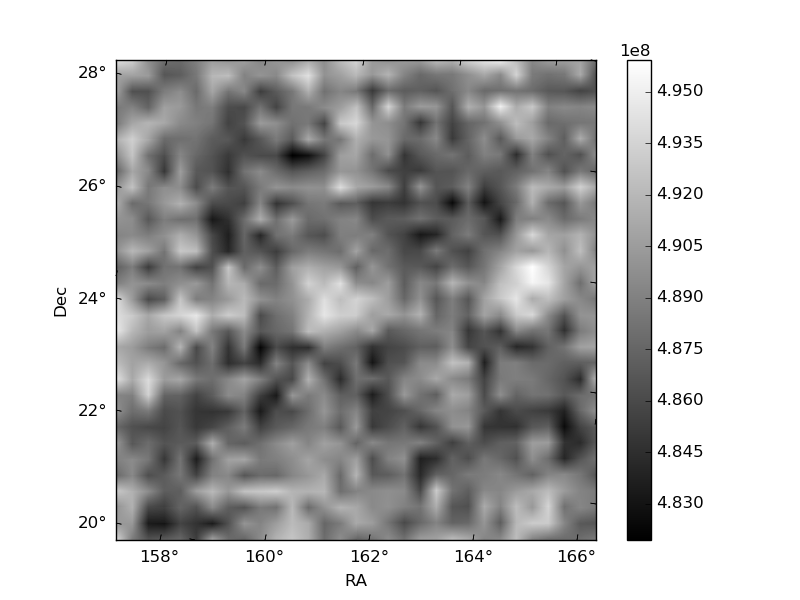
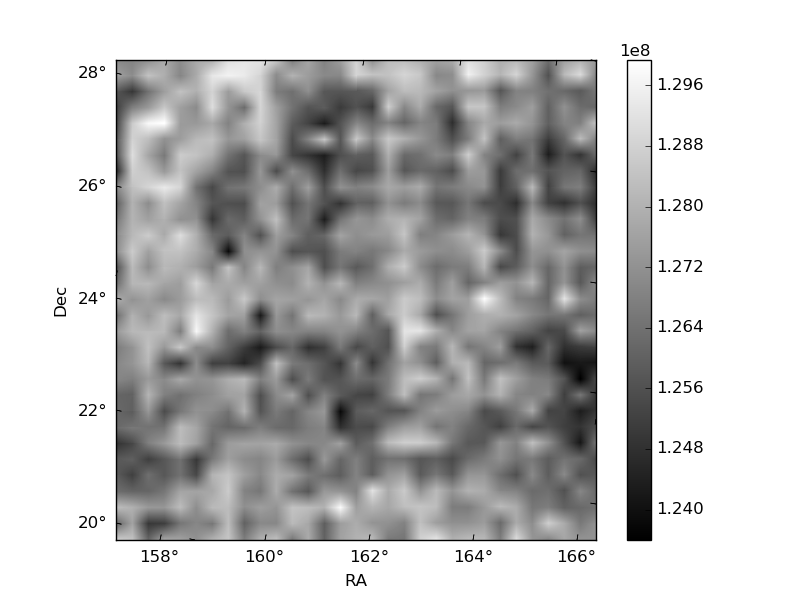
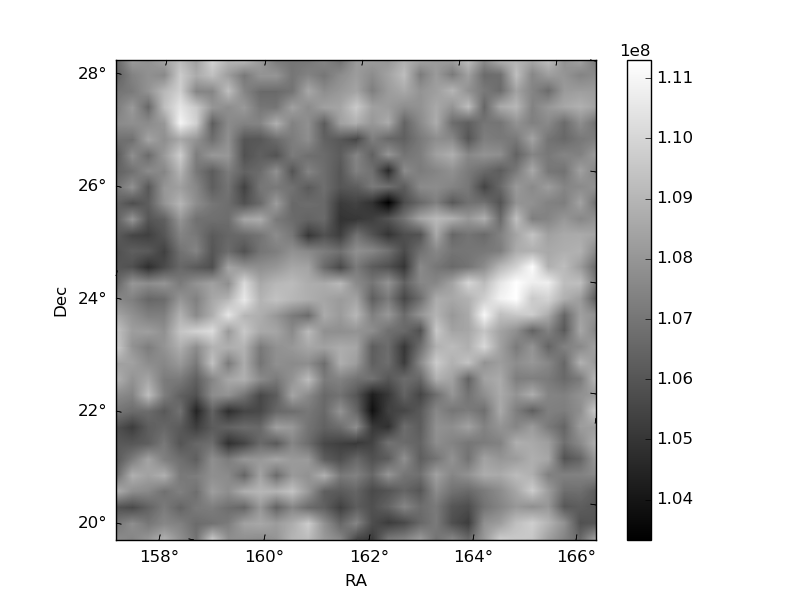
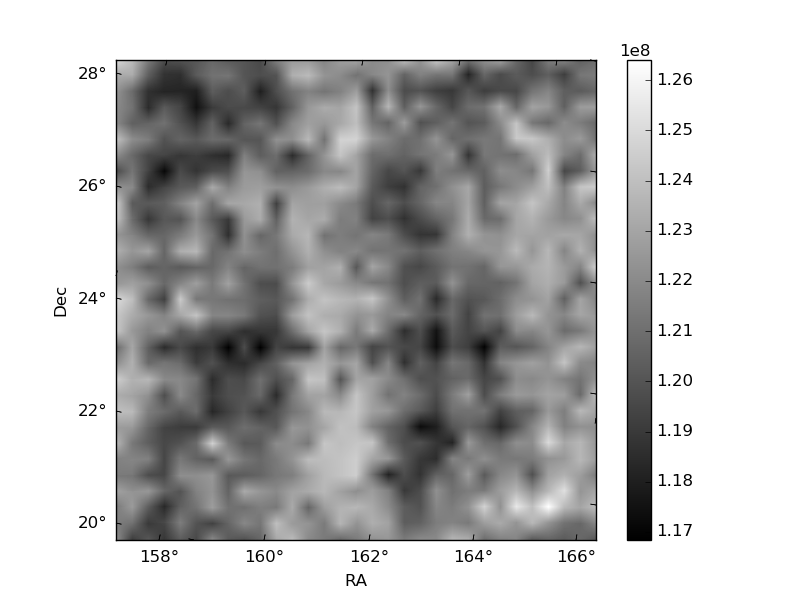
Histogram calculated using DETX and DETY for each event in the final _common_clean file
| Quadrant A | 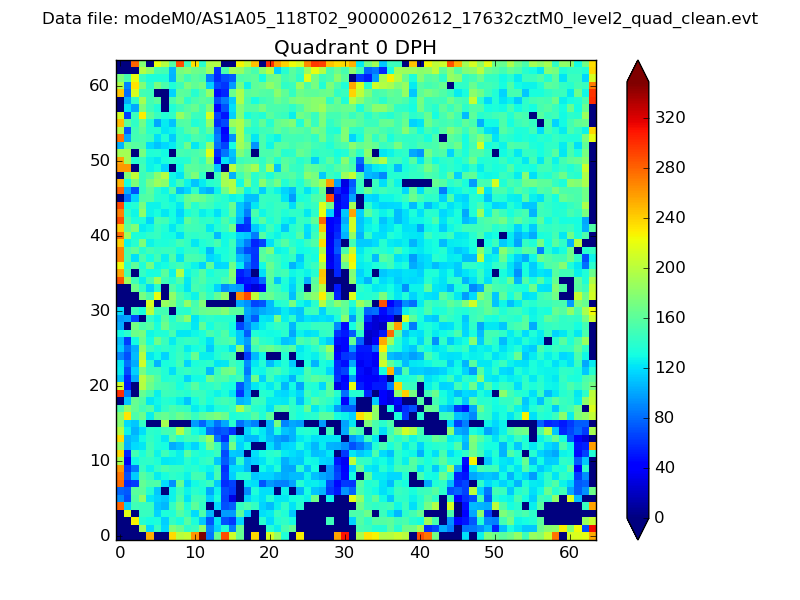 |
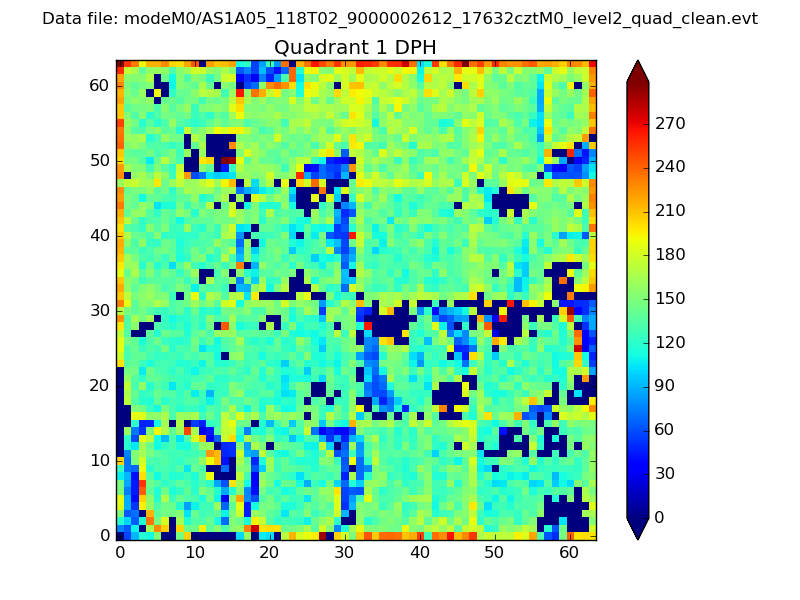 |
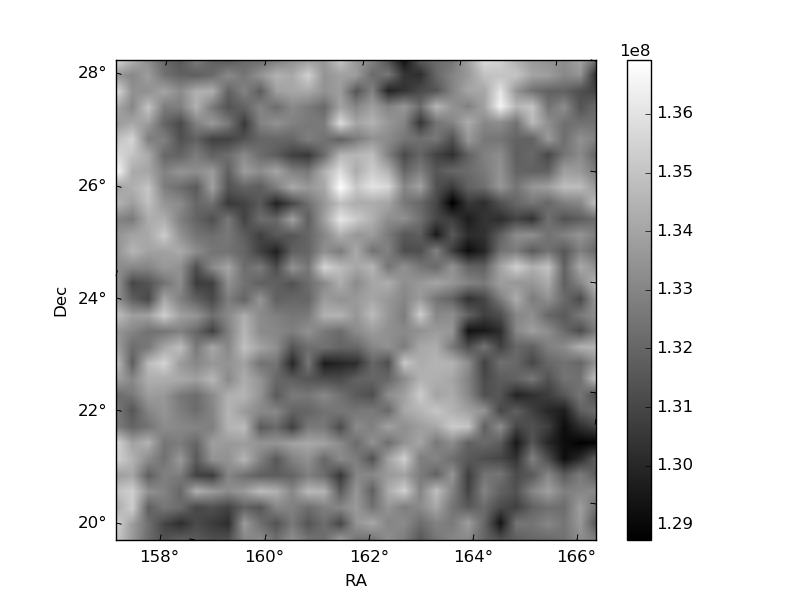
Quadrant B |
|---|---|---|---|
| Quadrant D | 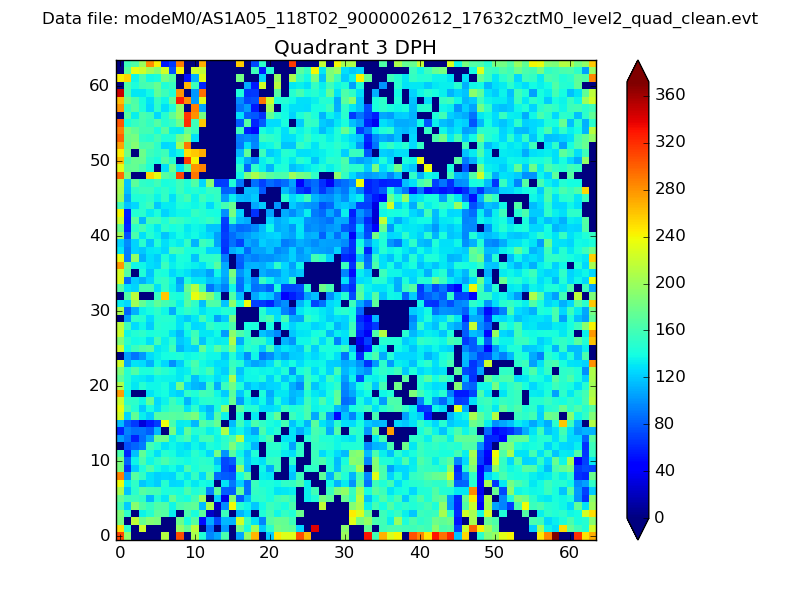 |
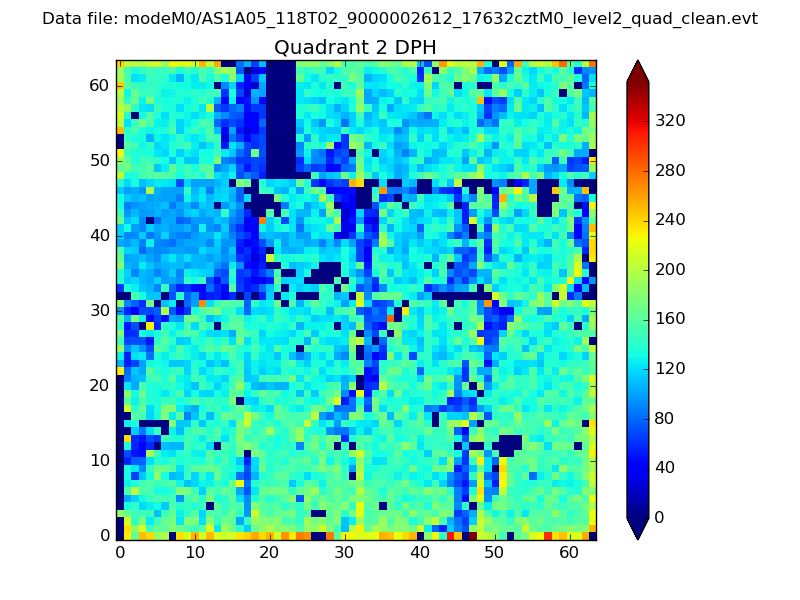 |
Quadrant C |
| Plot type | Count rate plots | Images |
|---|---|---|
| Comparison with Poisson distribution Blue bars denote a histogram of data divided into 1 sec bins. Red curve is a Poisson curve with rate = median count rate of data. |
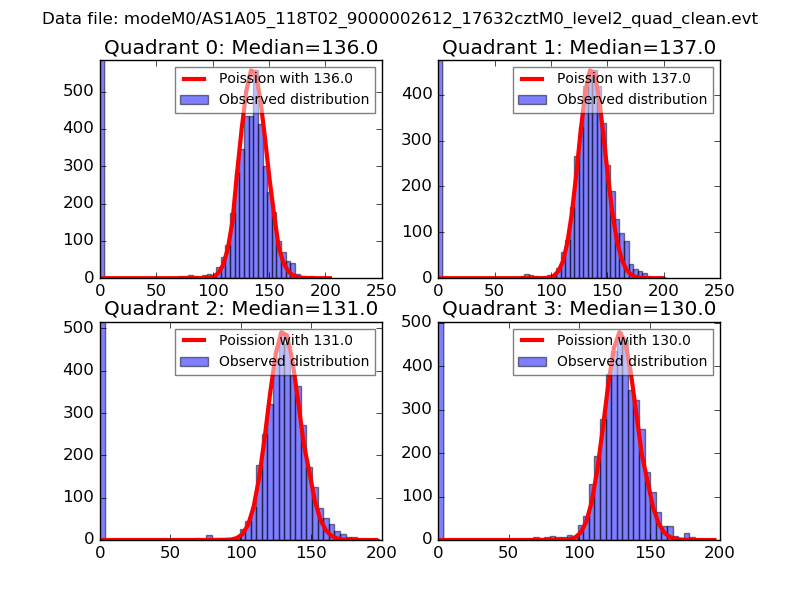 |
 |
| Quadrant-wise count rates Data is divided into 100 sec bins |
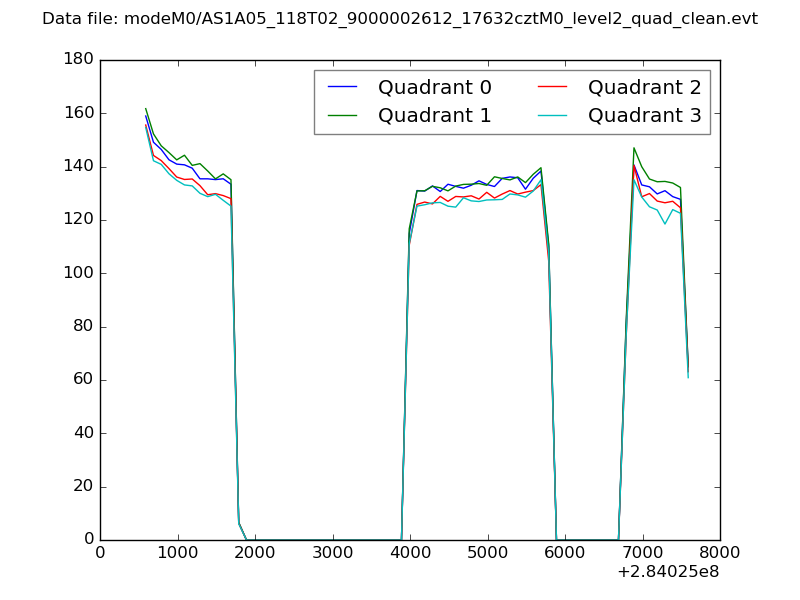 |
|
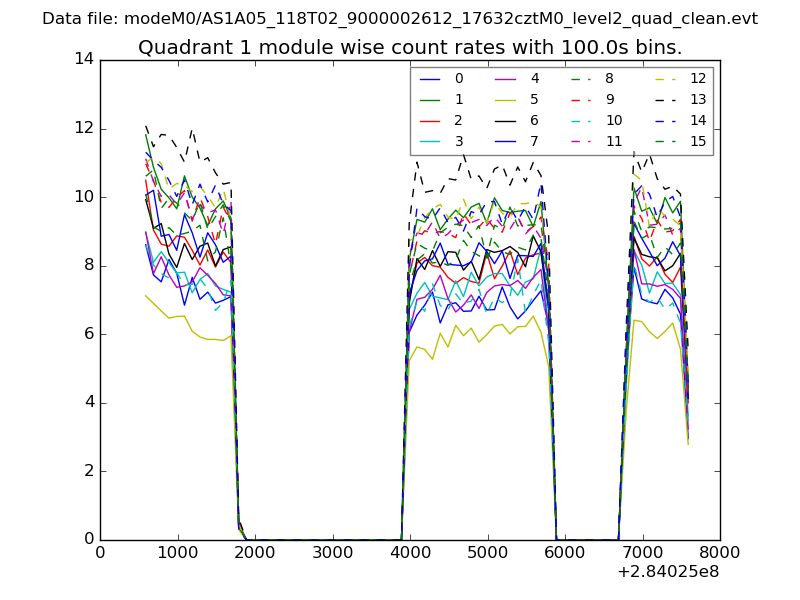
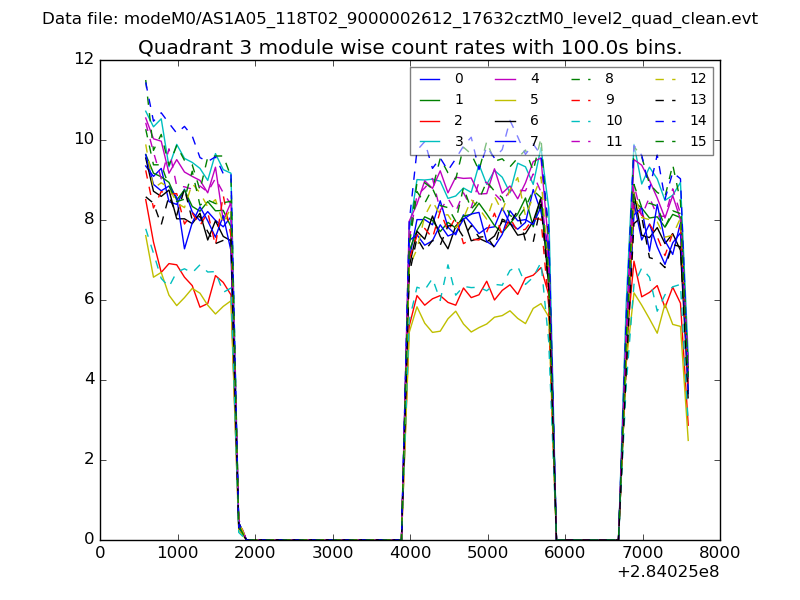
| Module-wise count rates for Quadrant A Data is divided into 100 sec bins |
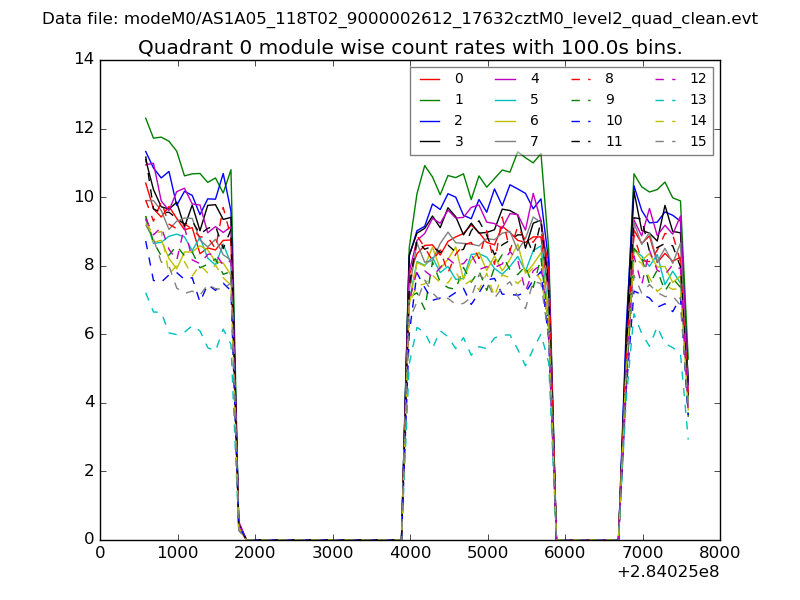 |
 |
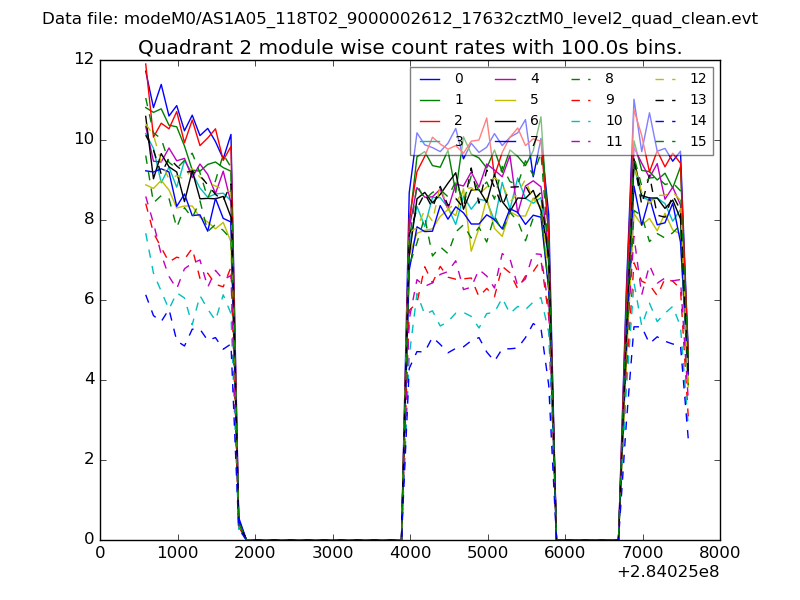
| Module-wise count rates for Quadrant B Data is divided into 100 sec bins |
 |
 |
| Module-wise count rates for Quadrant C Data is divided into 100 sec bins |
 |
 |
| Module-wise count rates for Quadrant D Data is divided into 100 sec bins |
 |
 |
| Parameter | Plot |
|---|---|
| CZT HV Monitor | 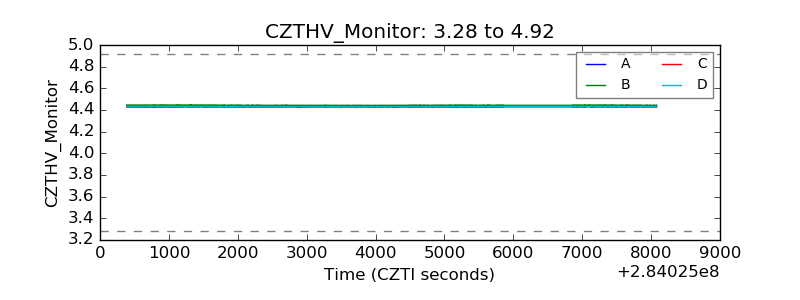 |
| D_VDD | 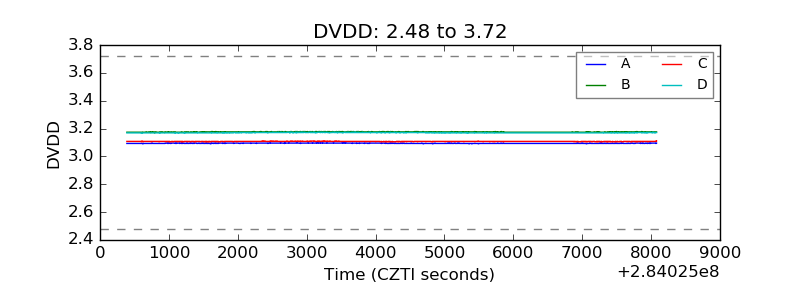 |
| Temperature 1 | 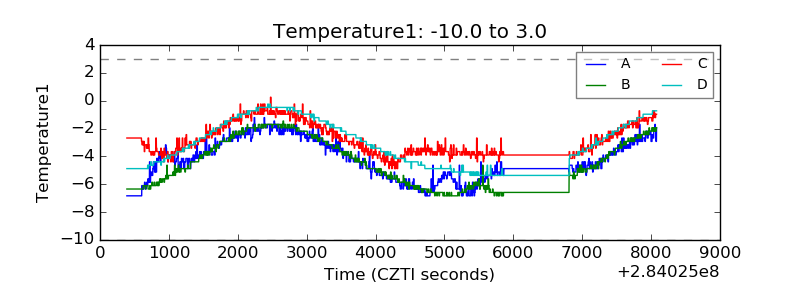 |
| Veto HV Monitor | 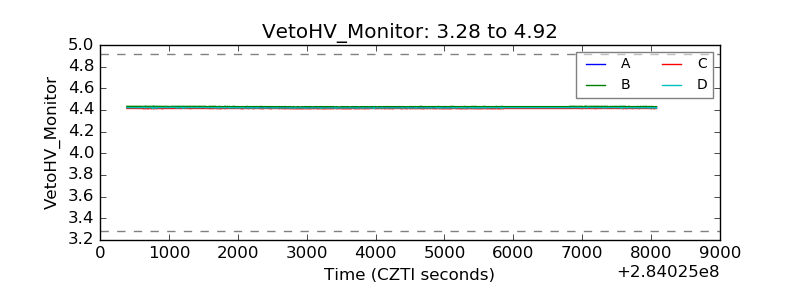 |
| Veto LLD | 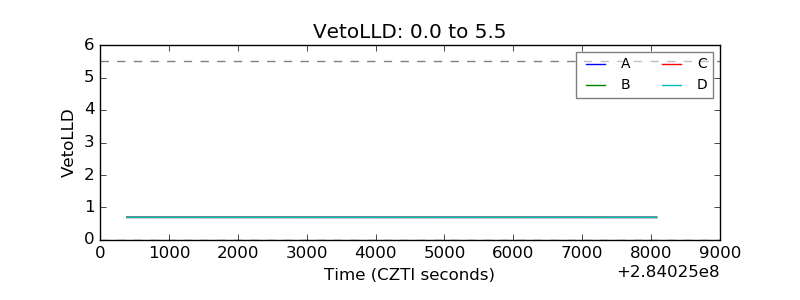 |
| Alpha Counter | 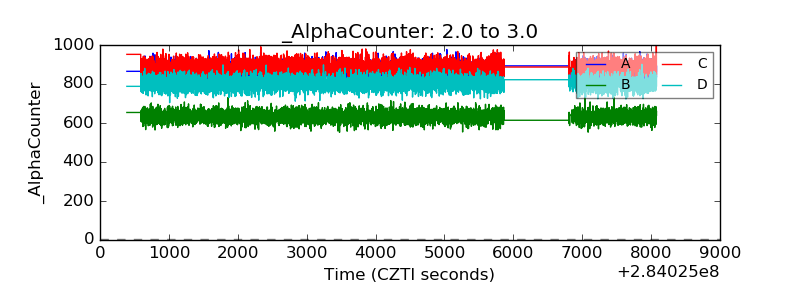 |
| _CPM_Rate | 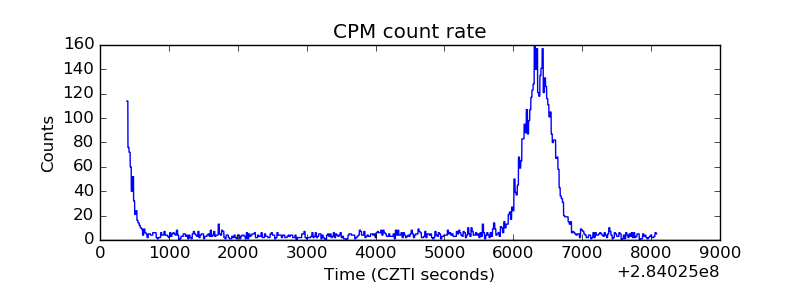 |
| CZT Counter | 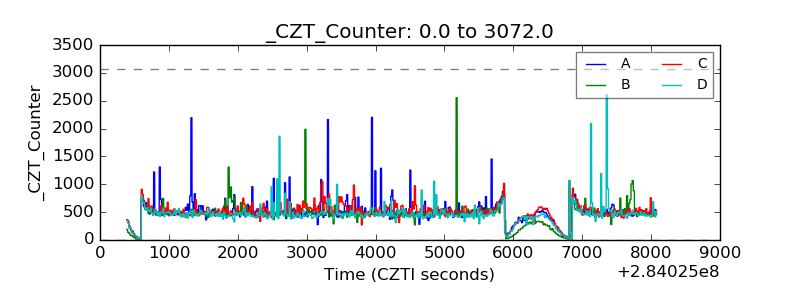 |
| +2.5 Volts monitor |  |
| +5 Volts monitor | 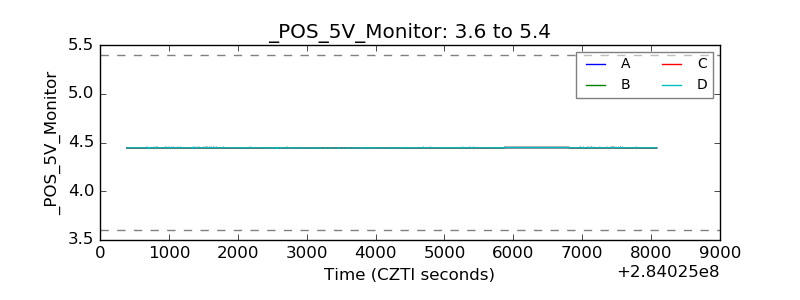 |
| _ROLL_ROT |  |
| _Roll_DEC | 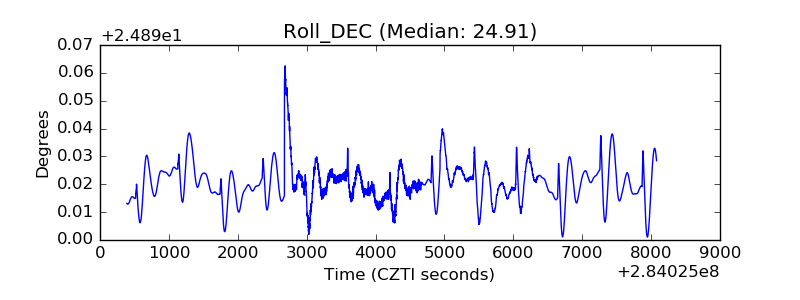 |
| _Roll_RA | 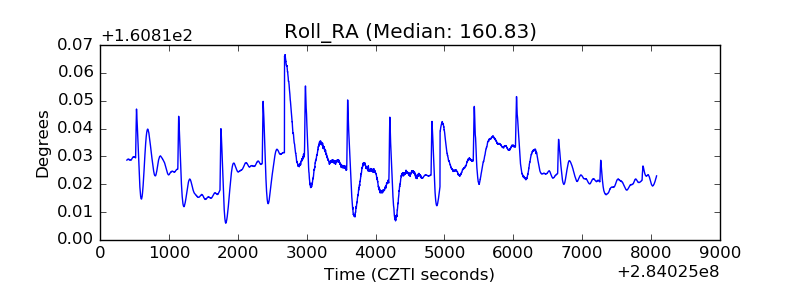 |
| Veto Counter | 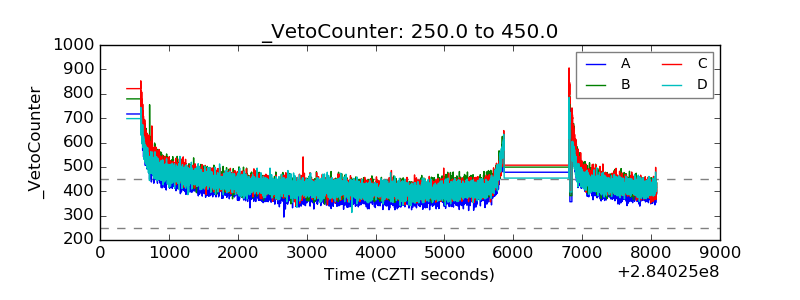 |