| Param | Original file | Final file |
|---|---|---|
| Filename | modeM0/AS1A05_118T02_9000002612_17634cztM0_level2.evt | modeM0/AS1A05_118T02_9000002612_17634cztM0_level2_quad_clean.evt |
| Size (bytes) | 540,371,520 | 80,291,520 |
| Size | 515.3 MB | 76.6 MB |
| Events in quadrant A | 4,113,271 | 480,236 |
| Events in quadrant B | 3,997,933 | 484,489 |
| Events in quadrant C | 3,883,010 | 466,002 |
| Events in quadrant D | 3,846,885 | 463,409 |
| Mode SS | |||
|---|---|---|---|
| Quadrant | BADHDUFLAG | Total packets | Discarded packets |
| A | 0 | 158 | 0 |
| B | 0 | 158 | 0 |
| C | 0 | 158 | 0 |
| D | 0 | 158 | 0 |
| Mode M0 | |||
|---|---|---|---|
| Quadrant | BADHDUFLAG | Total packets | Discarded packets |
| A | 0 | 17145 | 3 |
| B | 0 | 16821 | 3 |
| C | 0 | 16279 | 3 |
| D | 0 | 16736 | 3 |
| Mode M9 | |||
|---|---|---|---|
| Quadrant | BADHDUFLAG | Total packets | Discarded packets |
| A | 0 | 2 | 0 |
| B | 0 | 2 | 0 |
| C | 0 | 2 | 0 |
| D | 0 | 2 | 0 |
| Quadrant | Total seconds | Saturated seconds | Saturation percentage |
|---|---|---|---|
| A | 7714 | 182 | 2.359347% |
| B | 7714 | 207 | 2.683433% |
| C | 7714 | 222 | 2.877884% |
| D | 7715 | 169 | 2.190538% |
Noise dominated data is calculated using 1-second bins in cleaned event files. If a bin has >2000 counts, and if more than 50% of those come from <1% of pixels, then it is considered to be noise-dominated and hence unusable.
| Quadrant | # 1 sec bins | Bins with >0 counts | Bins with >2000 counts | High rate bins dominated by noise | Noise dominated (total time) | Noise dominated (detector-on time) | Marked lightcurve |
|---|---|---|---|---|---|---|---|
| A | 7989 | 7716 | 38 | 38 | 0.48% | 0.49% | 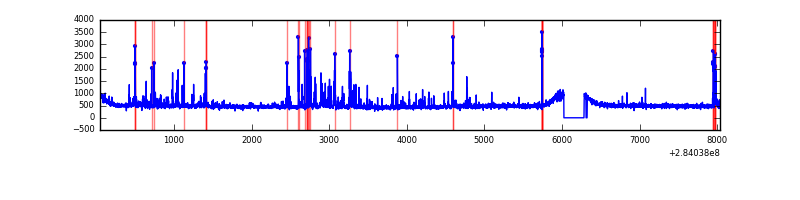 |
| B | 7989 | 7716 | 19 | 19 | 0.24% | 0.25% | 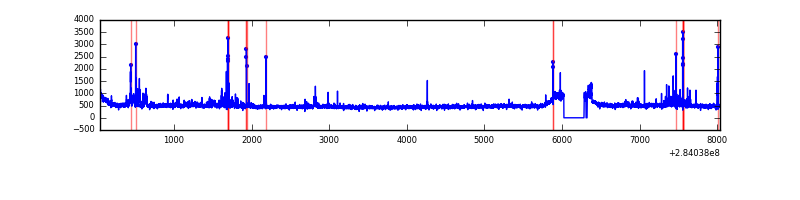 |
| C | 7989 | 7715 | 0 | 0 | 0.00% | 0.00% | 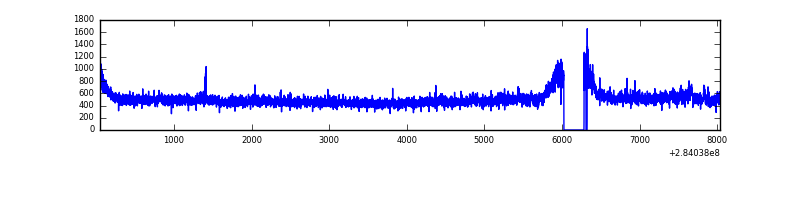 |
| D | 7990 | 7717 | 34 | 34 | 0.43% | 0.44% | 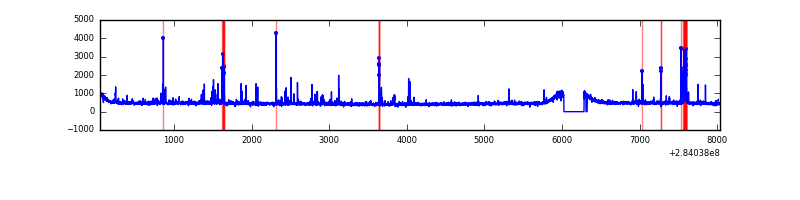 |
Top three noisy pixels from each quadrant. If the there are fewer than three noisy pixels in the level2.evt file, extra rows are filled as -1
| Pixel properties | Quadrant properties | ||||||
|---|---|---|---|---|---|---|---|
| Quadrant | DetID | PixID | Counts | Sigma | Mean | Median | Sigma |
| A | 14 | 237 | 417246 | 2133.21 | 955 | 933 | 195.2 |
| A | 4 | 2 | 21303 | 104.37 | 955 | 933 | 195.2 |
| A | 0 | 226 | 8472 | 38.63 | 955 | 933 | 195.2 |
| B | 7 | 220 | 106750 | 572.49 | 949 | 925 | 184.8 |
| B | 0 | 230 | 68874 | 367.59 | 949 | 925 | 184.8 |
| B | 10 | 246 | 22461 | 116.51 | 949 | 925 | 184.8 |
| C | 3 | 233 | 170166 | 783.44 | 910 | 914 | 216.0 |
| C | 14 | 238 | 139904 | 643.36 | 910 | 914 | 216.0 |
| C | 5 | 218 | 20925 | 92.63 | 910 | 914 | 216.0 |
| D | 13 | 189 | 187328 | 817.88 | 932 | 905 | 227.9 |
| D | 10 | 70 | 73604 | 318.95 | 932 | 905 | 227.9 |
| D | 2 | 234 | 28636 | 121.66 | 932 | 905 | 227.9 |
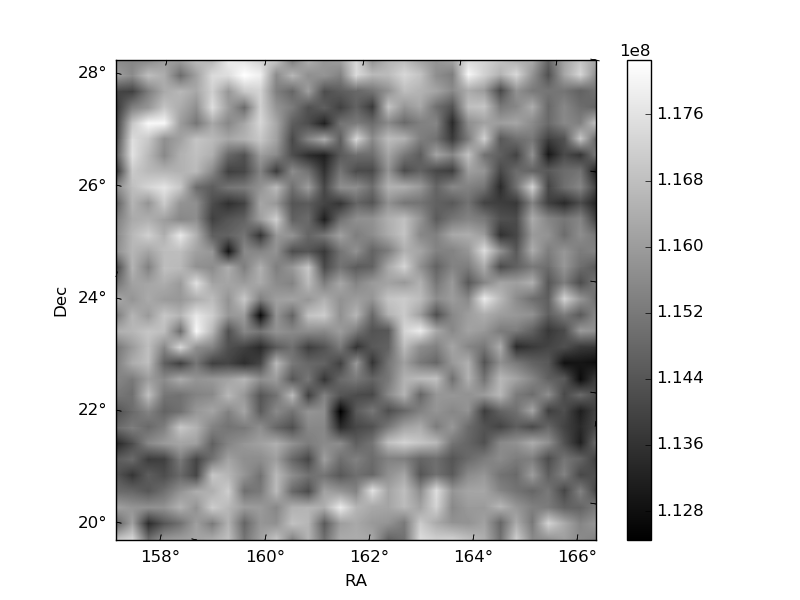
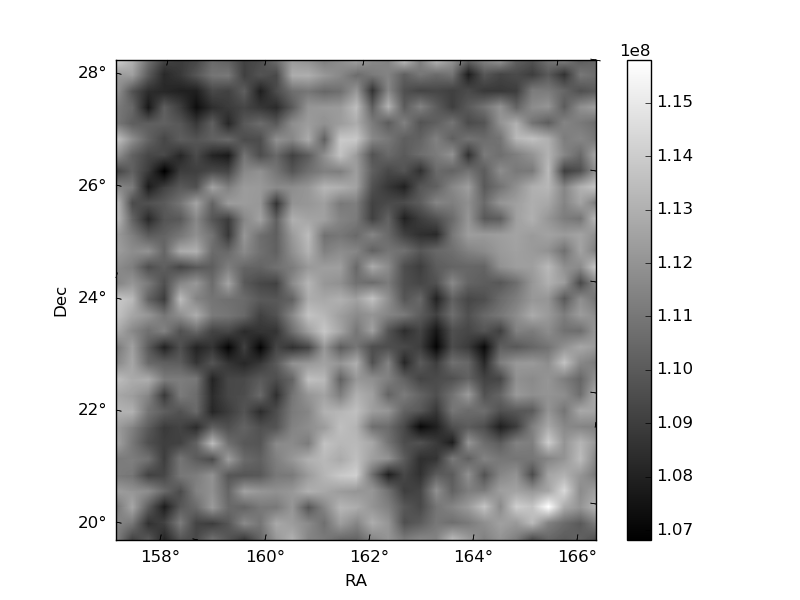
Histogram calculated using DETX and DETY for each event in the final _common_clean file
| Quadrant A |  |
 |
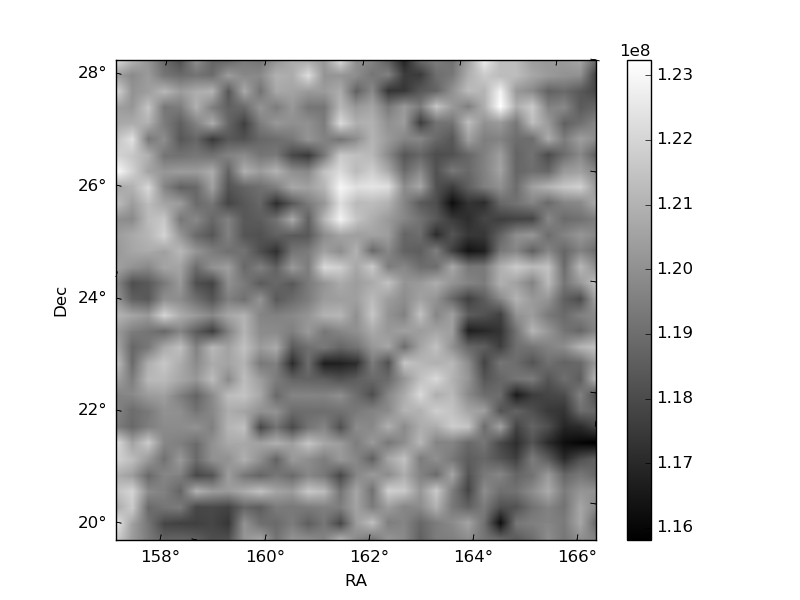
Quadrant B |
|---|---|---|---|
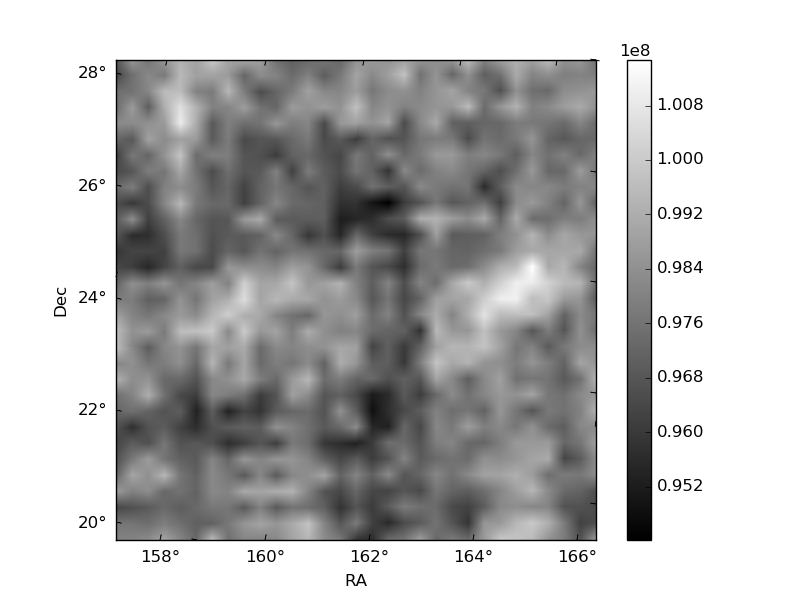
| Quadrant D | 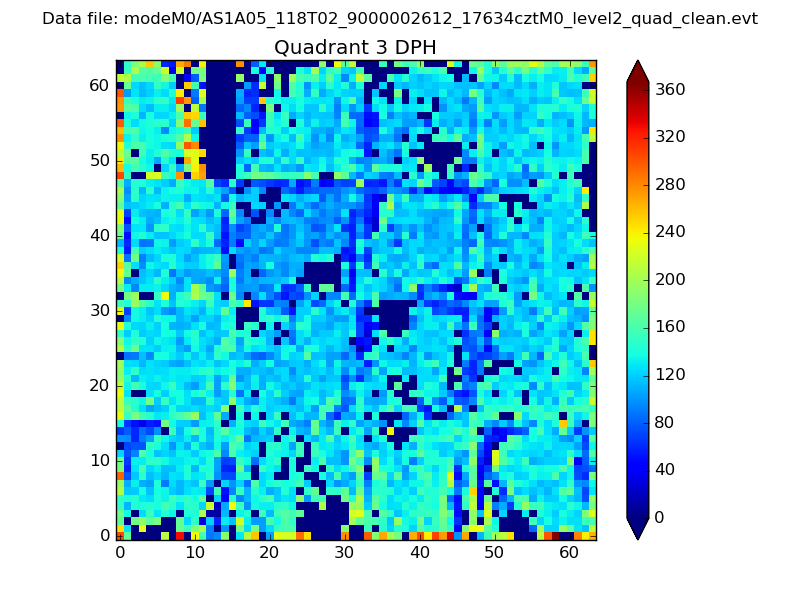 |
 |
Quadrant C |
| Plot type | Count rate plots | Images |
|---|---|---|
| Comparison with Poisson distribution Blue bars denote a histogram of data divided into 1 sec bins. Red curve is a Poisson curve with rate = median count rate of data. |
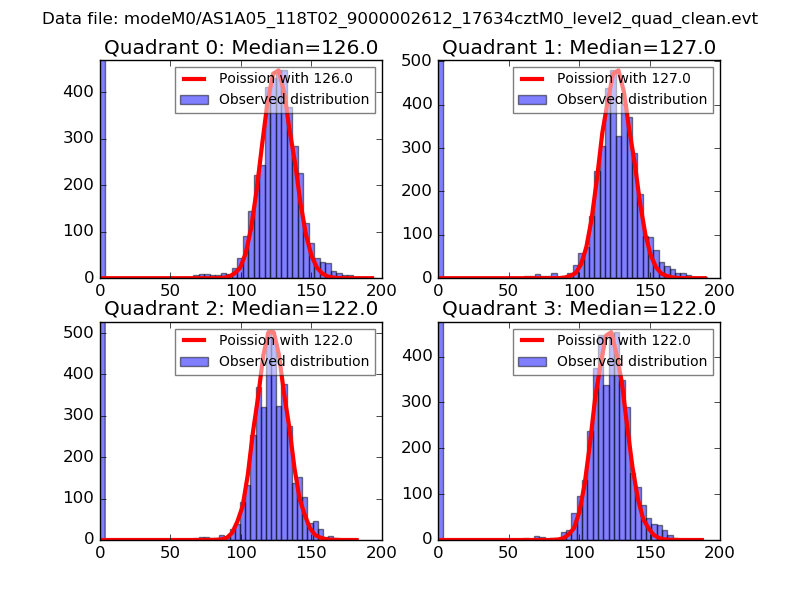 |
 |
| Quadrant-wise count rates Data is divided into 100 sec bins |
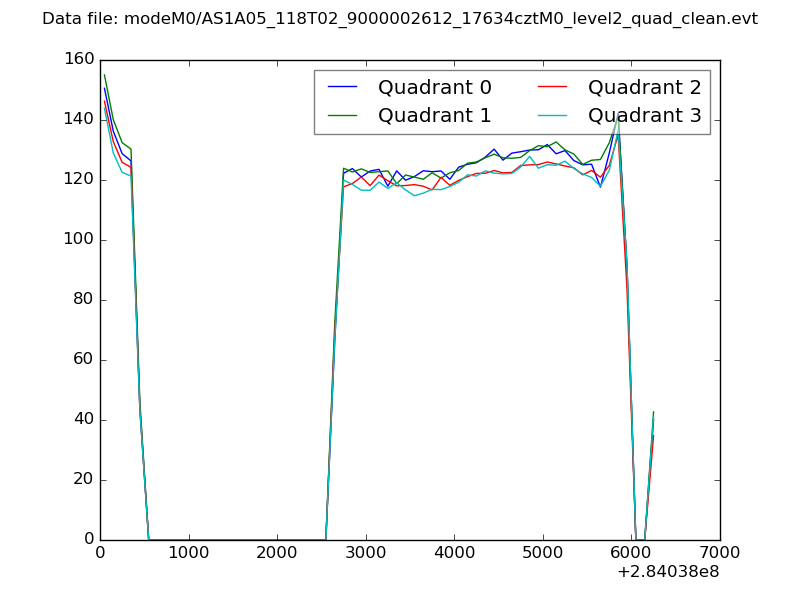 |
|
| Module-wise count rates for Quadrant A Data is divided into 100 sec bins |
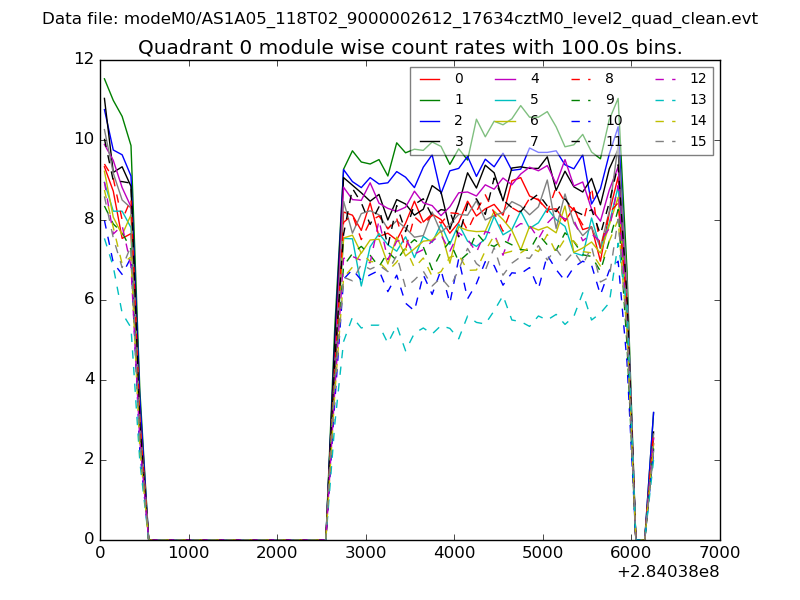 |
 |
| Module-wise count rates for Quadrant B Data is divided into 100 sec bins |
 |
 |
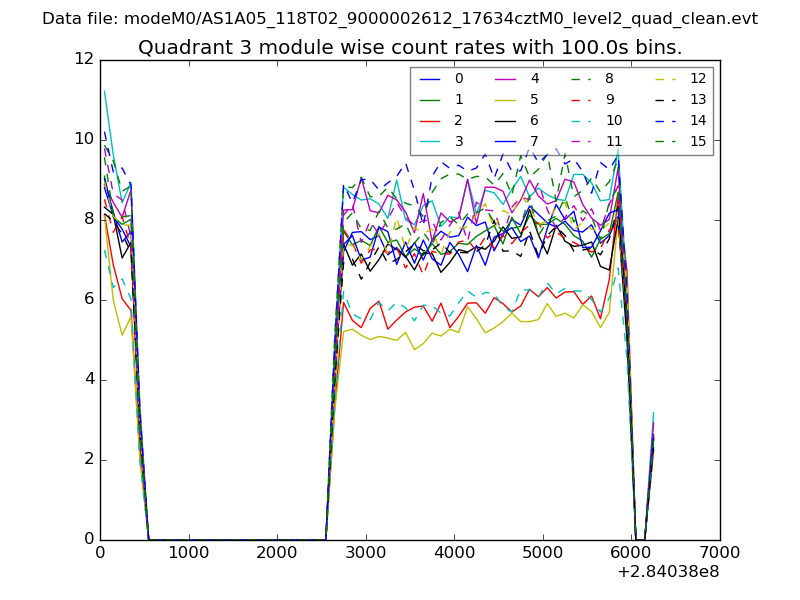
| Module-wise count rates for Quadrant C Data is divided into 100 sec bins |
 |
 |
| Module-wise count rates for Quadrant D Data is divided into 100 sec bins |
 |
 |
| Parameter | Plot |
|---|---|
| CZT HV Monitor |  |
| D_VDD | 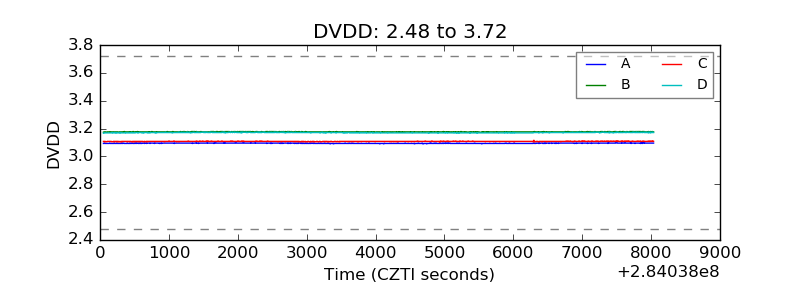 |
| Temperature 1 | 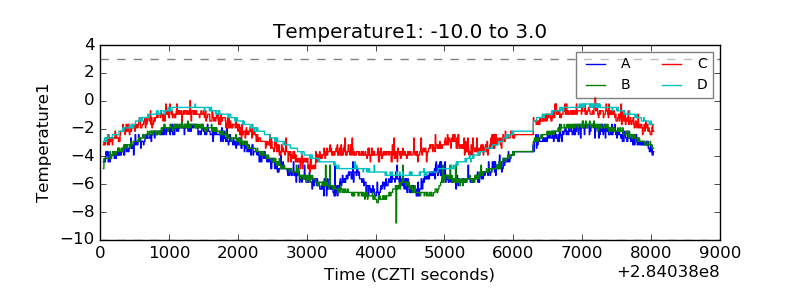 |
| Veto HV Monitor | 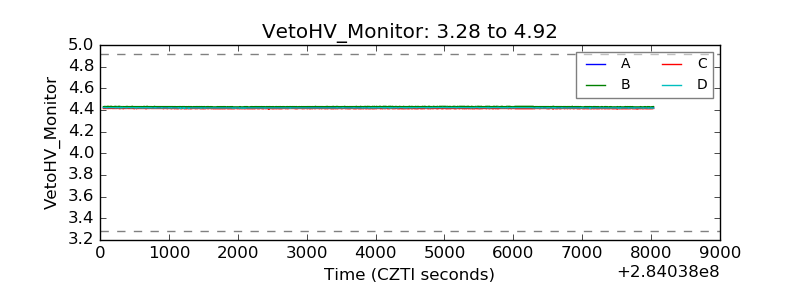 |
| Veto LLD | 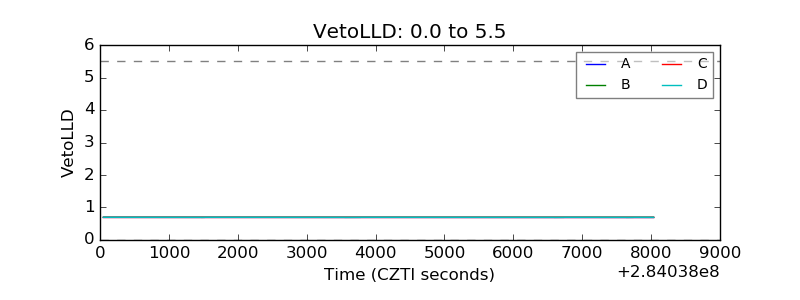 |
| Alpha Counter | 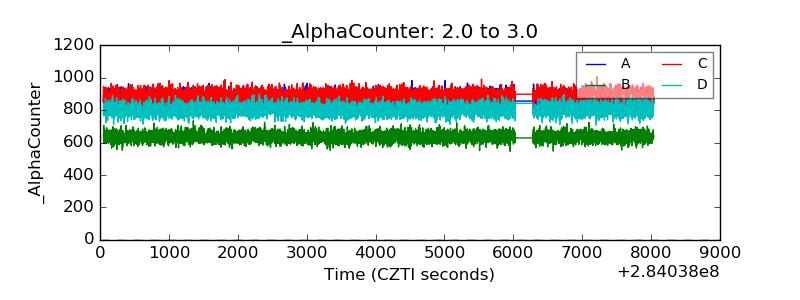 |
| _CPM_Rate | 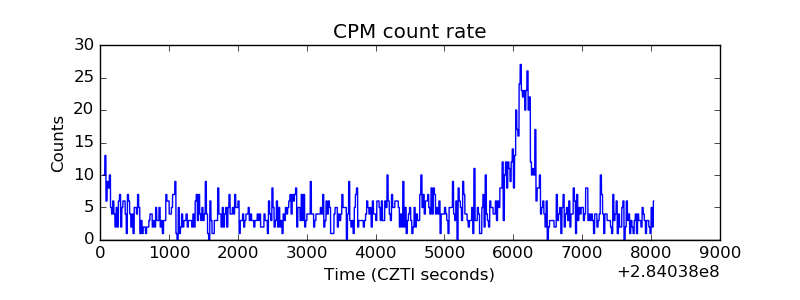 |
| CZT Counter | 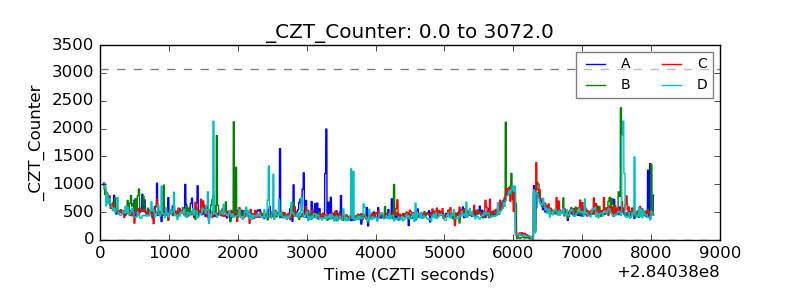 |
| +2.5 Volts monitor |  |
| +5 Volts monitor | 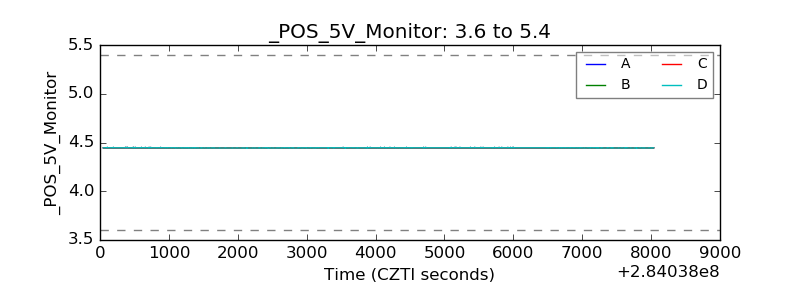 |
| _ROLL_ROT | 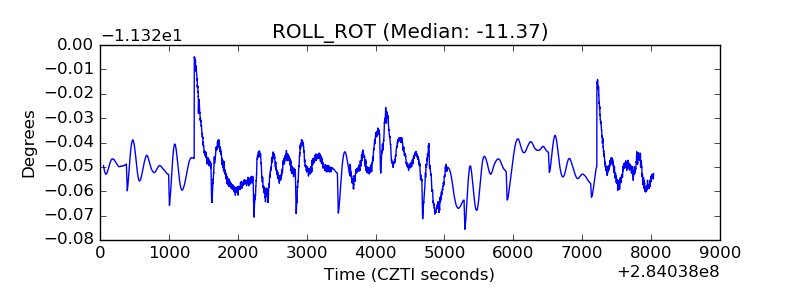 |
| _Roll_DEC | 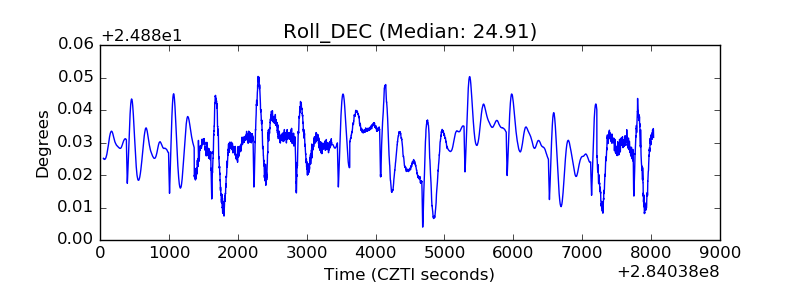 |
| _Roll_RA | 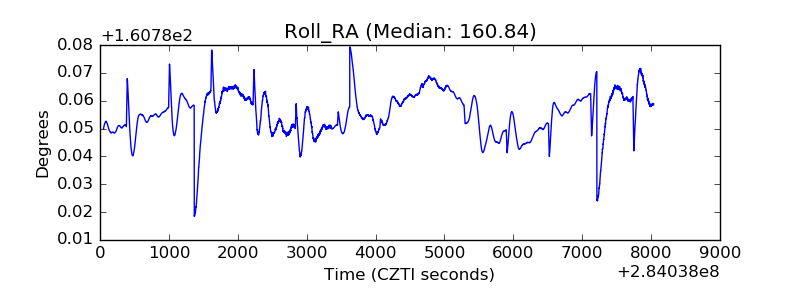 |
| Veto Counter | 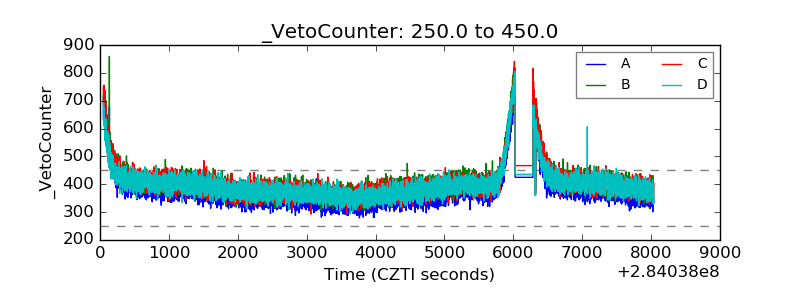 |