| Param | Original file | Final file |
|---|---|---|
| Filename | modeM0/AS1A05_118T02_9000002612_17635cztM0_level2.evt | modeM0/AS1A05_118T02_9000002612_17635cztM0_level2_quad_clean.evt |
| Size (bytes) | 528,719,040 | 76,443,840 |
| Size | 504.2 MB | 72.9 MB |
| Events in quadrant A | 3,970,428 | 452,623 |
| Events in quadrant B | 3,869,386 | 456,654 |
| Events in quadrant C | 3,885,412 | 439,439 |
| Events in quadrant D | 3,768,876 | 435,226 |
| Mode SS | |||
|---|---|---|---|
| Quadrant | BADHDUFLAG | Total packets | Discarded packets |
| A | 0 | 156 | 0 |
| B | 0 | 156 | 0 |
| C | 0 | 156 | 0 |
| D | 0 | 156 | 0 |
| Mode M0 | |||
|---|---|---|---|
| Quadrant | BADHDUFLAG | Total packets | Discarded packets |
| A | 0 | 16626 | 3 |
| B | 0 | 16340 | 3 |
| C | 0 | 16158 | 3 |
| D | 0 | 16339 | 3 |
| Mode M9 | |||
|---|---|---|---|
| Quadrant | BADHDUFLAG | Total packets | Discarded packets |
| A | 0 | 3 | 0 |
| B | 0 | 3 | 0 |
| C | 0 | 3 | 0 |
| D | 0 | 3 | 0 |
| Quadrant | Total seconds | Saturated seconds | Saturation percentage |
|---|---|---|---|
| A | 7623 | 136 | 1.784075% |
| B | 7624 | 164 | 2.151102% |
| C | 7624 | 202 | 2.649528% |
| D | 7624 | 141 | 1.849423% |
Noise dominated data is calculated using 1-second bins in cleaned event files. If a bin has >2000 counts, and if more than 50% of those come from <1% of pixels, then it is considered to be noise-dominated and hence unusable.
| Quadrant | # 1 sec bins | Bins with >0 counts | Bins with >2000 counts | High rate bins dominated by noise | Noise dominated (total time) | Noise dominated (detector-on time) | Marked lightcurve |
|---|---|---|---|---|---|---|---|
| A | 7958 | 7625 | 22 | 22 | 0.28% | 0.29% | 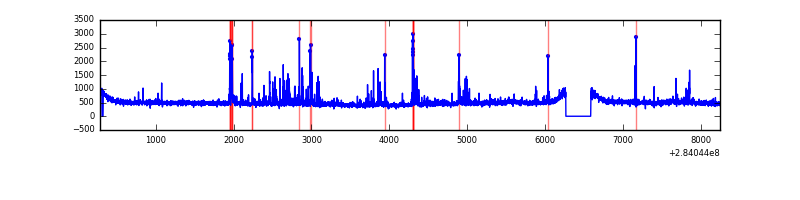 |
| B | 7959 | 7626 | 18 | 18 | 0.23% | 0.24% | 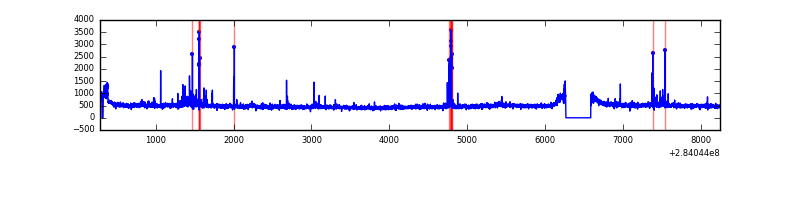 |
| C | 7959 | 7626 | 0 | 0 | 0.00% | 0.00% | 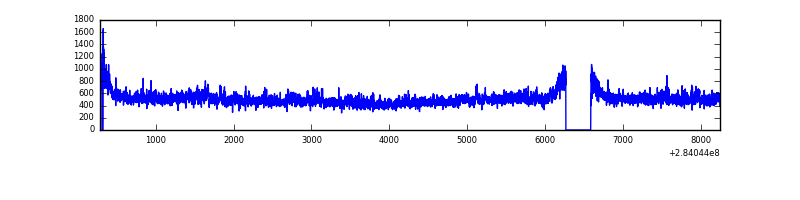 |
| D | 7959 | 7626 | 32 | 32 | 0.40% | 0.42% | 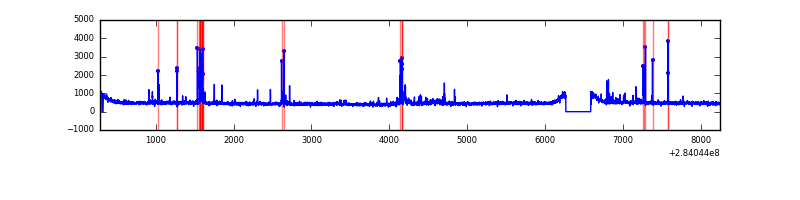 |
Top three noisy pixels from each quadrant. If the there are fewer than three noisy pixels in the level2.evt file, extra rows are filled as -1
| Pixel properties | Quadrant properties | ||||||
|---|---|---|---|---|---|---|---|
| Quadrant | DetID | PixID | Counts | Sigma | Mean | Median | Sigma |
| A | 14 | 237 | 345876 | 1800.44 | 940 | 919 | 191.6 |
| A | 0 | 226 | 8395 | 39.02 | 940 | 919 | 191.6 |
| A | 3 | 137 | 7041 | 31.95 | 940 | 919 | 191.6 |
| B | 7 | 220 | 83546 | 456.87 | 933 | 907 | 180.9 |
| B | 10 | 246 | 46819 | 253.83 | 933 | 907 | 180.9 |
| B | 0 | 230 | 30560 | 163.94 | 933 | 907 | 180.9 |
| C | 3 | 233 | 251730 | 1182.25 | 894 | 896 | 212.2 |
| C | 14 | 238 | 138660 | 649.32 | 894 | 896 | 212.2 |
| C | 5 | 218 | 12053 | 52.59 | 894 | 896 | 212.2 |
| D | 13 | 189 | 244176 | 1082.61 | 914 | 887 | 224.7 |
| D | 2 | 234 | 30669 | 132.53 | 914 | 887 | 224.7 |
| D | 10 | 70 | 23750 | 101.74 | 914 | 887 | 224.7 |
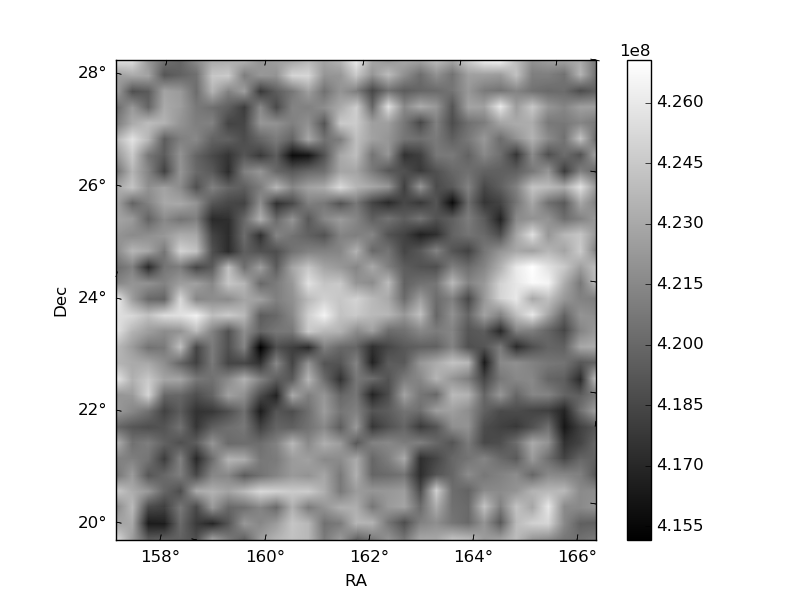
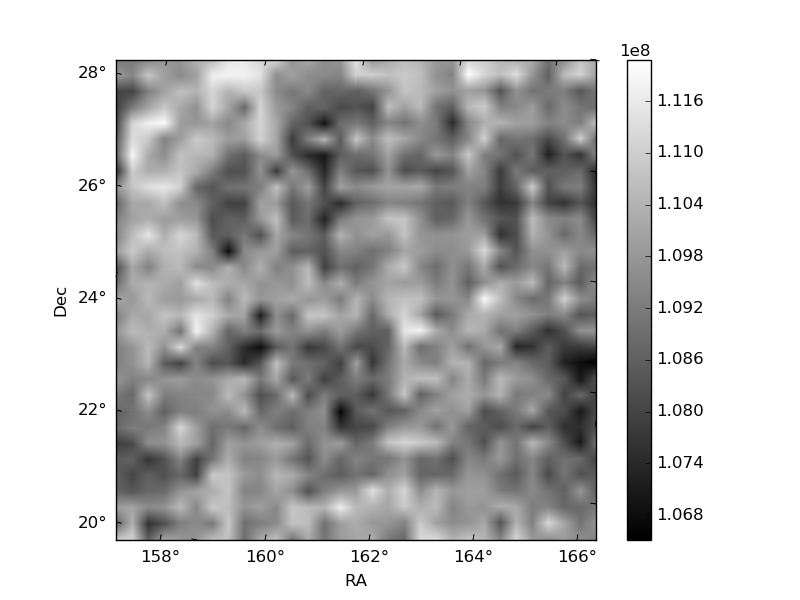
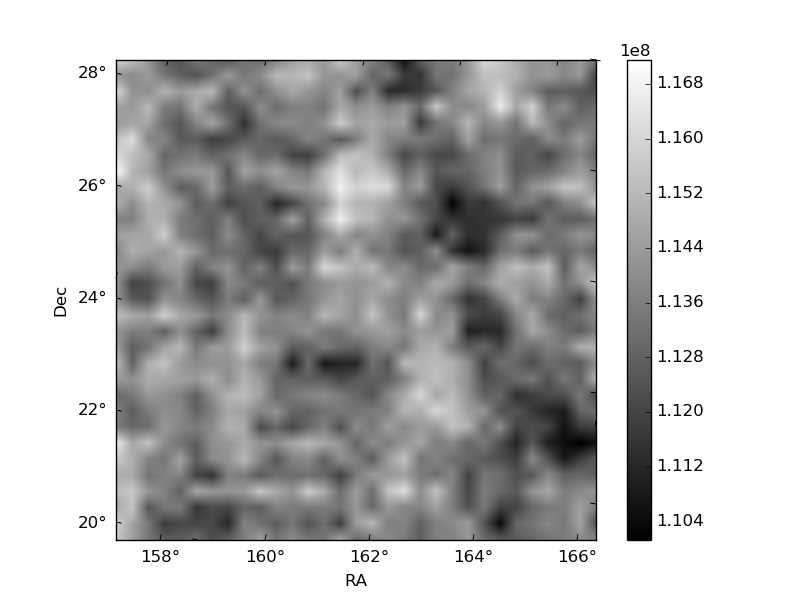
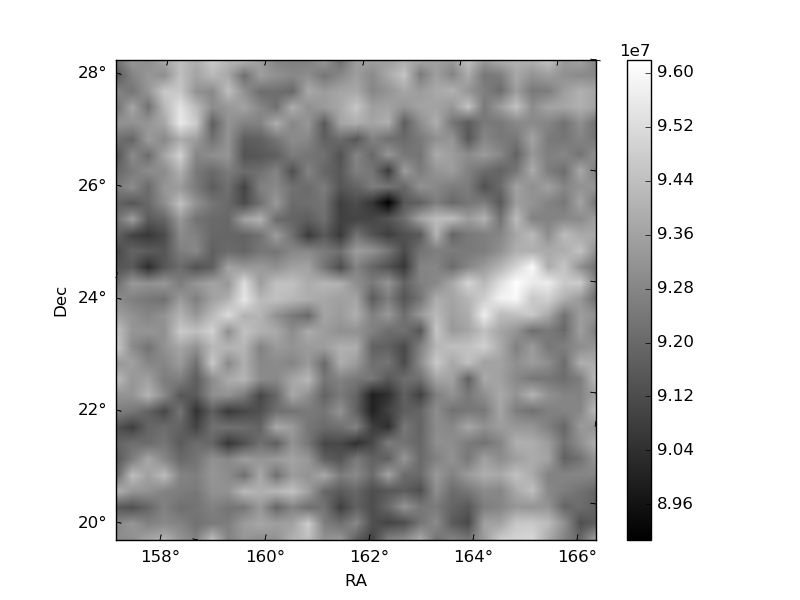
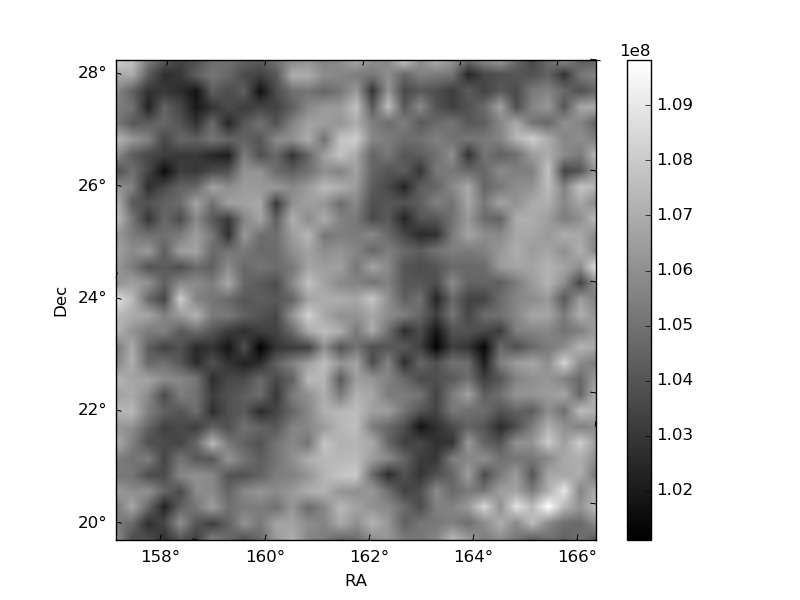
Histogram calculated using DETX and DETY for each event in the final _common_clean file
| Quadrant A | 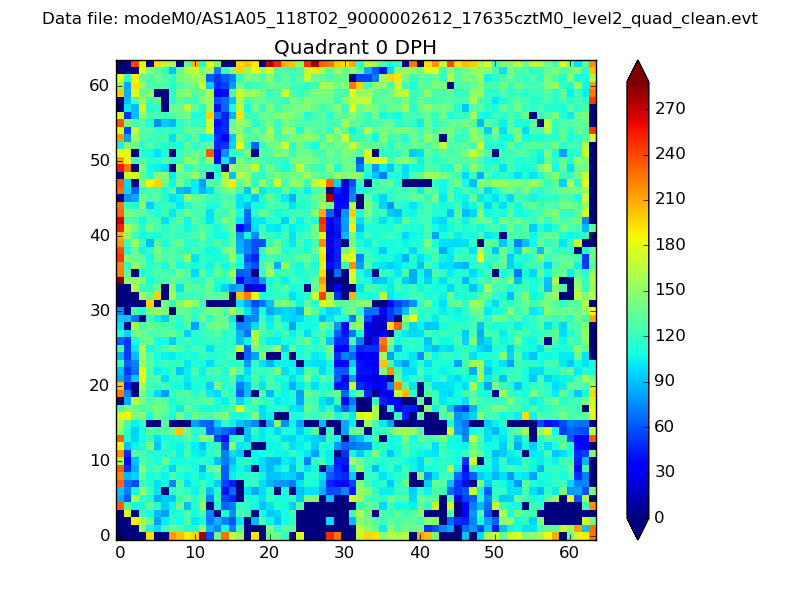 |
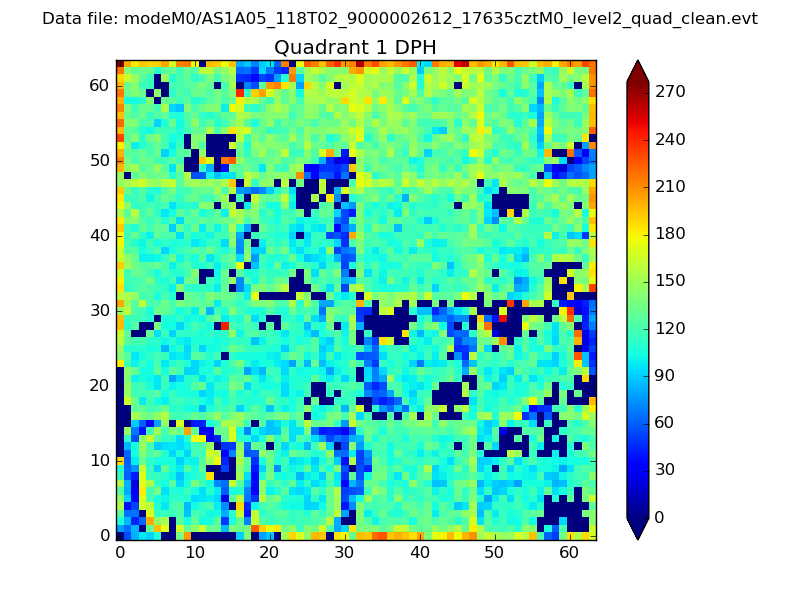 |
Quadrant B |
|---|---|---|---|
| Quadrant D |  |
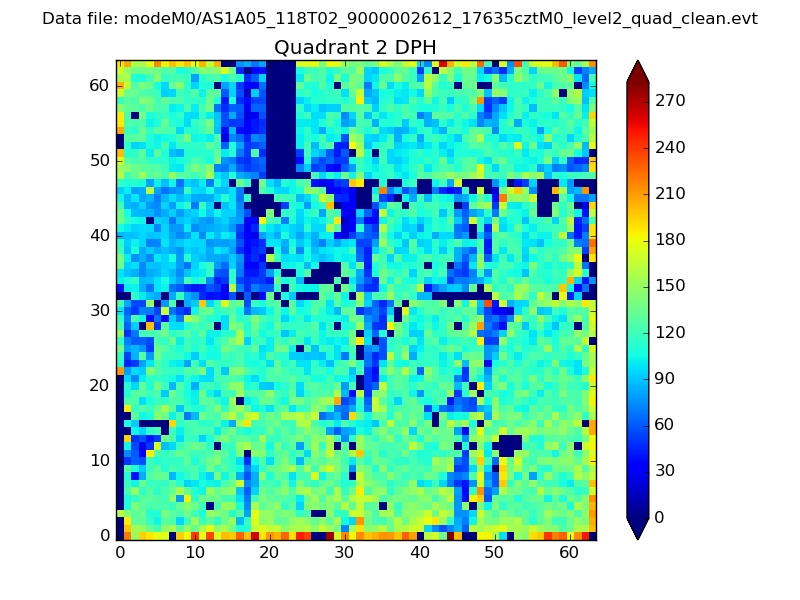 |
Quadrant C |
| Plot type | Count rate plots | Images |
|---|---|---|
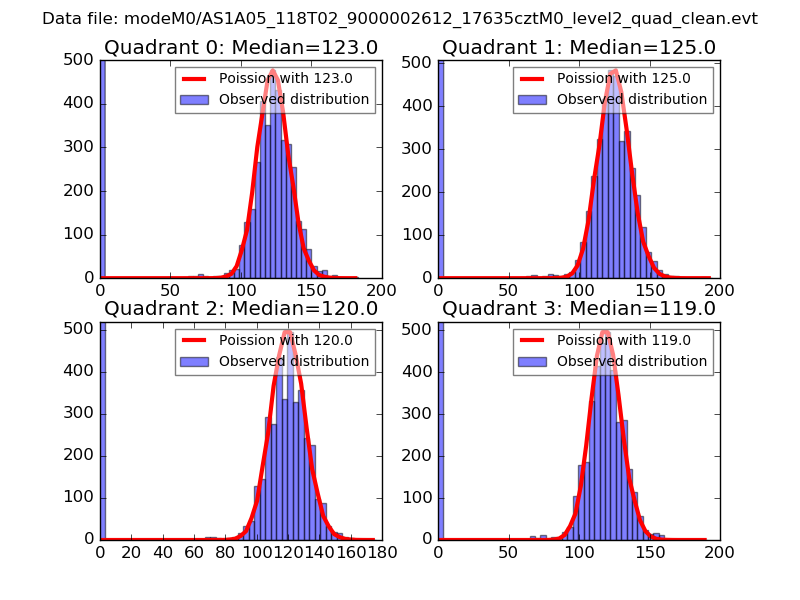
| Comparison with Poisson distribution Blue bars denote a histogram of data divided into 1 sec bins. Red curve is a Poisson curve with rate = median count rate of data. |
 |
 |
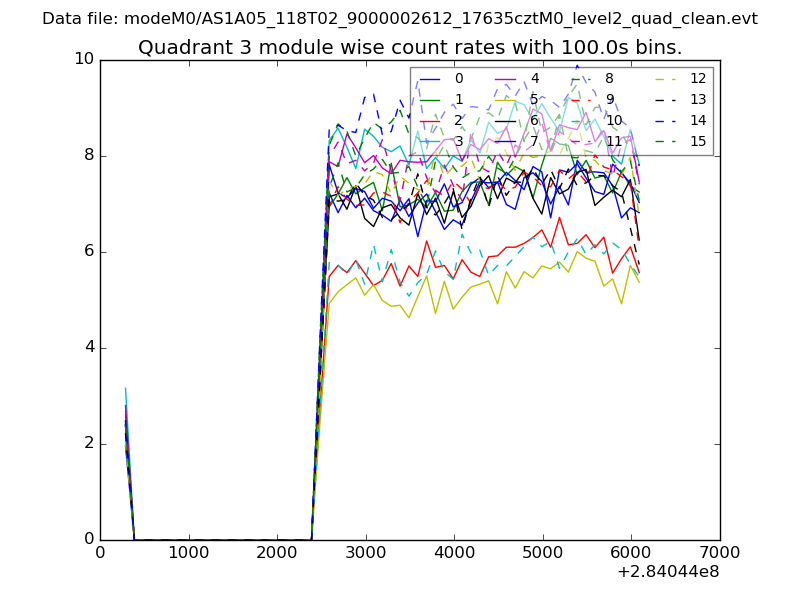
| Quadrant-wise count rates Data is divided into 100 sec bins |
 |
|
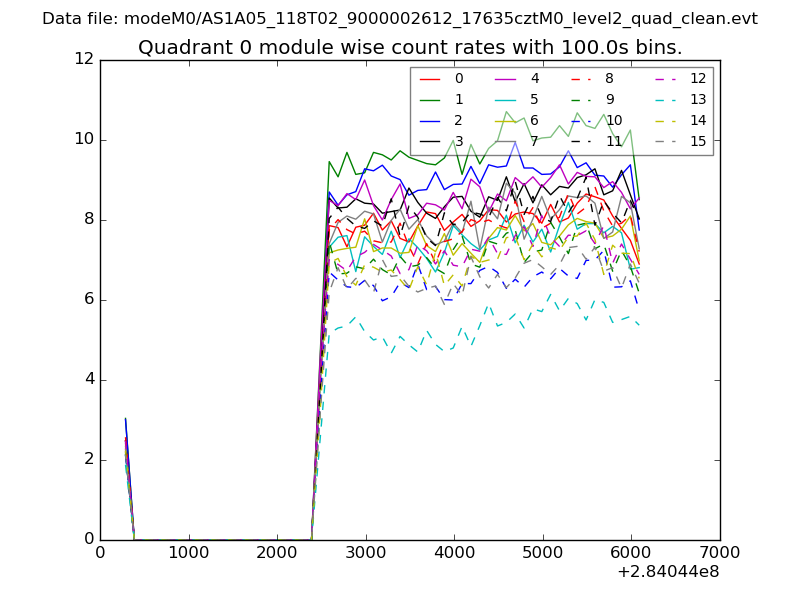
| Module-wise count rates for Quadrant A Data is divided into 100 sec bins |
 |
 |
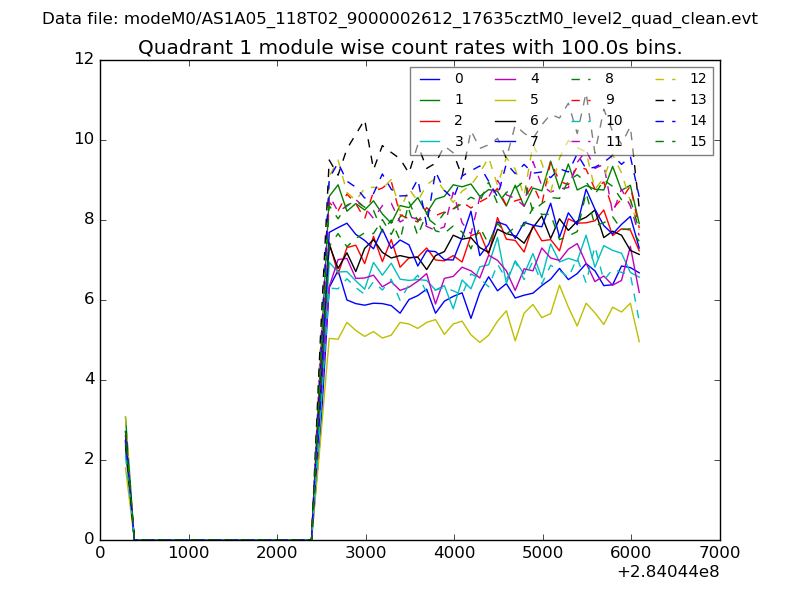
| Module-wise count rates for Quadrant B Data is divided into 100 sec bins |
 |
 |
| Module-wise count rates for Quadrant C Data is divided into 100 sec bins |
 |
 |
| Module-wise count rates for Quadrant D Data is divided into 100 sec bins |
 |
 |
| Parameter | Plot |
|---|---|
| CZT HV Monitor | 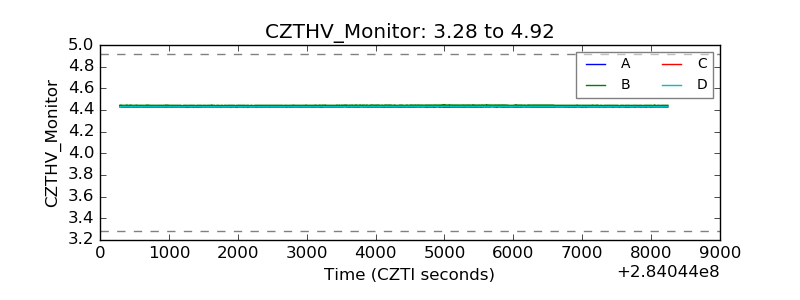 |
| D_VDD | 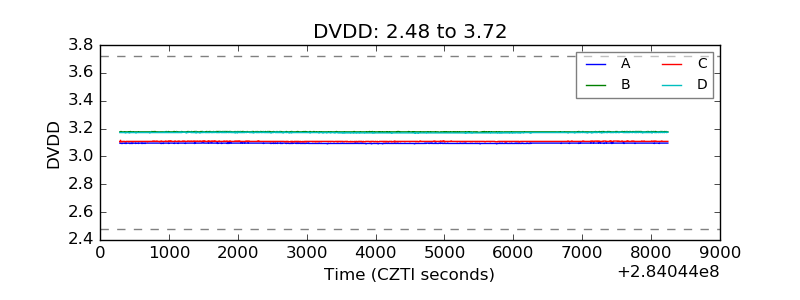 |
| Temperature 1 | 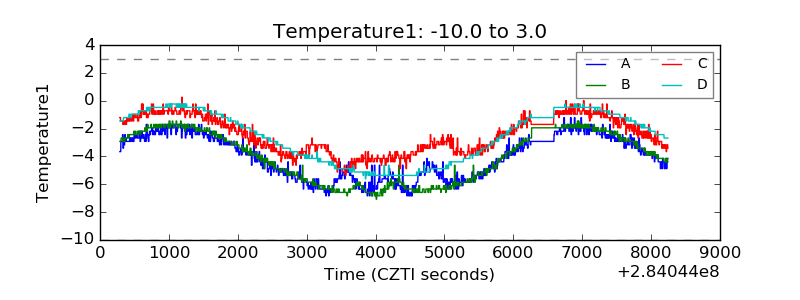 |
| Veto HV Monitor | 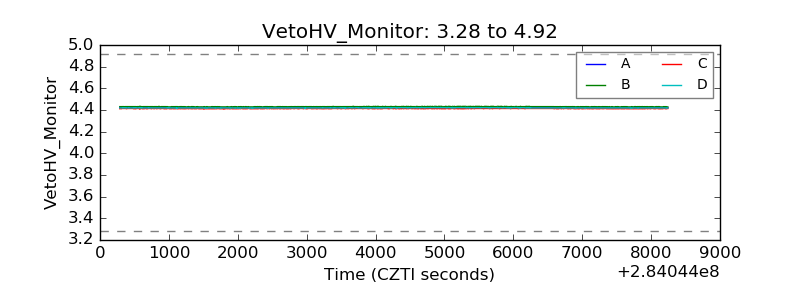 |
| Veto LLD | 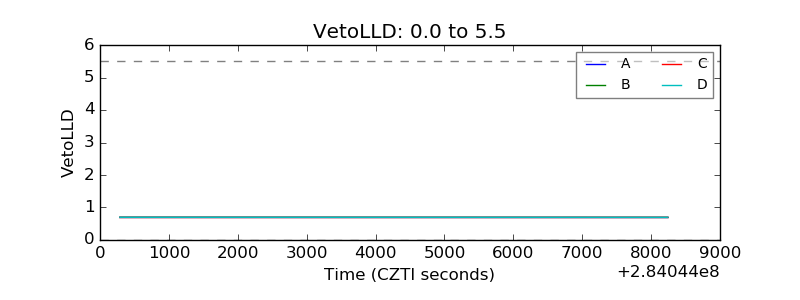 |
| Alpha Counter | 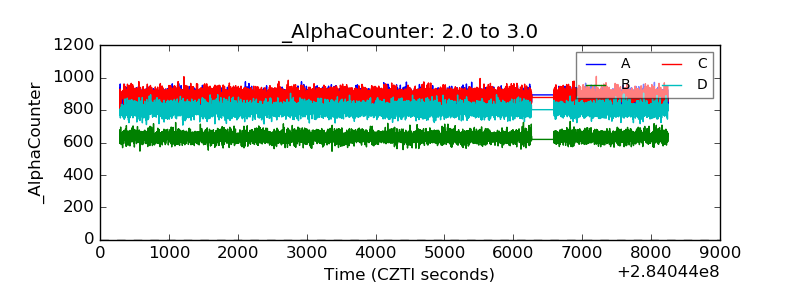 |
| _CPM_Rate | 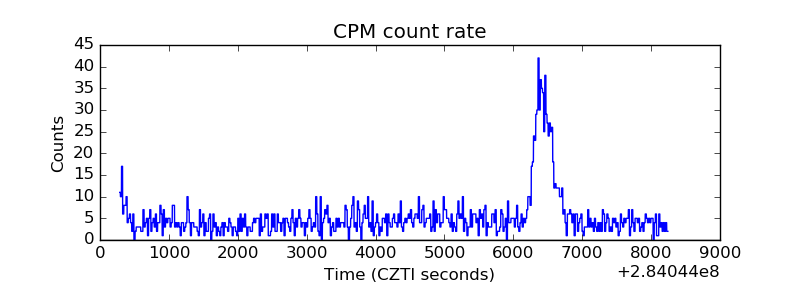 |
| CZT Counter | 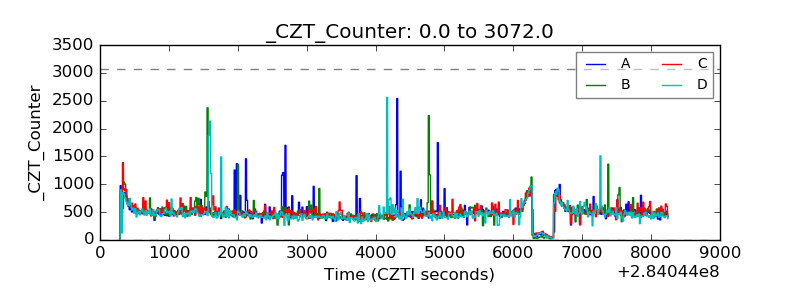 |
| +2.5 Volts monitor |  |
| +5 Volts monitor |  |
| _ROLL_ROT |  |
| _Roll_DEC | 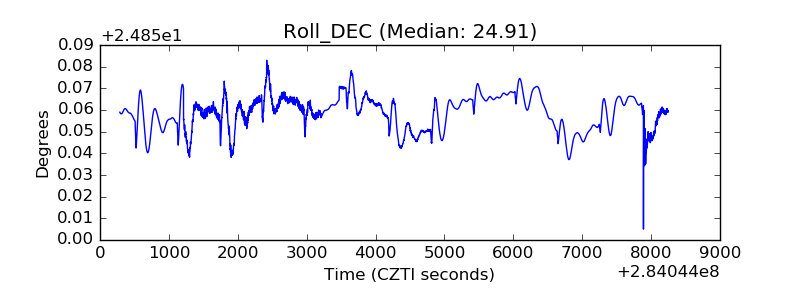 |
| _Roll_RA | 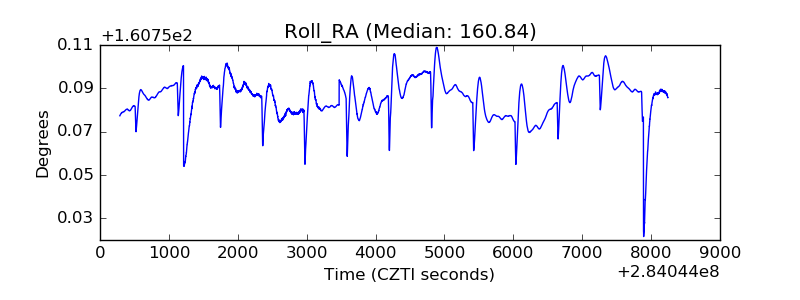 |
| Veto Counter | 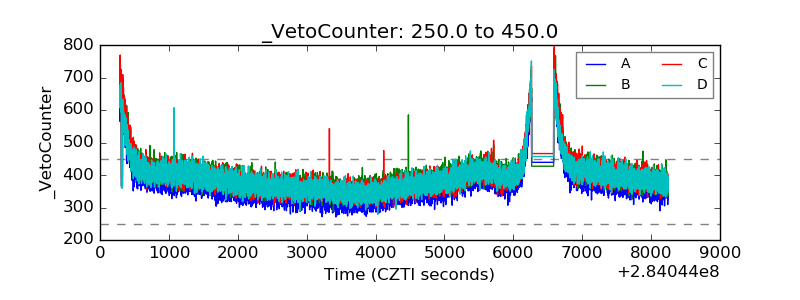 |