| Param | Original file | Final file |
|---|---|---|
| Filename | modeM0/AS1A05_118T02_9000002612_17638cztM0_level2.evt | modeM0/AS1A05_118T02_9000002612_17638cztM0_level2_quad_clean.evt |
| Size (bytes) | 307,428,480 | 60,675,840 |
| Size | 293.2 MB | 57.9 MB |
| Events in quadrant A | 2,323,406 | 379,331 |
| Events in quadrant B | 2,251,447 | 380,374 |
| Events in quadrant C | 2,249,356 | 368,968 |
| Events in quadrant D | 2,155,036 | 367,817 |
| Mode SS | |||
|---|---|---|---|
| Quadrant | BADHDUFLAG | Total packets | Discarded packets |
| A | 0 | 98 | 0 |
| B | 0 | 98 | 0 |
| C | 0 | 98 | 0 |
| D | 0 | 98 | 0 |
| Mode M0 | |||
|---|---|---|---|
| Quadrant | BADHDUFLAG | Total packets | Discarded packets |
| A | 0 | 10177 | 0 |
| B | 0 | 9961 | 0 |
| C | 0 | 9895 | 0 |
| D | 0 | 9986 | 0 |
| Quadrant | Total seconds | Saturated seconds | Saturation percentage |
|---|---|---|---|
| A | 4849 | 10 | 0.206228% |
| B | 4850 | 7 | 0.144330% |
| C | 4850 | 17 | 0.350515% |
| D | 4850 | 13 | 0.268041% |
Noise dominated data is calculated using 1-second bins in cleaned event files. If a bin has >2000 counts, and if more than 50% of those come from <1% of pixels, then it is considered to be noise-dominated and hence unusable.
| Quadrant | # 1 sec bins | Bins with >0 counts | Bins with >2000 counts | High rate bins dominated by noise | Noise dominated (total time) | Noise dominated (detector-on time) | Marked lightcurve |
|---|---|---|---|---|---|---|---|
| A | 4849 | 4849 | 3 | 3 | 0.06% | 0.06% | 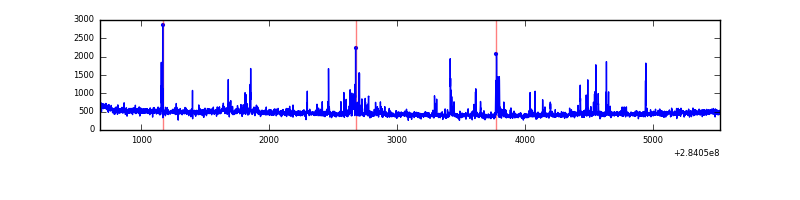 |
| B | 4850 | 4850 | 3 | 3 | 0.06% | 0.06% |  |
| C | 4850 | 4850 | 0 | 0 | 0.00% | 0.00% | 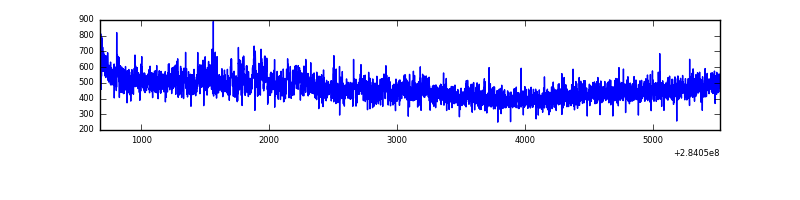 |
| D | 4850 | 4850 | 8 | 8 | 0.16% | 0.16% | 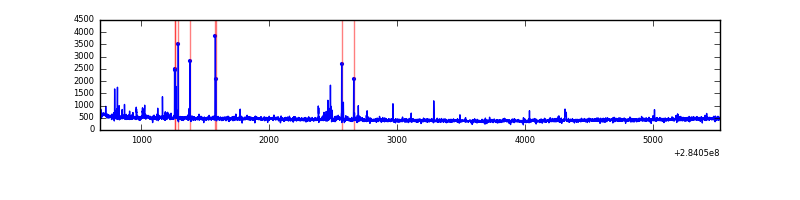 |
Top three noisy pixels from each quadrant. If the there are fewer than three noisy pixels in the level2.evt file, extra rows are filled as -1
| Pixel properties | Quadrant properties | ||||||
|---|---|---|---|---|---|---|---|
| Quadrant | DetID | PixID | Counts | Sigma | Mean | Median | Sigma |
| A | 14 | 237 | 171025 | 1487.22 | 559 | 549 | 114.6 |
| A | 0 | 226 | 4939 | 38.3 | 559 | 549 | 114.6 |
| A | 3 | 137 | 4165 | 31.55 | 559 | 549 | 114.6 |
| B | 7 | 220 | 15160 | 134.01 | 559 | 545 | 109.1 |
| B | 12 | 111 | 12728 | 111.71 | 559 | 545 | 109.1 |
| B | 11 | 111 | 11072 | 96.53 | 559 | 545 | 109.1 |
| C | 14 | 238 | 81840 | 639.74 | 536 | 538 | 127.1 |
| C | 3 | 233 | 72767 | 568.35 | 536 | 538 | 127.1 |
| C | 13 | 61 | 3799 | 25.66 | 536 | 538 | 127.1 |
| D | 13 | 189 | 68622 | 509.83 | 544 | 529 | 133.6 |
| D | 2 | 234 | 20139 | 146.82 | 544 | 529 | 133.6 |
| D | 10 | 70 | 7993 | 55.88 | 544 | 529 | 133.6 |
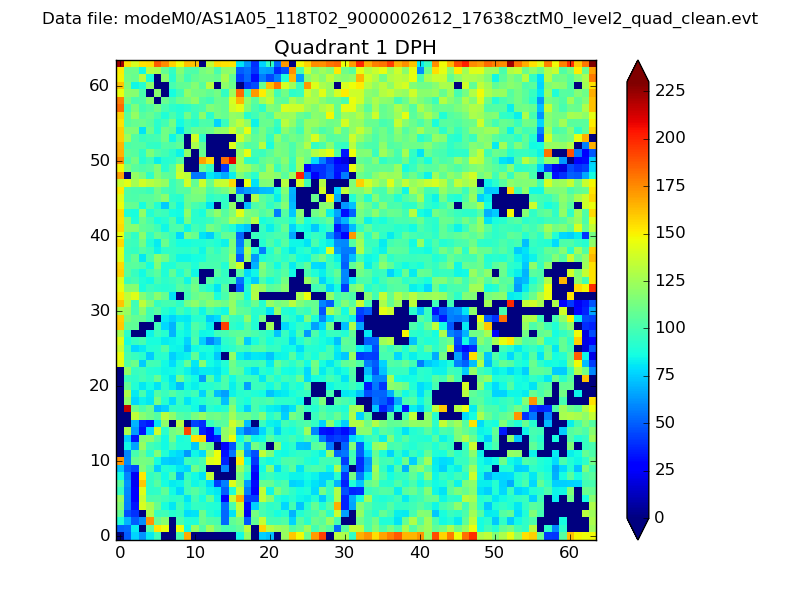
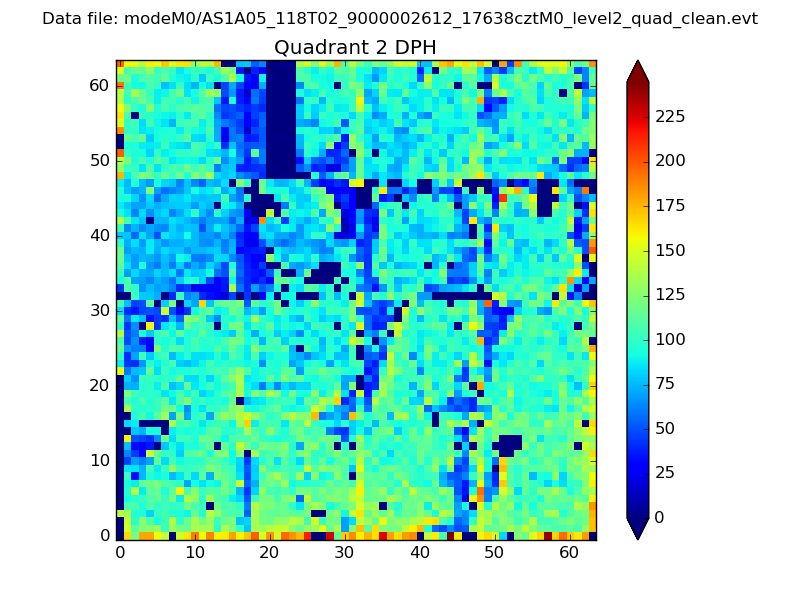
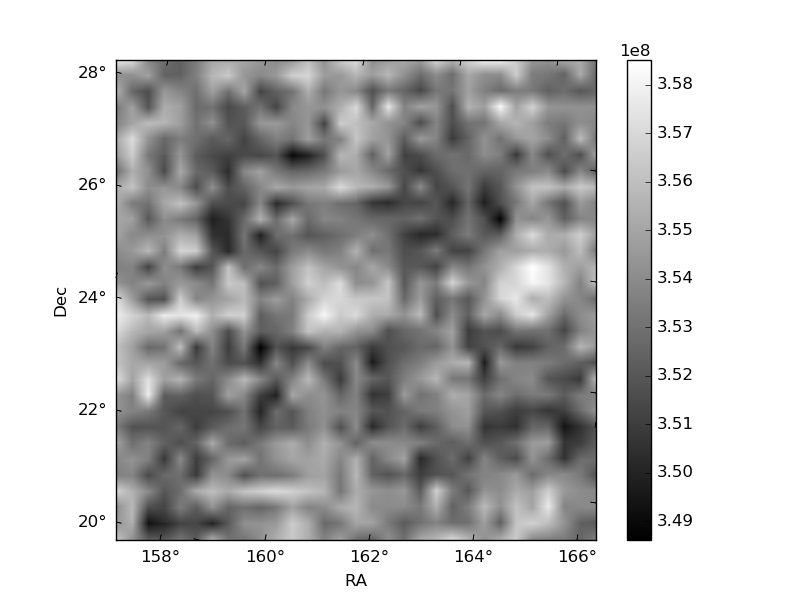
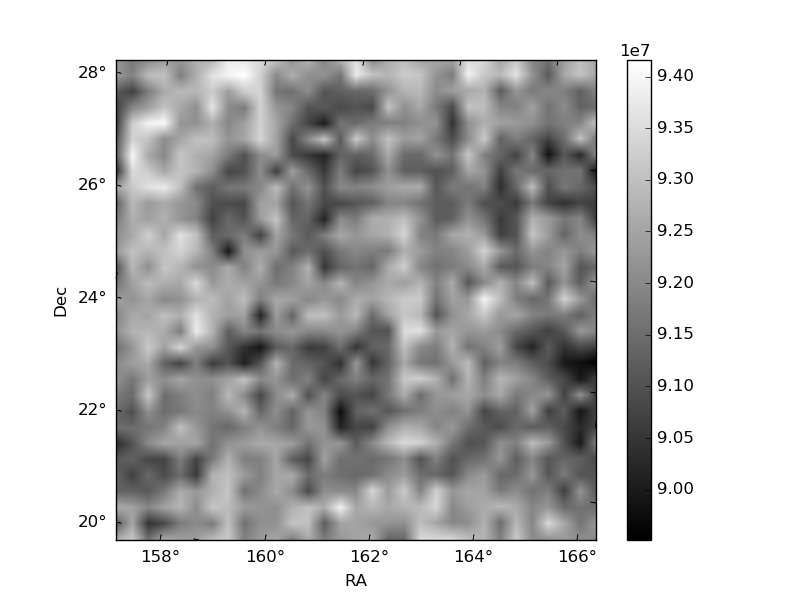
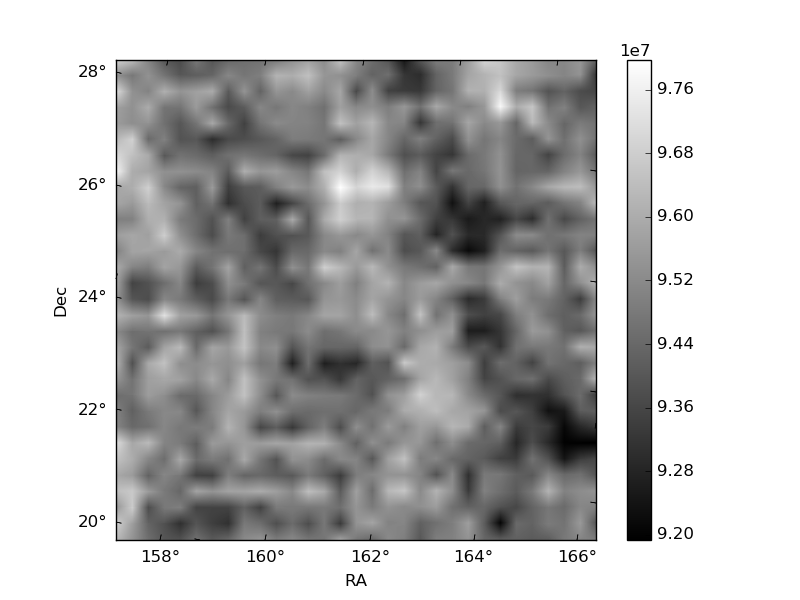
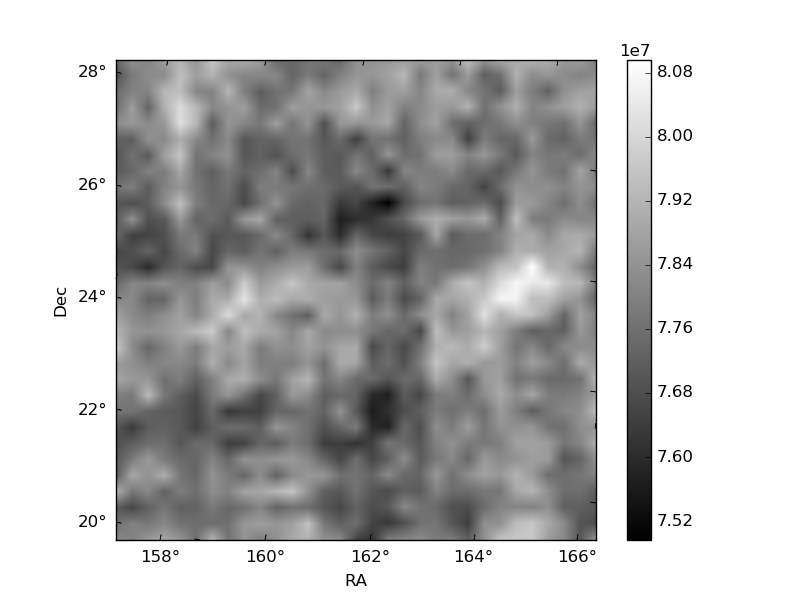
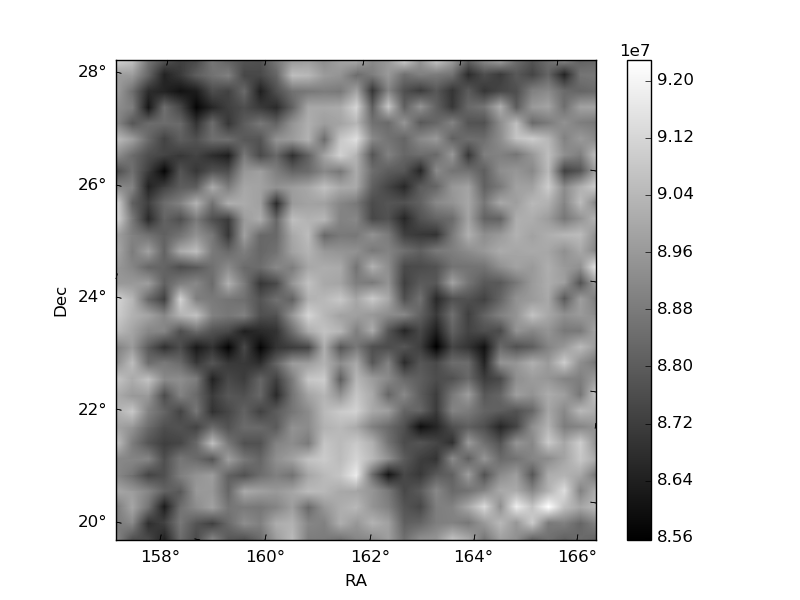
Histogram calculated using DETX and DETY for each event in the final _common_clean file
| Quadrant A | 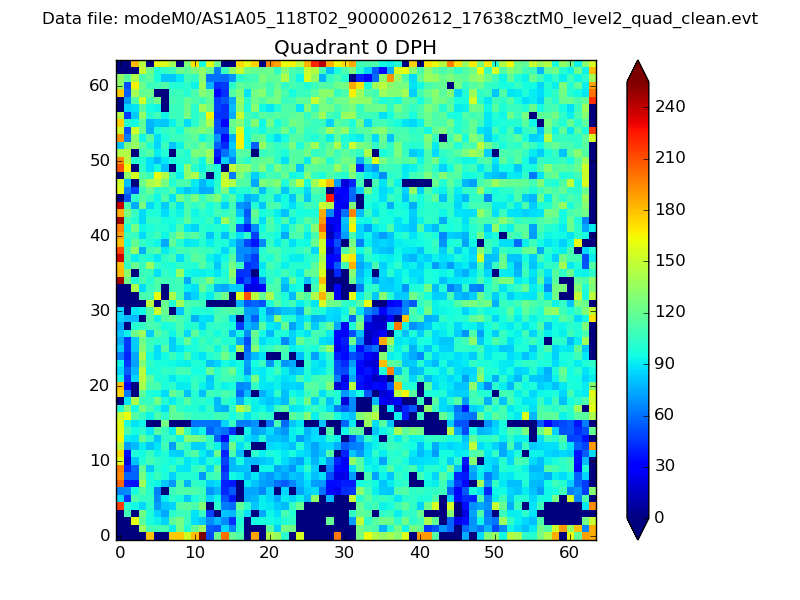 |
 |
Quadrant B |
|---|---|---|---|
| Quadrant D | 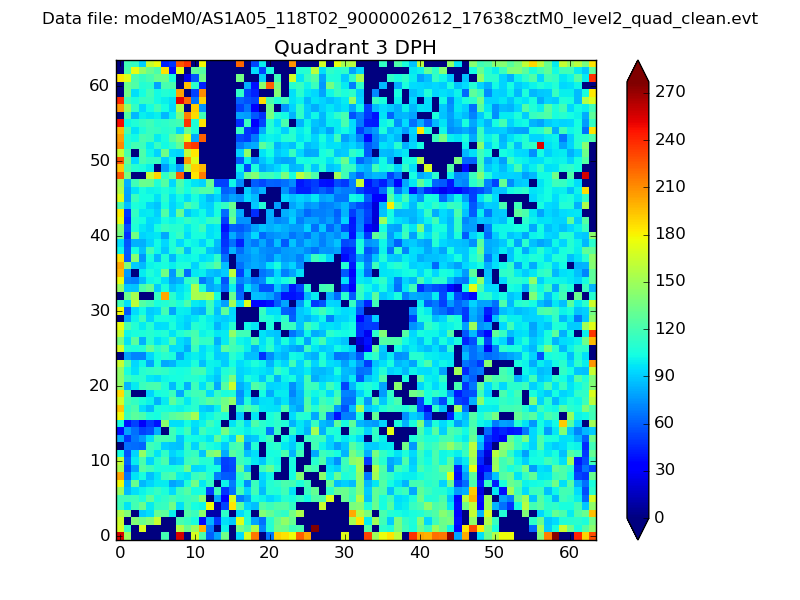 |
 |
Quadrant C |
| Plot type | Count rate plots | Images |
|---|---|---|
| Comparison with Poisson distribution Blue bars denote a histogram of data divided into 1 sec bins. Red curve is a Poisson curve with rate = median count rate of data. |
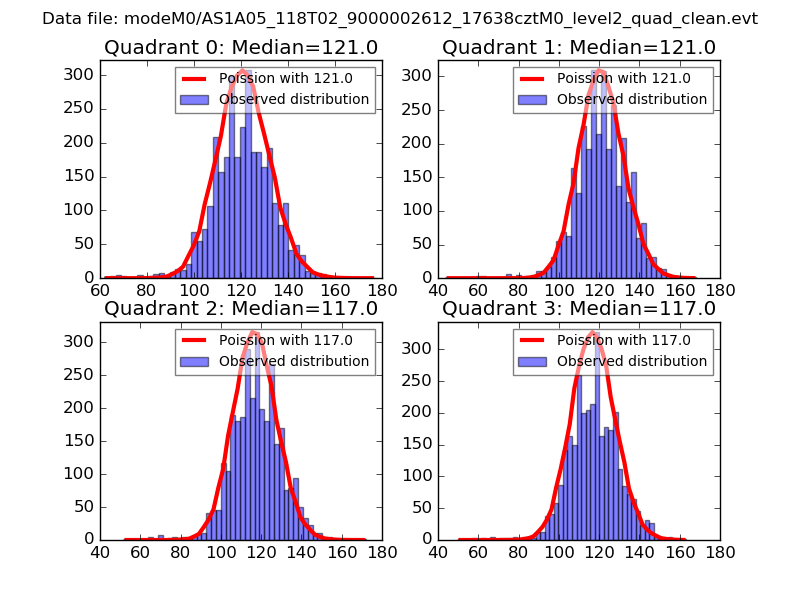 |
 |
| Quadrant-wise count rates Data is divided into 100 sec bins |
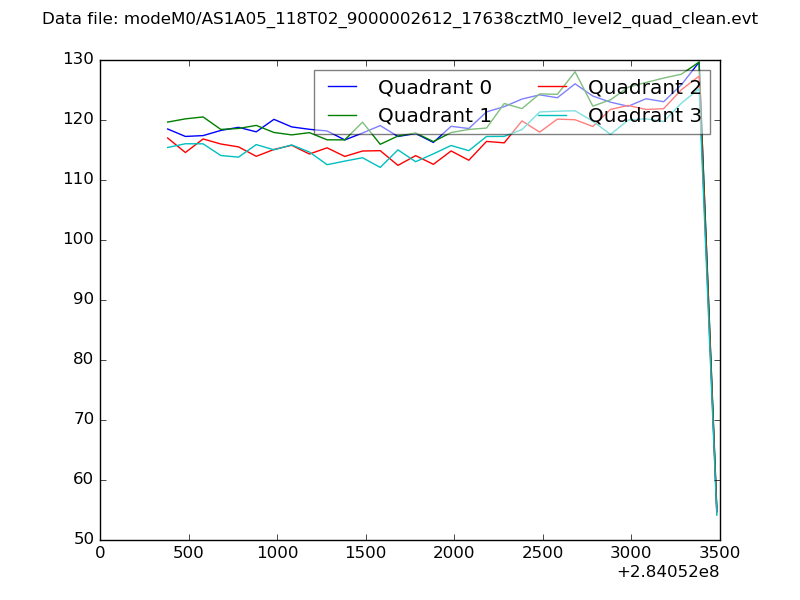 |
|
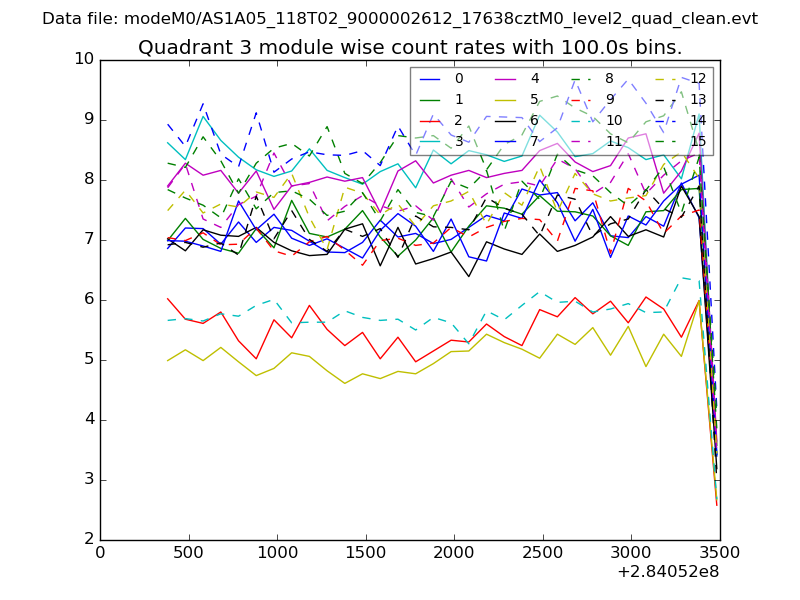
| Module-wise count rates for Quadrant A Data is divided into 100 sec bins |
 |
 |
| Module-wise count rates for Quadrant B Data is divided into 100 sec bins |
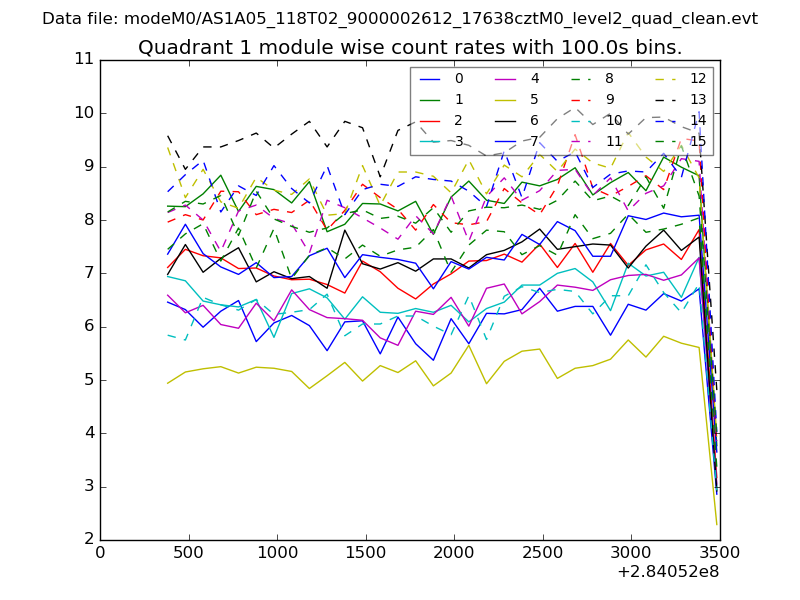 |
 |
| Module-wise count rates for Quadrant C Data is divided into 100 sec bins |
 |
 |
| Module-wise count rates for Quadrant D Data is divided into 100 sec bins |
 |
 |
| Parameter | Plot |
|---|---|
| CZT HV Monitor | 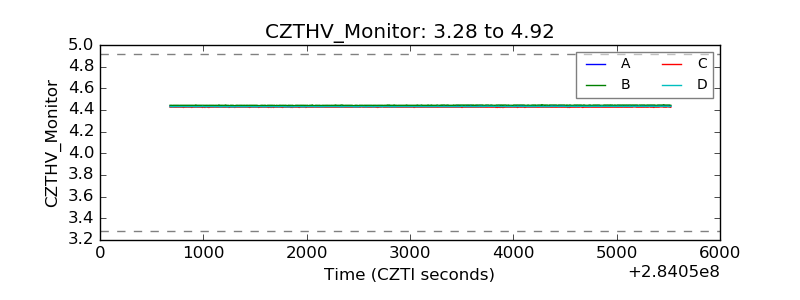 |
| D_VDD | 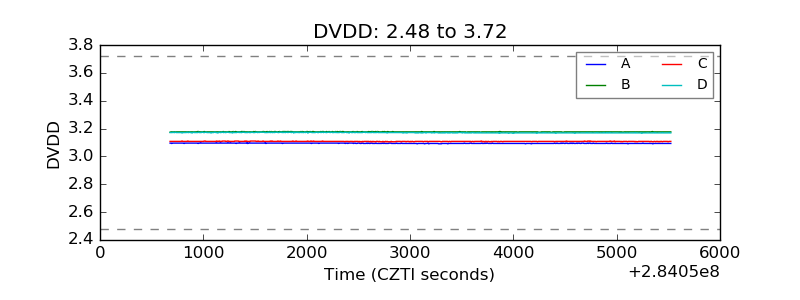 |
| Temperature 1 | 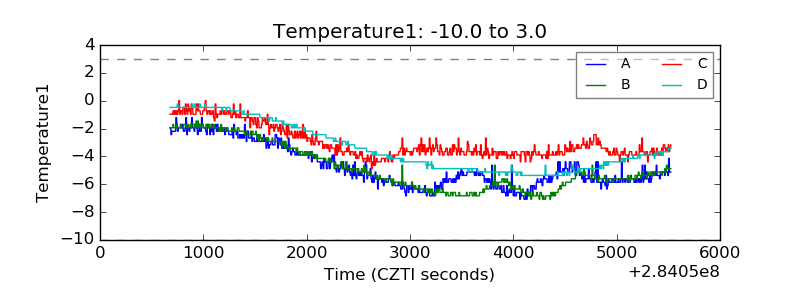 |
| Veto HV Monitor | 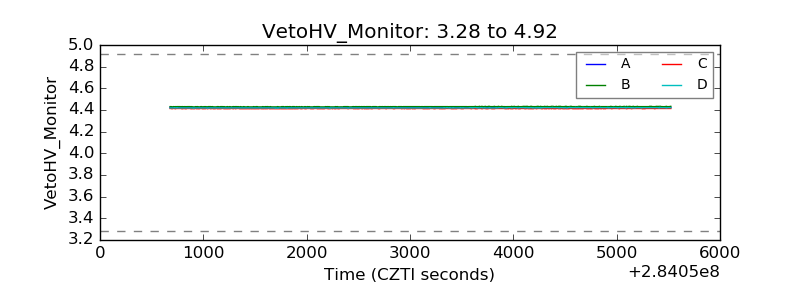 |
| Veto LLD | 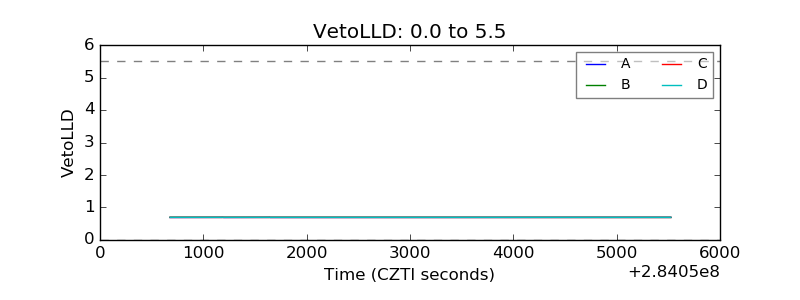 |
| Alpha Counter | 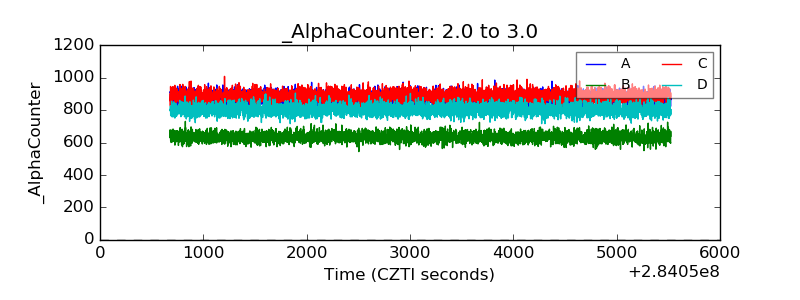 |
| _CPM_Rate | 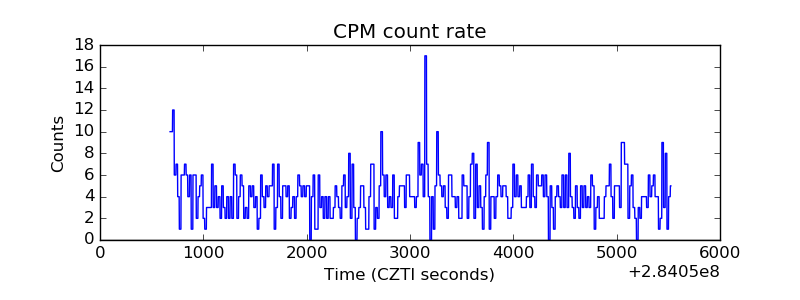 |
| CZT Counter | 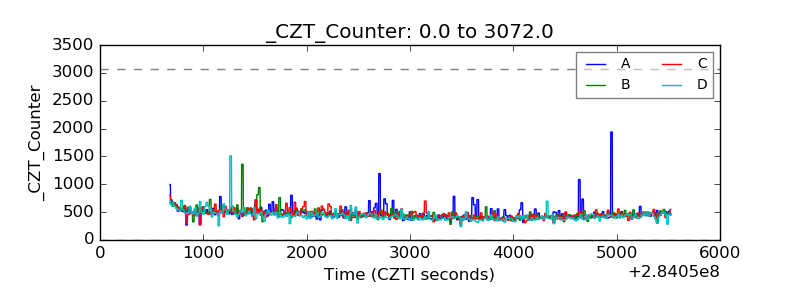 |
| +2.5 Volts monitor |  |
| +5 Volts monitor |  |
| _ROLL_ROT | 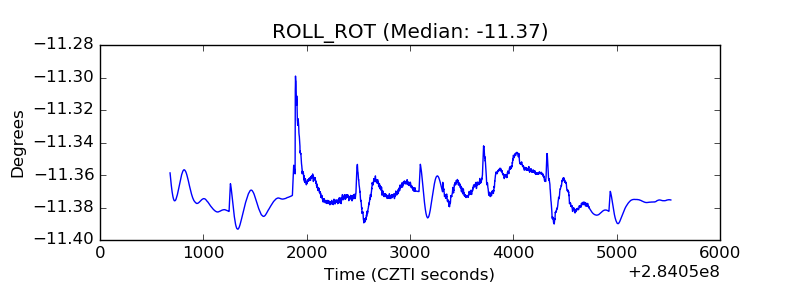 |
| _Roll_DEC | 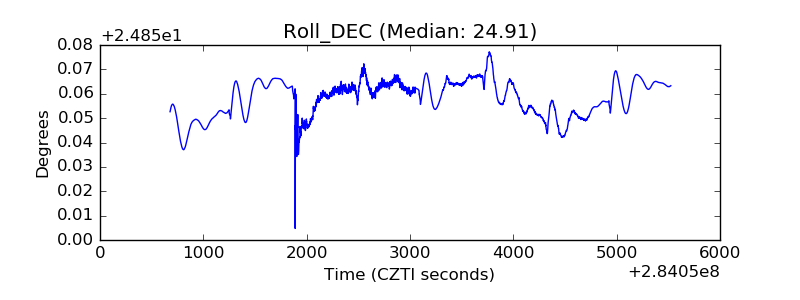 |
| _Roll_RA | 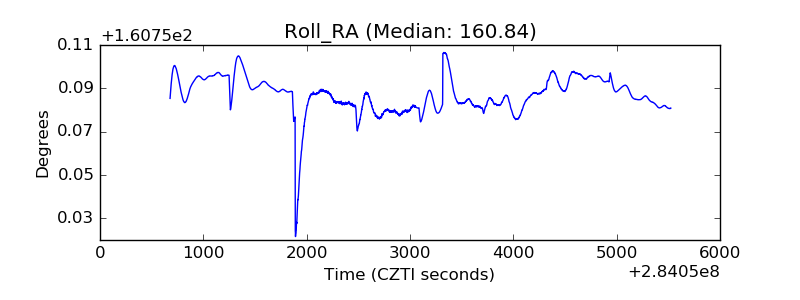 |
| Veto Counter |  |