| Param | Original file | Final file |
|---|---|---|
| Filename | modeM0/AS1A05_118T02_9000002612_17641cztM0_level2.evt | modeM0/AS1A05_118T02_9000002612_17641cztM0_level2_quad_clean.evt |
| Size (bytes) | 539,752,320 | 105,356,160 |
| Size | 514.7 MB | 100.5 MB |
| Events in quadrant A | 3,426,766 | 683,562 |
| Events in quadrant B | 3,565,459 | 699,318 |
| Events in quadrant C | 3,751,504 | 661,926 |
| Events in quadrant D | 5,108,122 | 638,479 |
| Mode SS | |||
|---|---|---|---|
| Quadrant | BADHDUFLAG | Total packets | Discarded packets |
| A | 0 | 150 | 0 |
| B | 0 | 150 | 0 |
| C | 0 | 150 | 0 |
| D | 0 | 150 | 0 |
| Mode M0 | |||
|---|---|---|---|
| Quadrant | BADHDUFLAG | Total packets | Discarded packets |
| A | 0 | 15064 | 2 |
| B | 0 | 15367 | 2 |
| C | 0 | 15572 | 2 |
| D | 0 | 20266 | 2 |
| Mode M9 | |||
|---|---|---|---|
| Quadrant | BADHDUFLAG | Total packets | Discarded packets |
| A | 0 | 21 | 0 |
| B | 0 | 21 | 0 |
| C | 0 | 21 | 0 |
| D | 0 | 21 | 0 |
| Quadrant | Total seconds | Saturated seconds | Saturation percentage |
|---|---|---|---|
| A | 7288 | 34 | 0.466520% |
| B | 7288 | 60 | 0.823271% |
| C | 7289 | 98 | 1.344492% |
| D | 7289 | 292 | 4.006036% |
Noise dominated data is calculated using 1-second bins in cleaned event files. If a bin has >2000 counts, and if more than 50% of those come from <1% of pixels, then it is considered to be noise-dominated and hence unusable.
| Quadrant | # 1 sec bins | Bins with >0 counts | Bins with >2000 counts | High rate bins dominated by noise | Noise dominated (total time) | Noise dominated (detector-on time) | Marked lightcurve |
|---|---|---|---|---|---|---|---|
| A | 9348 | 7290 | 0 | 0 | 0.00% | 0.00% | 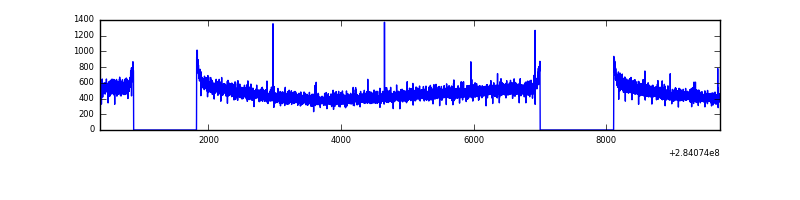 |
| B | 9348 | 7290 | 3 | 3 | 0.03% | 0.04% | 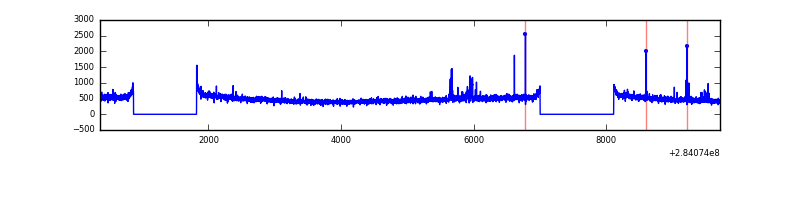 |
| C | 9349 | 7291 | 0 | 0 | 0.00% | 0.00% | 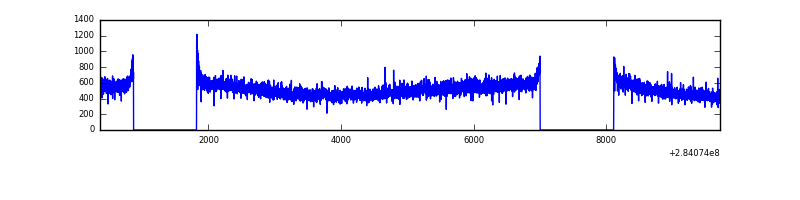 |
| D | 9349 | 7290 | 123 | 123 | 1.32% | 1.69% | 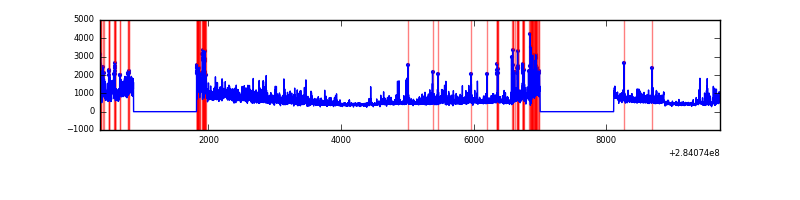 |
Top three noisy pixels from each quadrant. If the there are fewer than three noisy pixels in the level2.evt file, extra rows are filled as -1
| Pixel properties | Quadrant properties | ||||||
|---|---|---|---|---|---|---|---|
| Quadrant | DetID | PixID | Counts | Sigma | Mean | Median | Sigma |
| A | 4 | 2 | 7856 | 38.67 | 890 | 871 | 180.6 |
| A | 0 | 226 | 7662 | 37.59 | 890 | 871 | 180.6 |
| A | 12 | 194 | 6586 | 31.64 | 890 | 871 | 180.6 |
| B | 0 | 230 | 41353 | 240.11 | 891 | 870 | 168.6 |
| B | 12 | 111 | 20330 | 115.42 | 891 | 870 | 168.6 |
| B | 11 | 111 | 17468 | 98.44 | 891 | 870 | 168.6 |
| C | 3 | 233 | 263666 | 1318.15 | 854 | 861 | 199.4 |
| C | 14 | 238 | 132866 | 662.1 | 854 | 861 | 199.4 |
| C | 5 | 218 | 25380 | 122.98 | 854 | 861 | 199.4 |
| D | 1 | 52 | 1541847 | 7507.43 | 845 | 821 | 205.3 |
| D | 13 | 189 | 323931 | 1574.1 | 845 | 821 | 205.3 |
| D | 12 | 235 | 36576 | 174.19 | 845 | 821 | 205.3 |
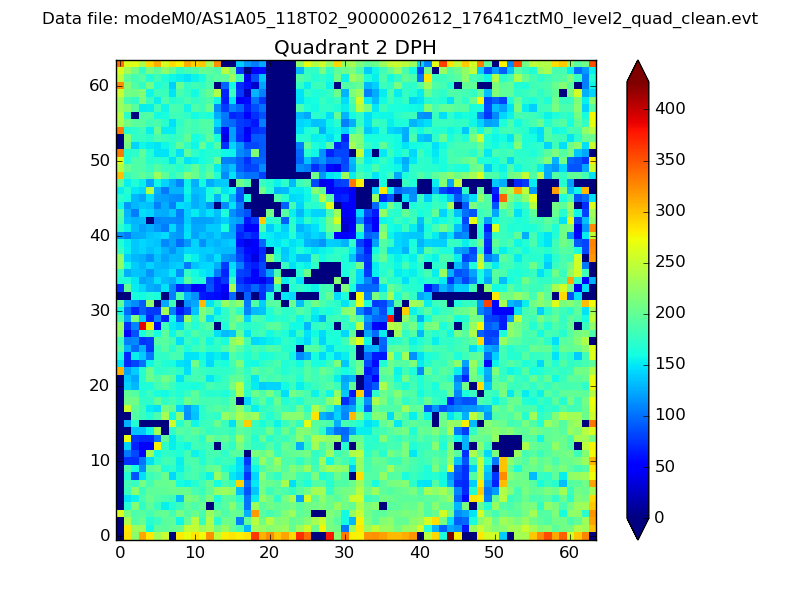
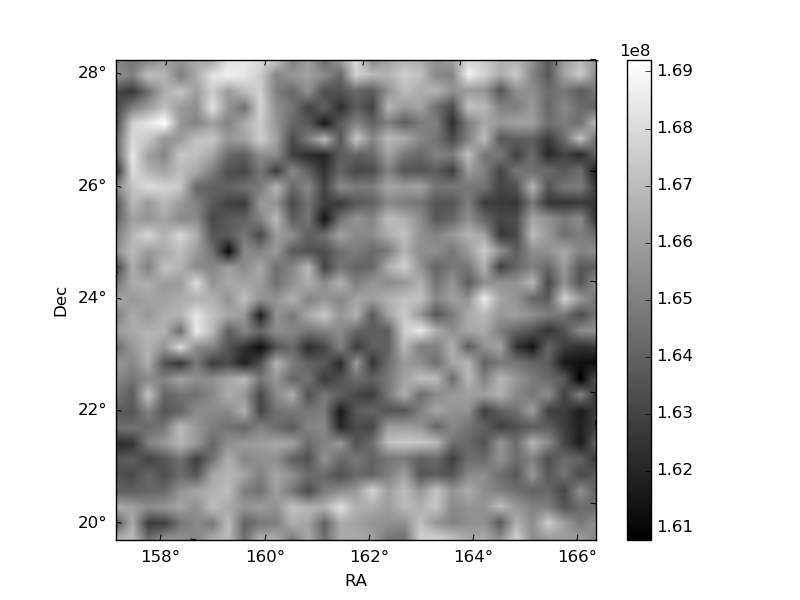
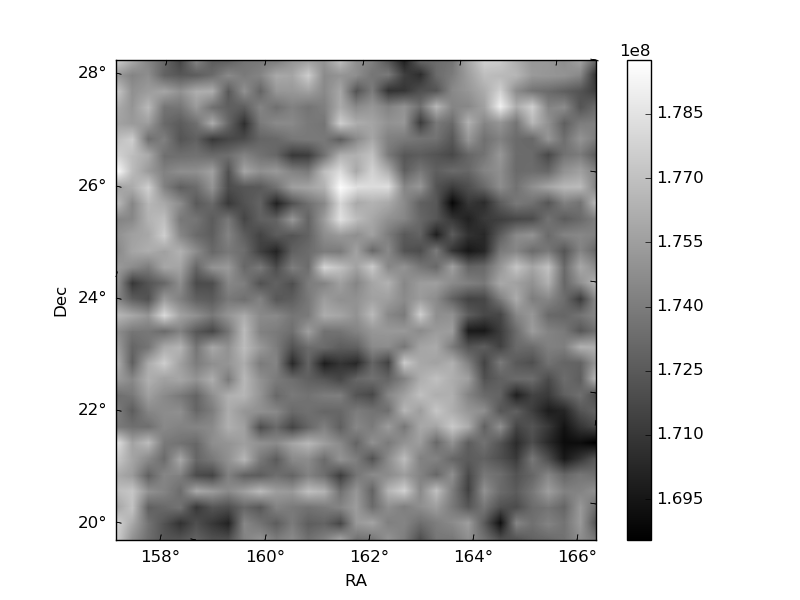
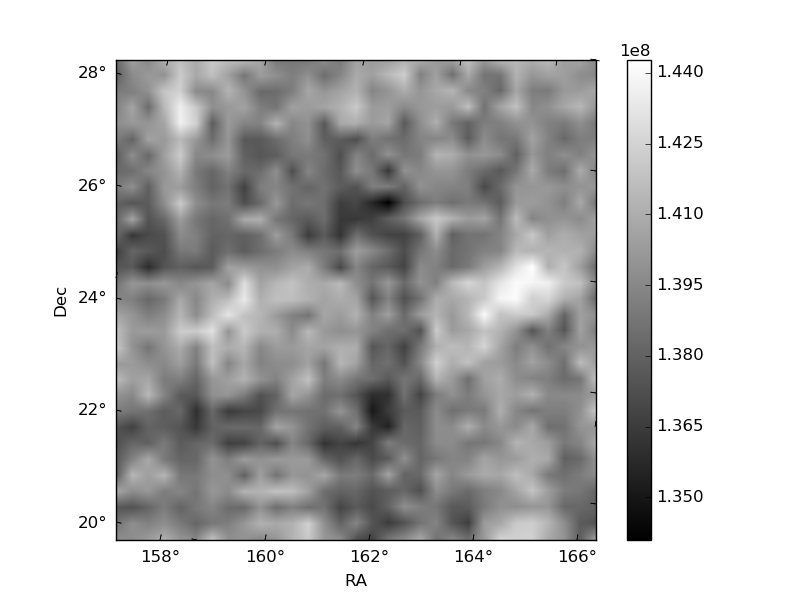
Histogram calculated using DETX and DETY for each event in the final _common_clean file
| Quadrant A | 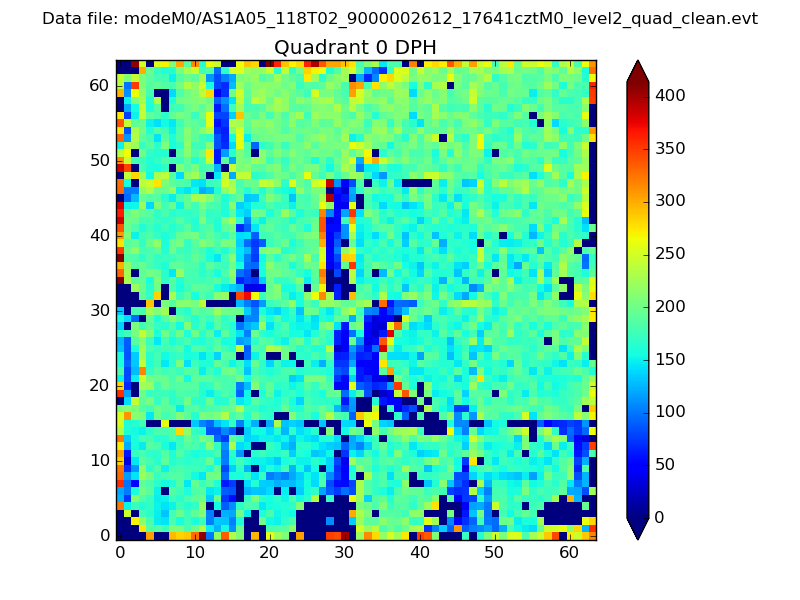 |
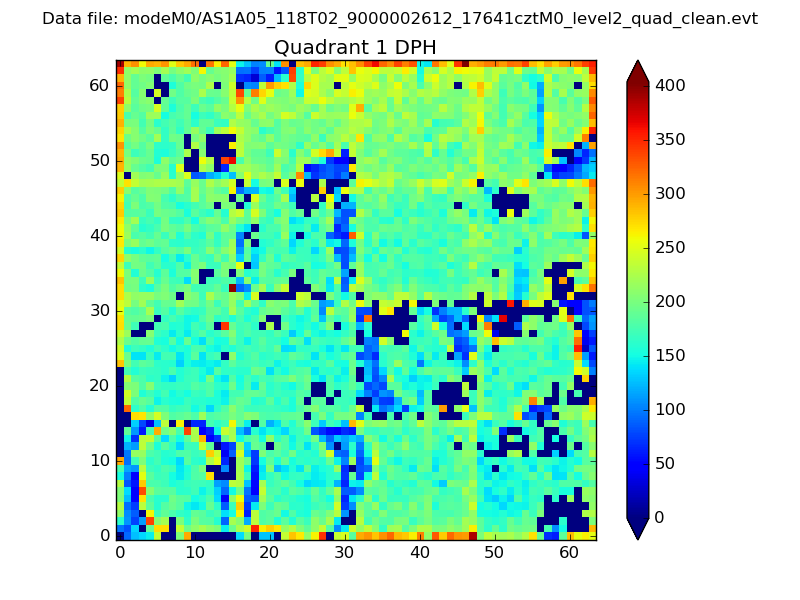 |
Quadrant B |
|---|---|---|---|
| Quadrant D | 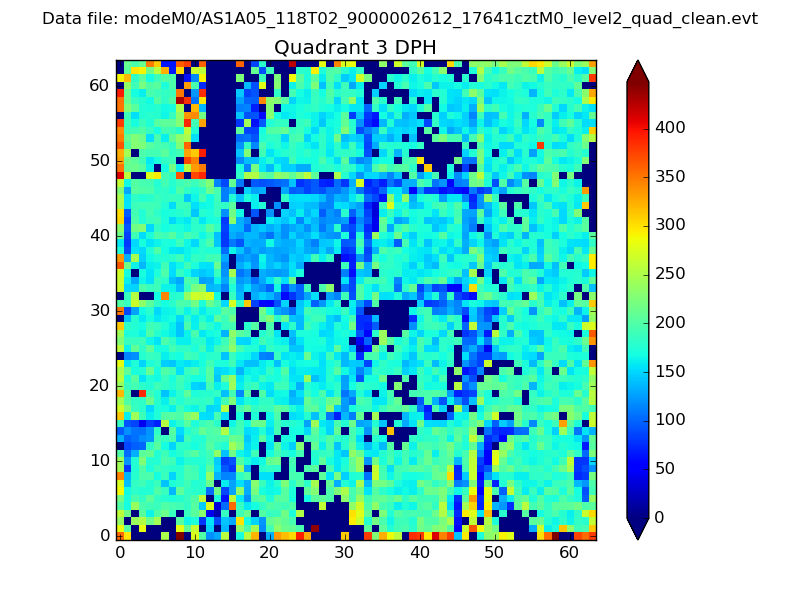 |
 |
Quadrant C |
| Plot type | Count rate plots | Images |
|---|---|---|
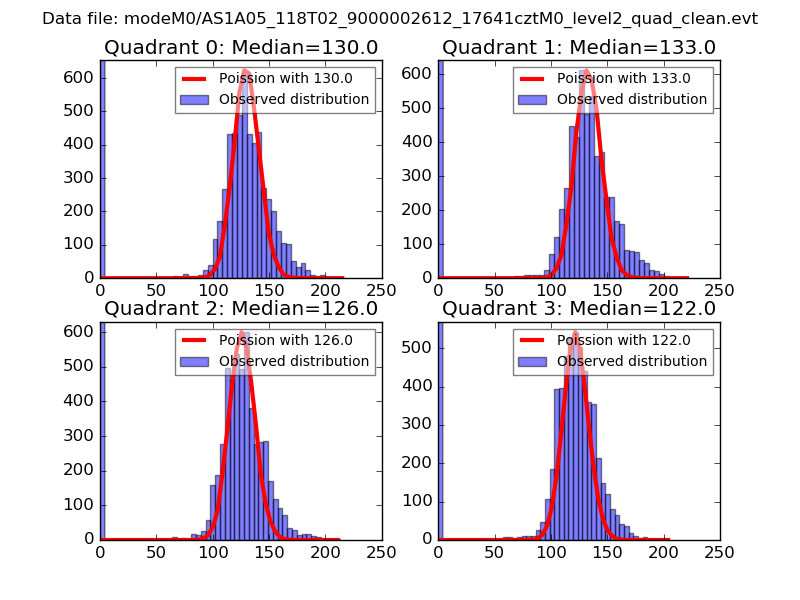
| Comparison with Poisson distribution Blue bars denote a histogram of data divided into 1 sec bins. Red curve is a Poisson curve with rate = median count rate of data. |
 |
 |
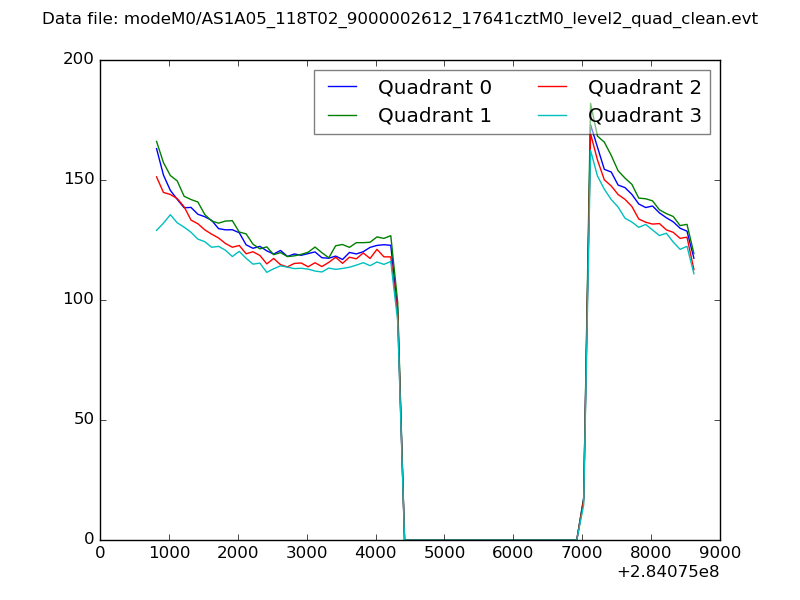
| Quadrant-wise count rates Data is divided into 100 sec bins |
 |
|
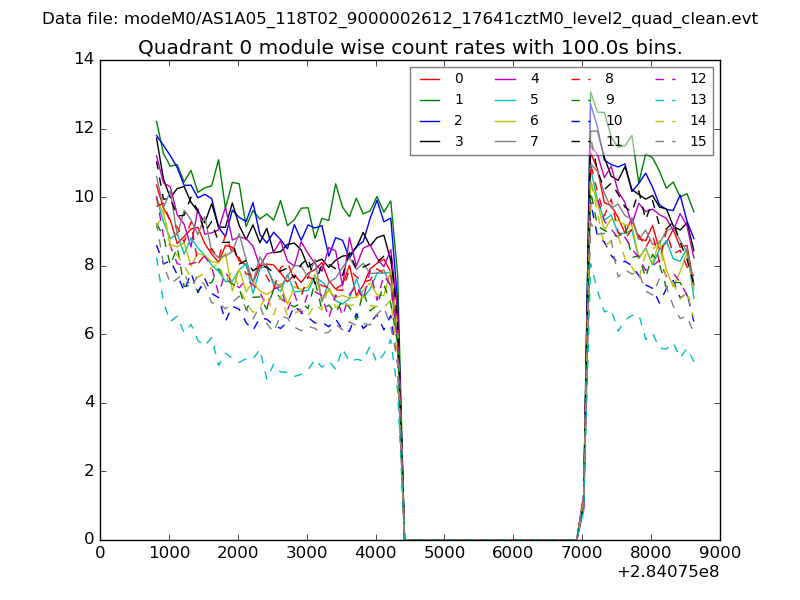
| Module-wise count rates for Quadrant A Data is divided into 100 sec bins |
 |
 |
| Module-wise count rates for Quadrant B Data is divided into 100 sec bins |
 |
 |
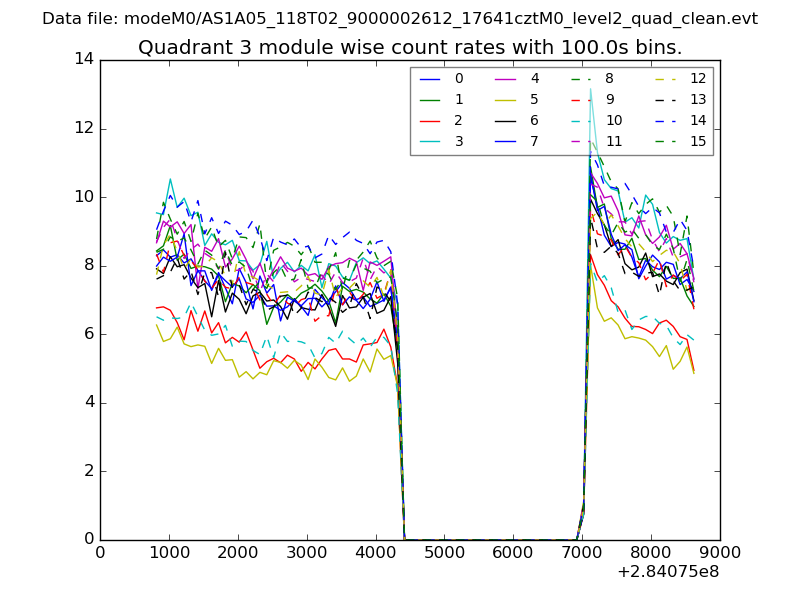
| Module-wise count rates for Quadrant C Data is divided into 100 sec bins |
 |
 |
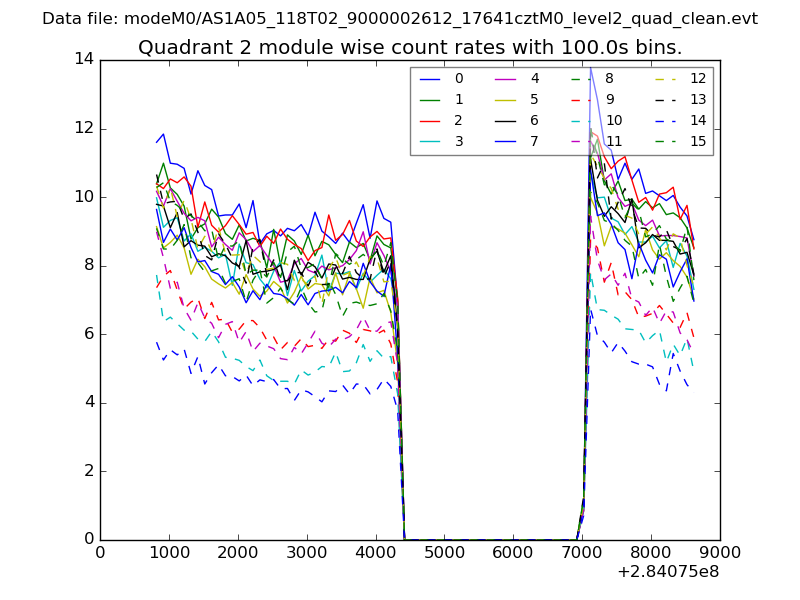
| Module-wise count rates for Quadrant D Data is divided into 100 sec bins |
 |
 |
| Parameter | Plot |
|---|---|
| CZT HV Monitor | 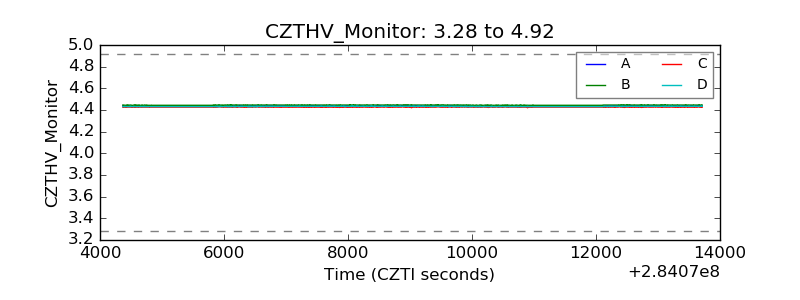 |
| D_VDD | 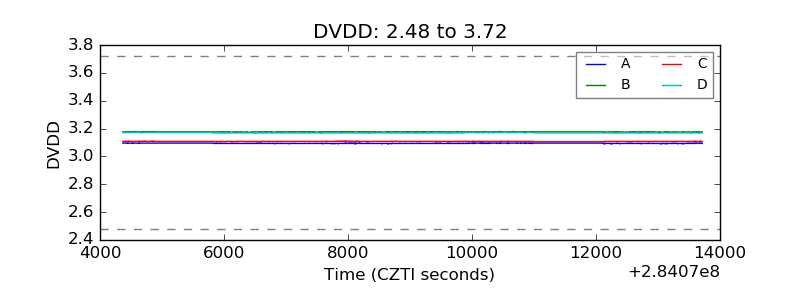 |
| Temperature 1 | 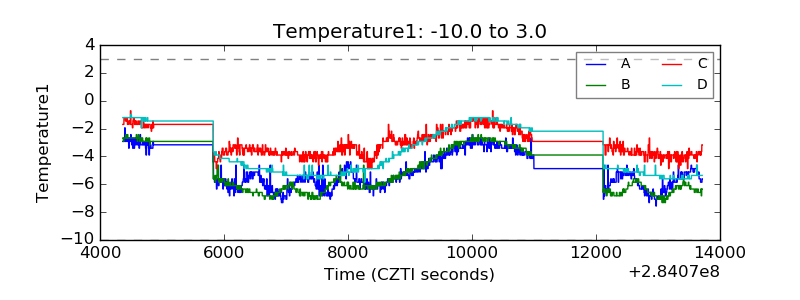 |
| Veto HV Monitor | 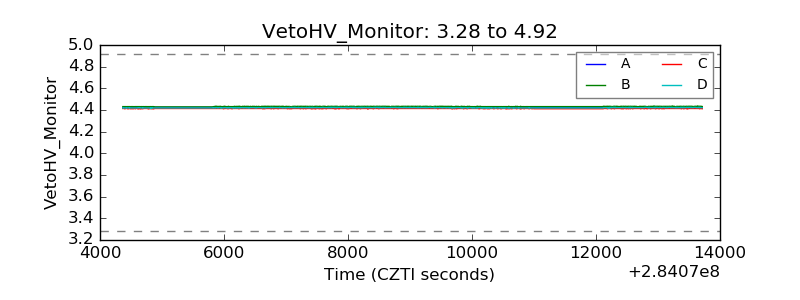 |
| Veto LLD | 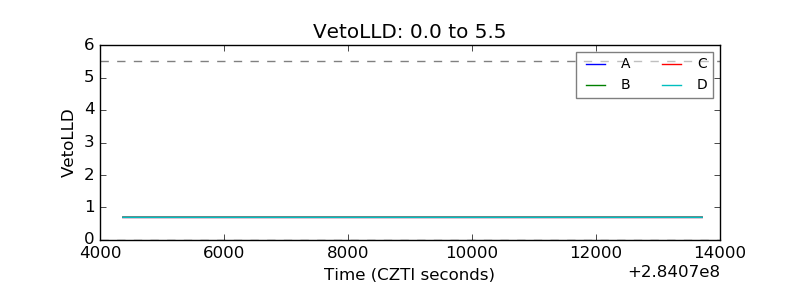 |
| Alpha Counter | 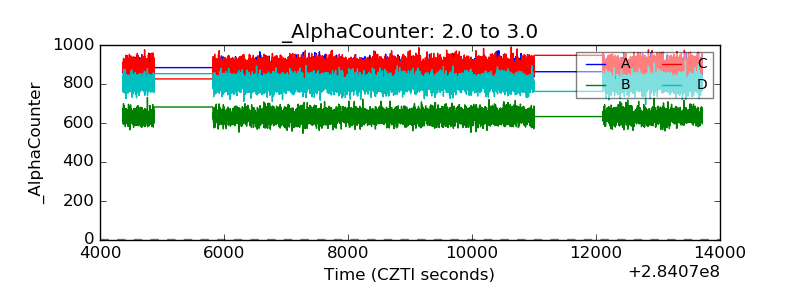 |
| _CPM_Rate | 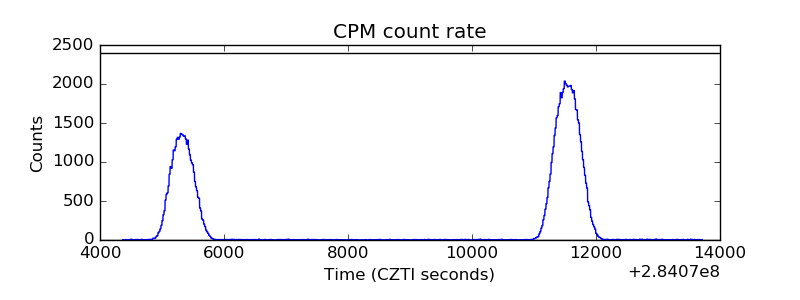 |
| CZT Counter | 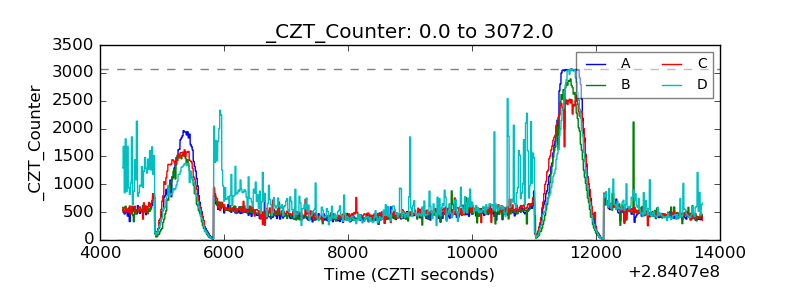 |
| +2.5 Volts monitor |  |
| +5 Volts monitor |  |
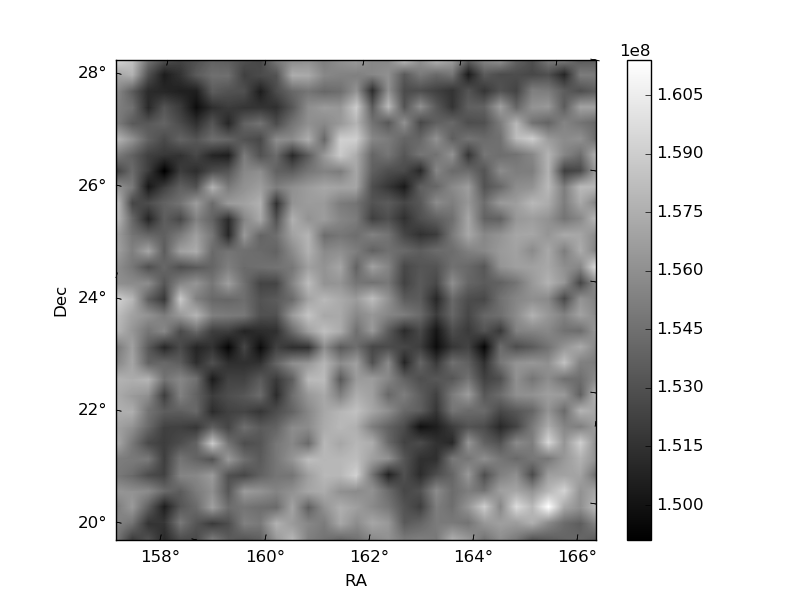
| _ROLL_ROT | 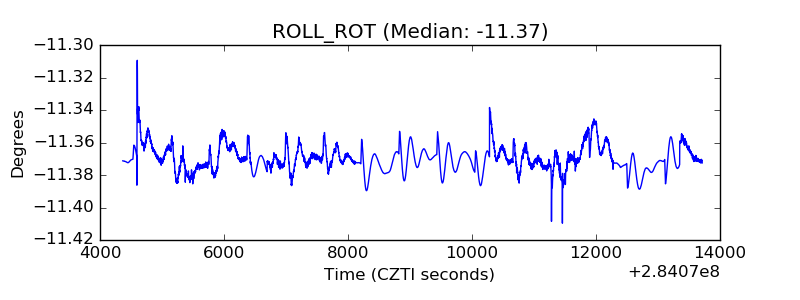 |
| _Roll_DEC | 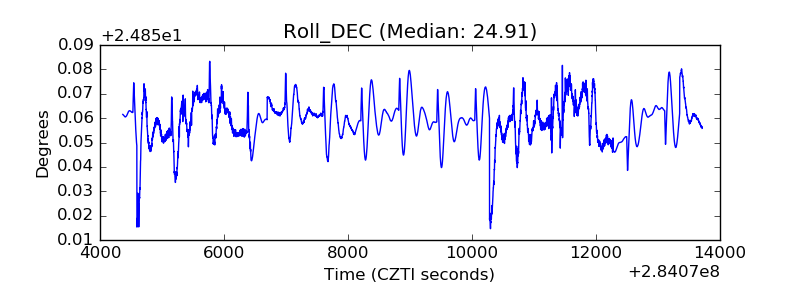 |
| _Roll_RA | 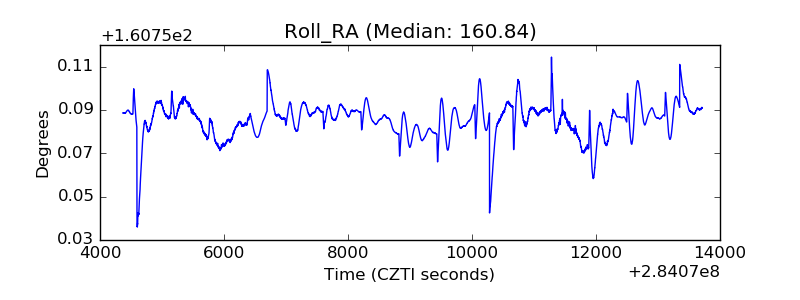 |
| Veto Counter | 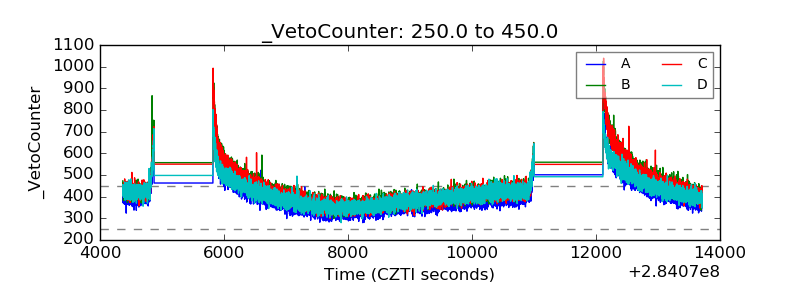 |