| Param | Original file | Final file |
|---|---|---|
| Filename | modeM0/AS1A05_118T02_9000002612_17642cztM0_level2.evt | modeM0/AS1A05_118T02_9000002612_17642cztM0_level2_quad_clean.evt |
| Size (bytes) | 568,532,160 | 99,705,600 |
| Size | 542.2 MB | 95.1 MB |
| Events in quadrant A | 3,165,295 | 658,330 |
| Events in quadrant B | 3,320,411 | 677,359 |
| Events in quadrant C | 3,354,436 | 639,543 |
| Events in quadrant D | 6,927,318 | 580,488 |
| Mode SS | |||
|---|---|---|---|
| Quadrant | BADHDUFLAG | Total packets | Discarded packets |
| A | 0 | 134 | 0 |
| B | 0 | 134 | 0 |
| C | 0 | 134 | 0 |
| D | 0 | 134 | 0 |
| Mode M0 | |||
|---|---|---|---|
| Quadrant | BADHDUFLAG | Total packets | Discarded packets |
| A | 0 | 13732 | 2 |
| B | 0 | 14085 | 2 |
| C | 0 | 14162 | 2 |
| D | 0 | 25279 | 2 |
| Mode M9 | |||
|---|---|---|---|
| Quadrant | BADHDUFLAG | Total packets | Discarded packets |
| A | 0 | 13 | 0 |
| B | 0 | 14 | 0 |
| C | 0 | 14 | 0 |
| D | 0 | 14 | 0 |
| Quadrant | Total seconds | Saturated seconds | Saturation percentage |
|---|---|---|---|
| A | 6660 | 36 | 0.540541% |
| B | 6660 | 54 | 0.810811% |
| C | 6660 | 65 | 0.975976% |
| D | 6660 | 765 | 11.486486% |
Noise dominated data is calculated using 1-second bins in cleaned event files. If a bin has >2000 counts, and if more than 50% of those come from <1% of pixels, then it is considered to be noise-dominated and hence unusable.
| Quadrant | # 1 sec bins | Bins with >0 counts | Bins with >2000 counts | High rate bins dominated by noise | Noise dominated (total time) | Noise dominated (detector-on time) | Marked lightcurve |
|---|---|---|---|---|---|---|---|
| A | 7865 | 6662 | 0 | 0 | 0.00% | 0.00% |  |
| B | 7865 | 6662 | 2 | 2 | 0.03% | 0.03% |  |
| C | 7865 | 6662 | 0 | 0 | 0.00% | 0.00% |  |
| D | 7865 | 6662 | 710 | 710 | 9.03% | 10.66% | 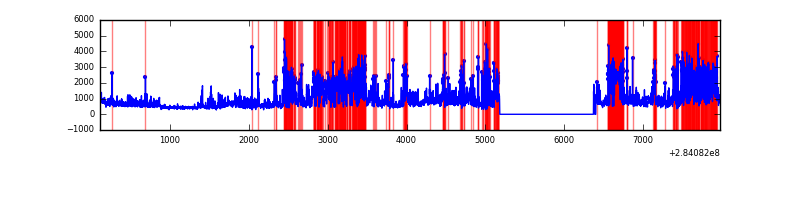 |
Top three noisy pixels from each quadrant. If the there are fewer than three noisy pixels in the level2.evt file, extra rows are filled as -1
| Pixel properties | Quadrant properties | ||||||
|---|---|---|---|---|---|---|---|
| Quadrant | DetID | PixID | Counts | Sigma | Mean | Median | Sigma |
| A | 0 | 226 | 7306 | 39.07 | 823 | 805 | 166.4 |
| A | 3 | 137 | 6008 | 31.27 | 823 | 805 | 166.4 |
| A | 12 | 194 | 5908 | 30.67 | 823 | 805 | 166.4 |
| B | 0 | 230 | 44345 | 278.89 | 826 | 808 | 156.1 |
| B | 12 | 111 | 18509 | 113.39 | 826 | 808 | 156.1 |
| B | 10 | 246 | 16198 | 98.59 | 826 | 808 | 156.1 |
| C | 3 | 233 | 131952 | 714.1 | 789 | 795 | 183.7 |
| C | 14 | 238 | 124164 | 671.69 | 789 | 795 | 183.7 |
| C | 5 | 218 | 21506 | 112.76 | 789 | 795 | 183.7 |
| D | 1 | 52 | 3913228 | 21132.24 | 758 | 734 | 185.1 |
| D | 13 | 189 | 116731 | 626.53 | 758 | 734 | 185.1 |
| D | 2 | 234 | 21871 | 114.17 | 758 | 734 | 185.1 |
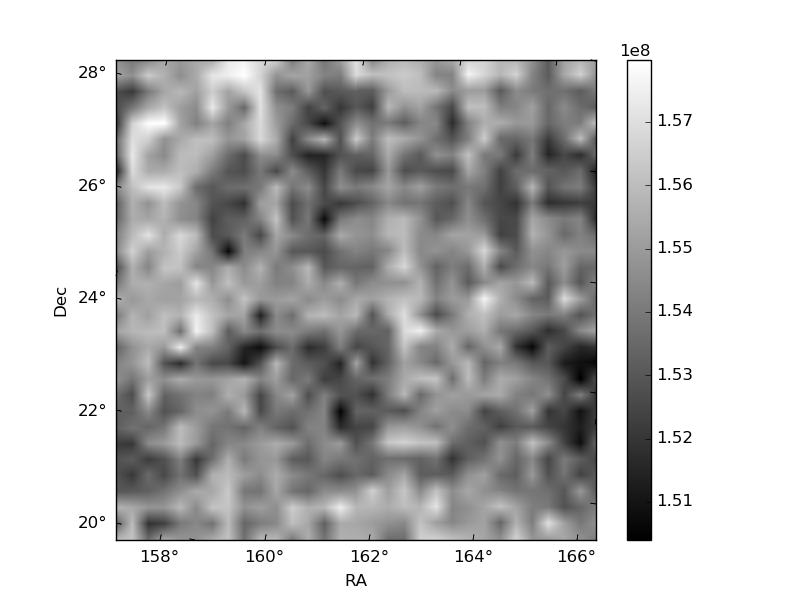
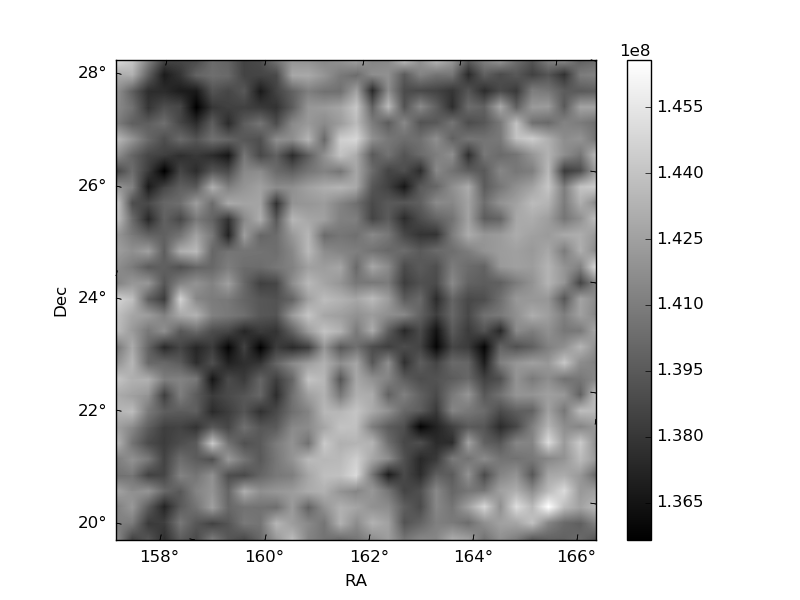
Histogram calculated using DETX and DETY for each event in the final _common_clean file
| Quadrant A | 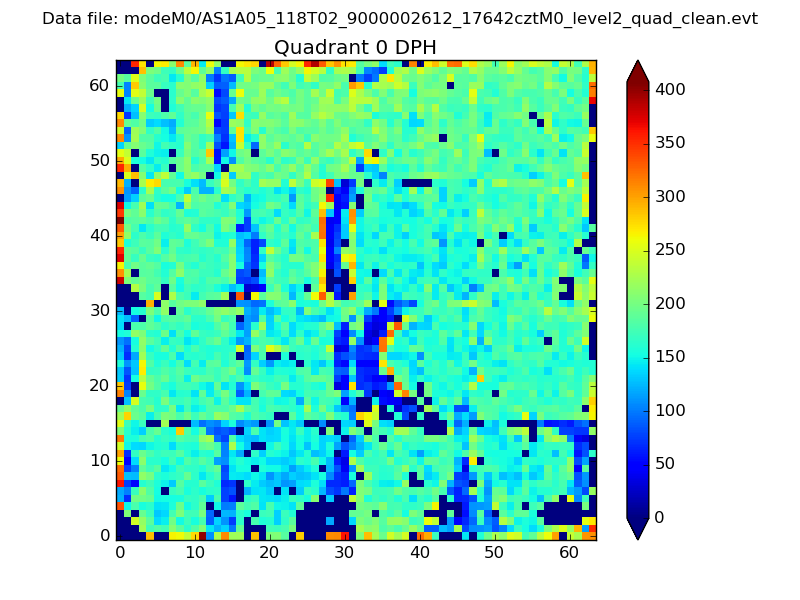 |
 |
Quadrant B |
|---|---|---|---|
| Quadrant D | 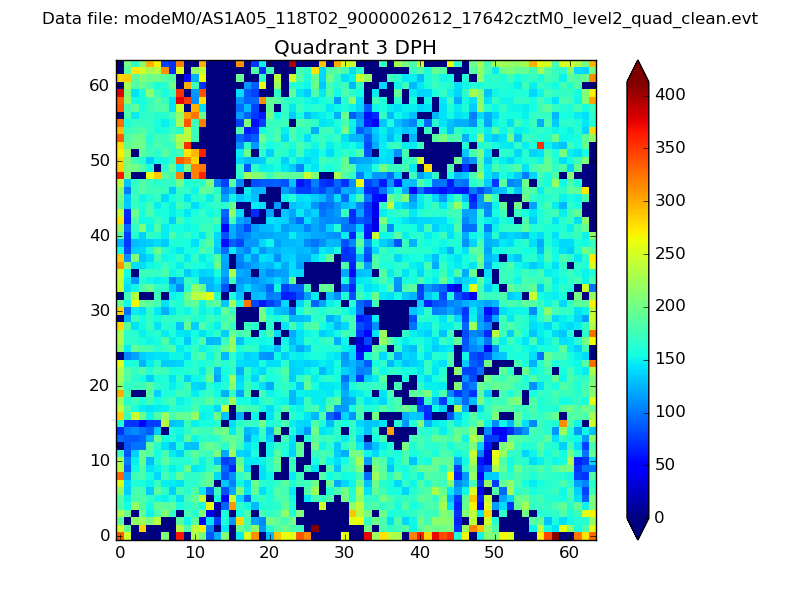 |
 |
Quadrant C |
| Plot type | Count rate plots | Images |
|---|---|---|
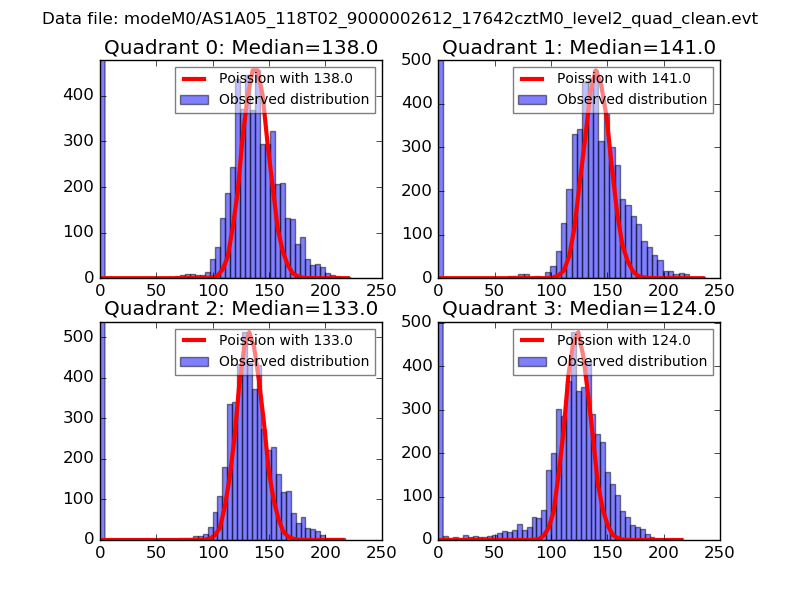
| Comparison with Poisson distribution Blue bars denote a histogram of data divided into 1 sec bins. Red curve is a Poisson curve with rate = median count rate of data. |
 |
 |
| Quadrant-wise count rates Data is divided into 100 sec bins |
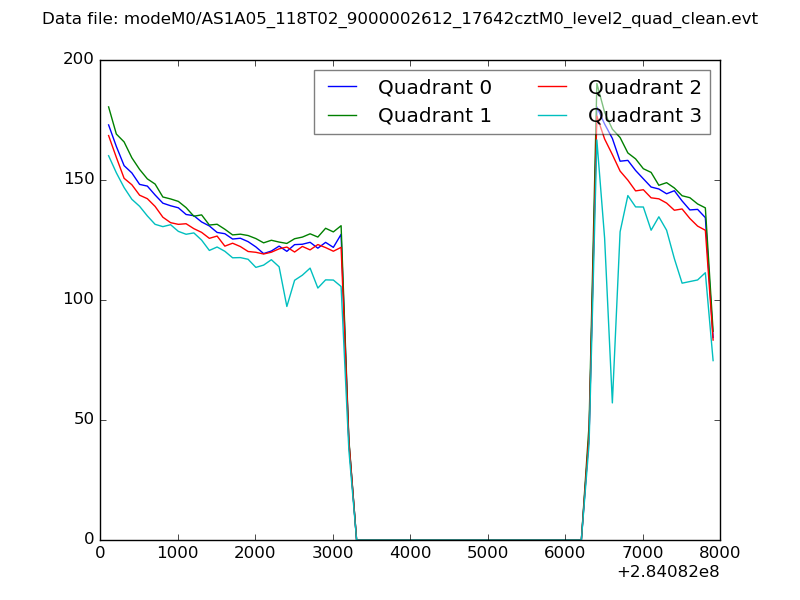 |
|
| Module-wise count rates for Quadrant A Data is divided into 100 sec bins |
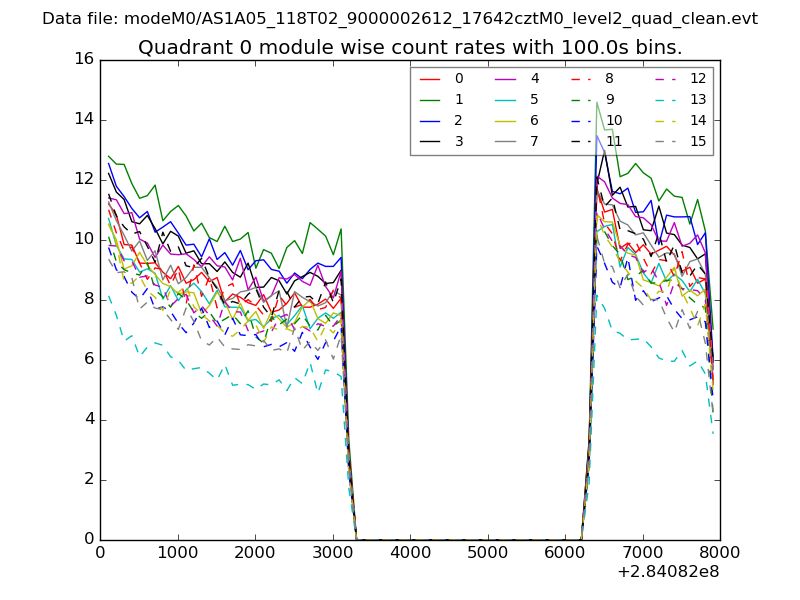 |
 |
| Module-wise count rates for Quadrant B Data is divided into 100 sec bins |
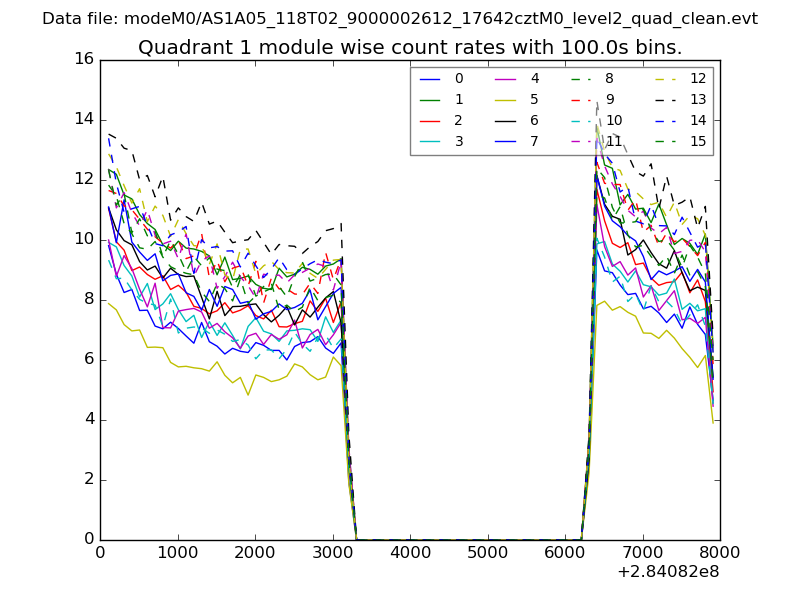 |
 |
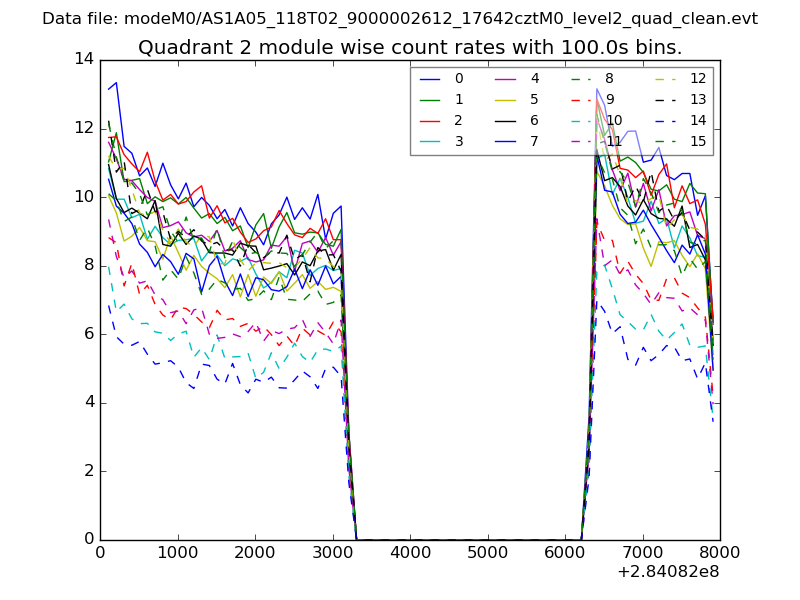
| Module-wise count rates for Quadrant C Data is divided into 100 sec bins |
 |
 |
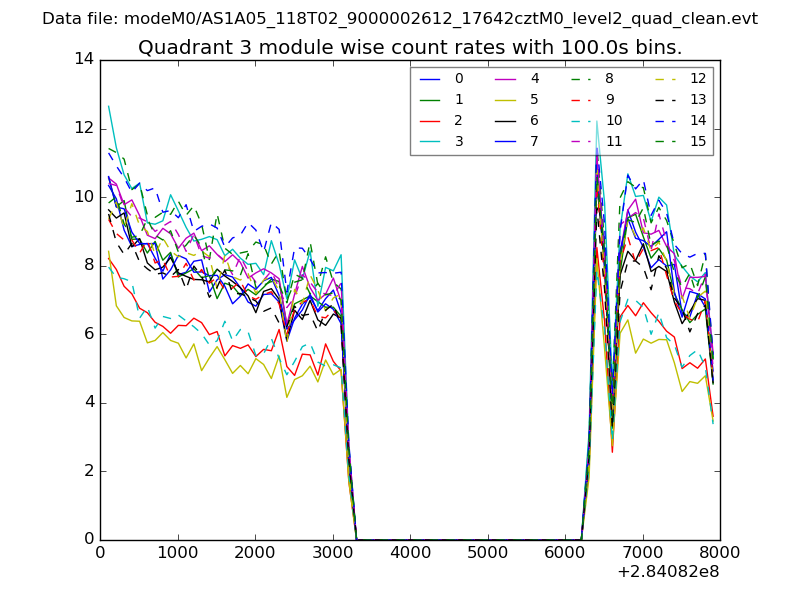
| Module-wise count rates for Quadrant D Data is divided into 100 sec bins |
 |
 |
| Parameter | Plot |
|---|---|
| CZT HV Monitor | 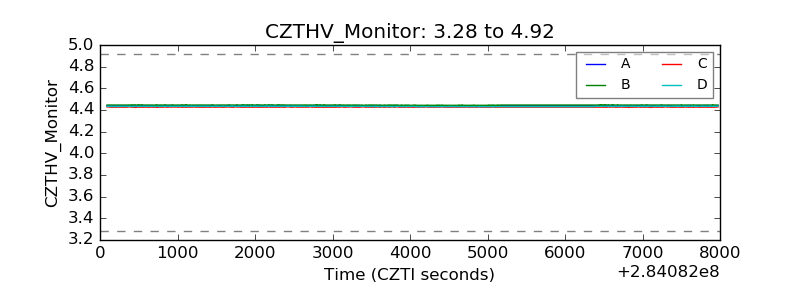 |
| D_VDD | 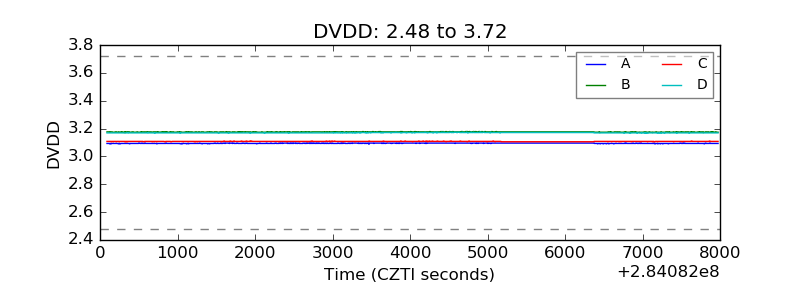 |
| Temperature 1 |  |
| Veto HV Monitor | 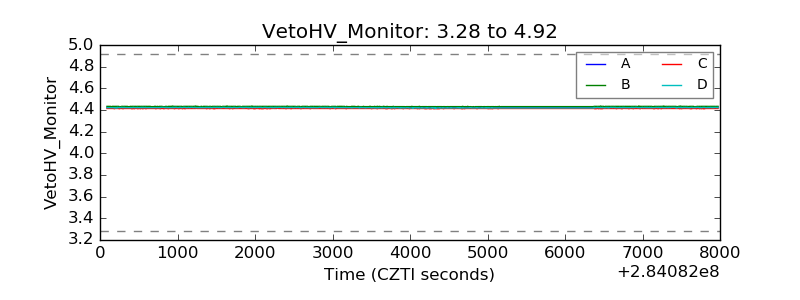 |
| Veto LLD |  |
| Alpha Counter |  |
| _CPM_Rate | 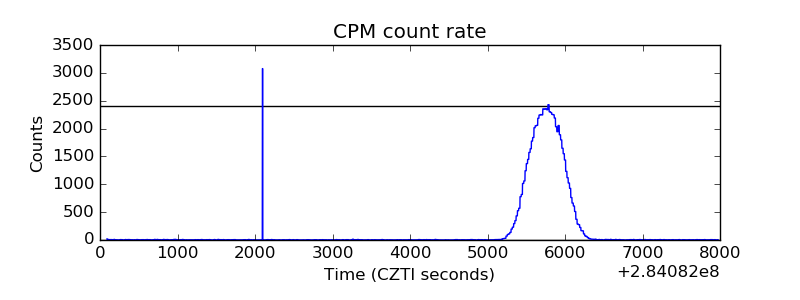 |
| CZT Counter | 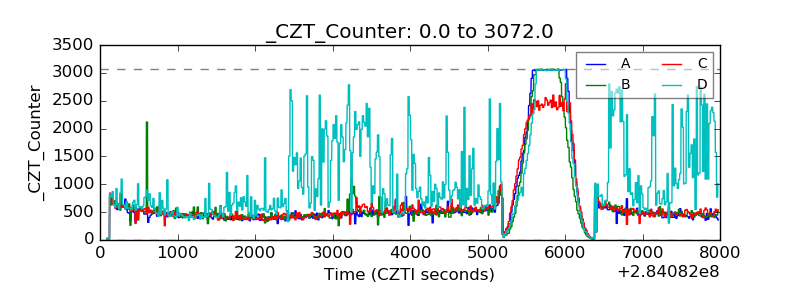 |
| +2.5 Volts monitor |  |
| +5 Volts monitor | 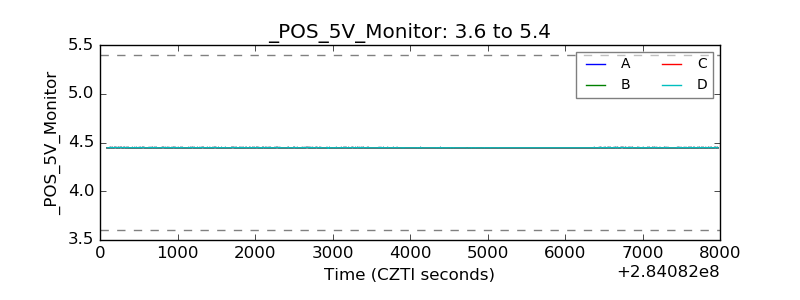 |
| _ROLL_ROT | 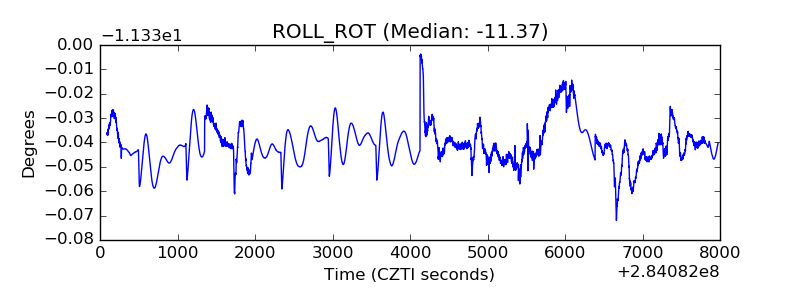 |
| _Roll_DEC | 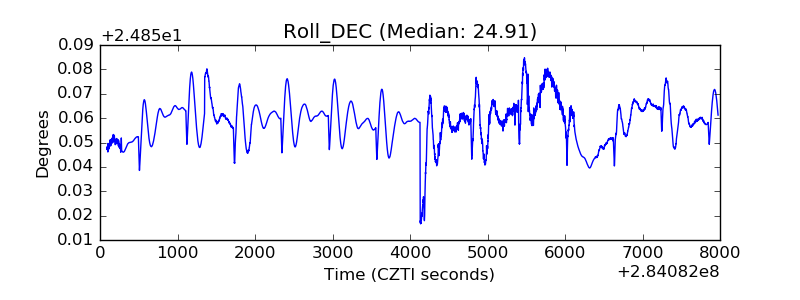 |
| _Roll_RA |  |
| Veto Counter | 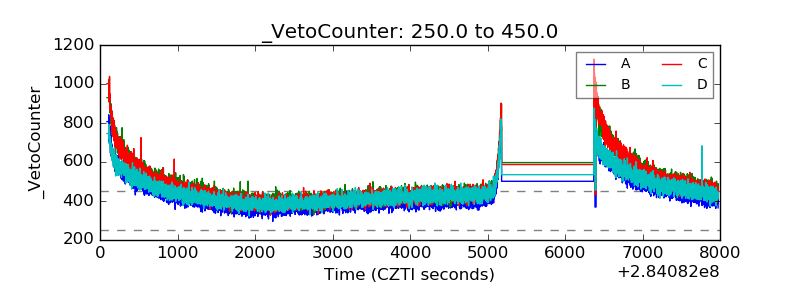 |