| Param | Original file | Final file |
|---|---|---|
| Filename | modeM0/AS1A05_118T02_9000002612_17643cztM0_level2.evt | modeM0/AS1A05_118T02_9000002612_17643cztM0_level2_quad_clean.evt |
| Size (bytes) | 575,055,360 | 97,139,520 |
| Size | 548.4 MB | 92.6 MB |
| Events in quadrant A | 3,211,293 | 641,853 |
| Events in quadrant B | 3,338,562 | 658,530 |
| Events in quadrant C | 3,391,935 | 619,977 |
| Events in quadrant D | 7,030,018 | 564,447 |
| Mode SS | |||
|---|---|---|---|
| Quadrant | BADHDUFLAG | Total packets | Discarded packets |
| A | 0 | 134 | 0 |
| B | 0 | 134 | 0 |
| C | 0 | 134 | 0 |
| D | 0 | 134 | 0 |
| Mode M0 | |||
|---|---|---|---|
| Quadrant | BADHDUFLAG | Total packets | Discarded packets |
| A | 0 | 13539 | 2 |
| B | 0 | 13907 | 2 |
| C | 0 | 13862 | 2 |
| D | 0 | 25458 | 2 |
| Mode M9 | |||
|---|---|---|---|
| Quadrant | BADHDUFLAG | Total packets | Discarded packets |
| A | 0 | 16 | 0 |
| B | 0 | 17 | 0 |
| C | 0 | 17 | 0 |
| D | 0 | 17 | 0 |
| Quadrant | Total seconds | Saturated seconds | Saturation percentage |
|---|---|---|---|
| A | 6556 | 27 | 0.411836% |
| B | 6556 | 47 | 0.716901% |
| C | 6556 | 50 | 0.762660% |
| D | 6556 | 820 | 12.507627% |
Noise dominated data is calculated using 1-second bins in cleaned event files. If a bin has >2000 counts, and if more than 50% of those come from <1% of pixels, then it is considered to be noise-dominated and hence unusable.
| Quadrant | # 1 sec bins | Bins with >0 counts | Bins with >2000 counts | High rate bins dominated by noise | Noise dominated (total time) | Noise dominated (detector-on time) | Marked lightcurve |
|---|---|---|---|---|---|---|---|
| A | 7841 | 6558 | 0 | 0 | 0.00% | 0.00% | 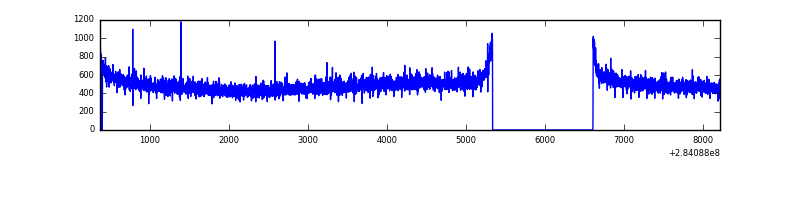 |
| B | 7841 | 6558 | 1 | 1 | 0.01% | 0.02% | 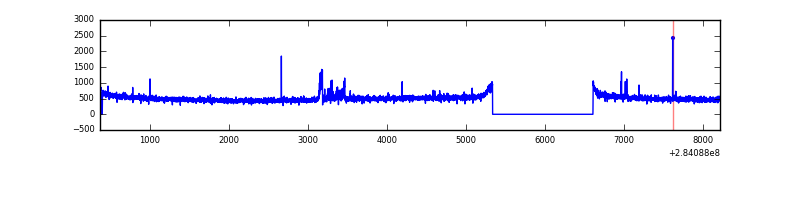 |
| C | 7841 | 6558 | 0 | 0 | 0.00% | 0.00% | 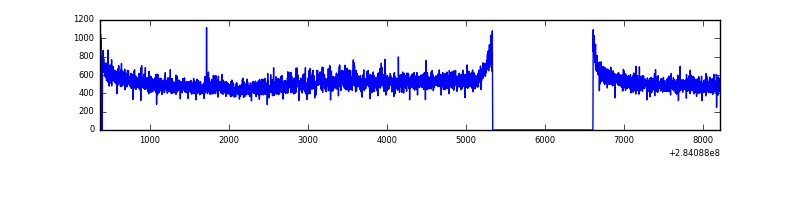 |
| D | 7841 | 6558 | 712 | 712 | 9.08% | 10.86% | 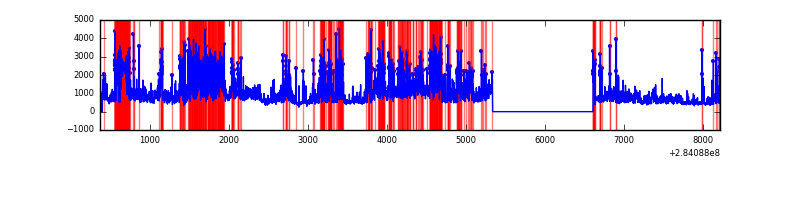 |
Top three noisy pixels from each quadrant. If the there are fewer than three noisy pixels in the level2.evt file, extra rows are filled as -1
| Pixel properties | Quadrant properties | ||||||
|---|---|---|---|---|---|---|---|
| Quadrant | DetID | PixID | Counts | Sigma | Mean | Median | Sigma |
| A | 0 | 226 | 7333 | 38.87 | 836 | 821 | 167.5 |
| A | 12 | 194 | 5951 | 30.62 | 836 | 821 | 167.5 |
| A | 3 | 137 | 5930 | 30.5 | 836 | 821 | 167.5 |
| B | 0 | 230 | 55709 | 350.3 | 834 | 816 | 156.7 |
| B | 12 | 111 | 18369 | 112.02 | 834 | 816 | 156.7 |
| B | 11 | 111 | 15963 | 96.66 | 834 | 816 | 156.7 |
| C | 3 | 233 | 148629 | 802.39 | 794 | 801 | 184.2 |
| C | 14 | 238 | 126091 | 680.06 | 794 | 801 | 184.2 |
| C | 5 | 218 | 20478 | 106.8 | 794 | 801 | 184.2 |
| D | 1 | 52 | 4049750 | 21883.33 | 761 | 739 | 185.0 |
| D | 13 | 189 | 72752 | 389.2 | 761 | 739 | 185.0 |
| D | 2 | 234 | 21565 | 112.56 | 761 | 739 | 185.0 |
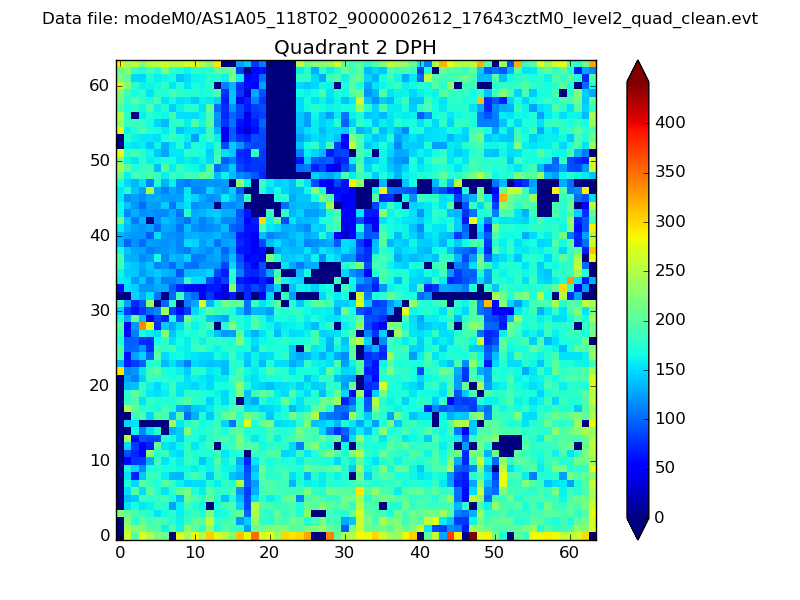
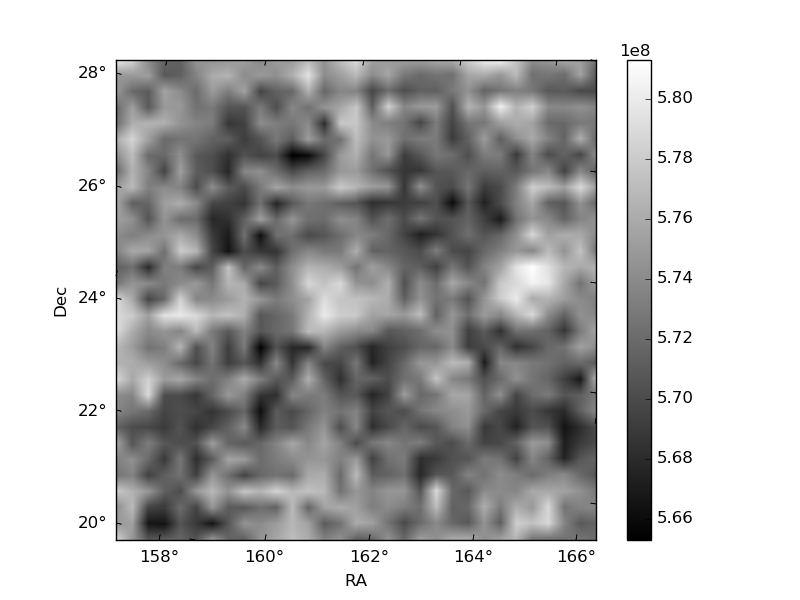
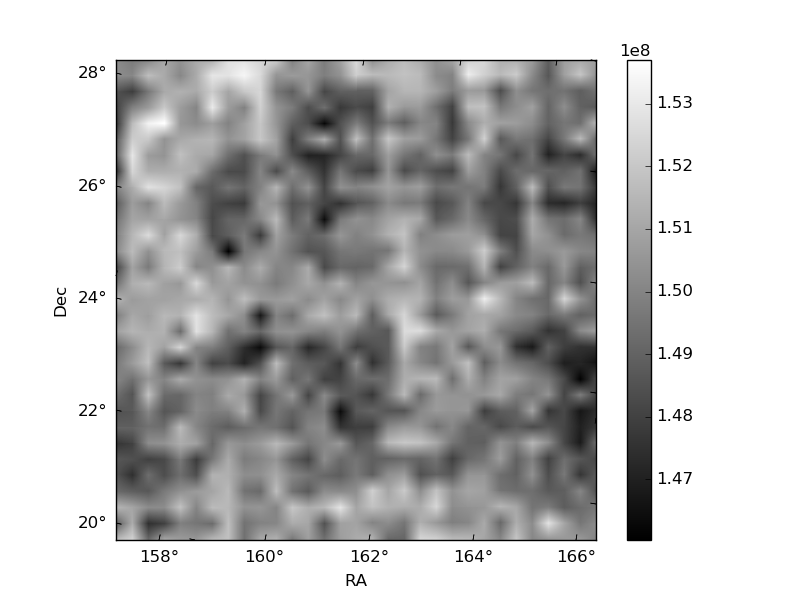
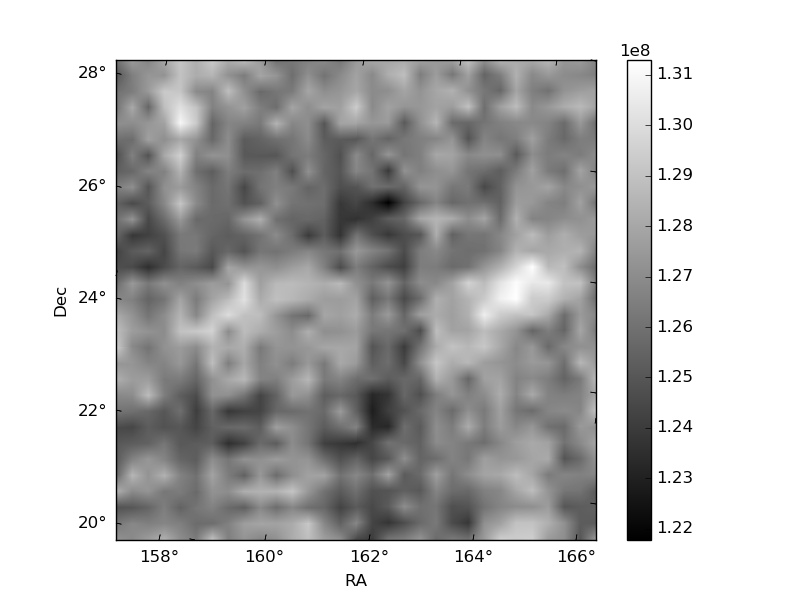
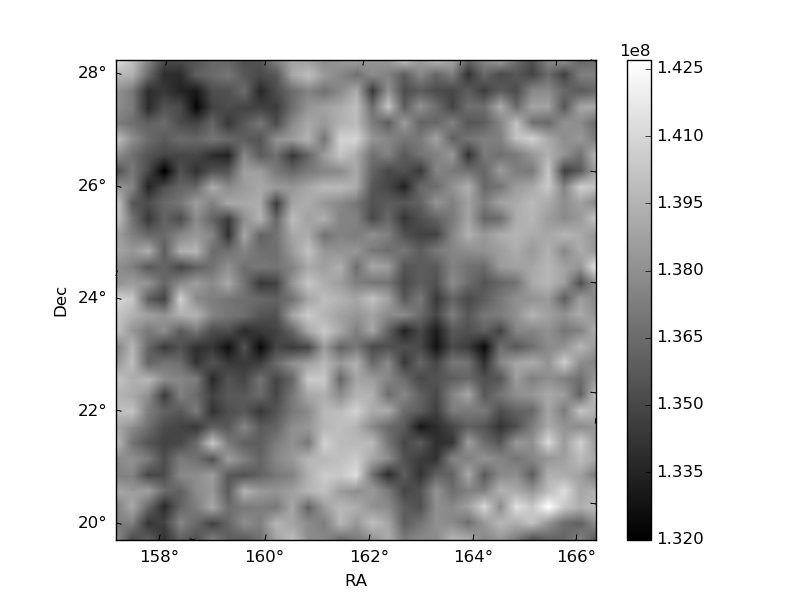
Histogram calculated using DETX and DETY for each event in the final _common_clean file
| Quadrant A | 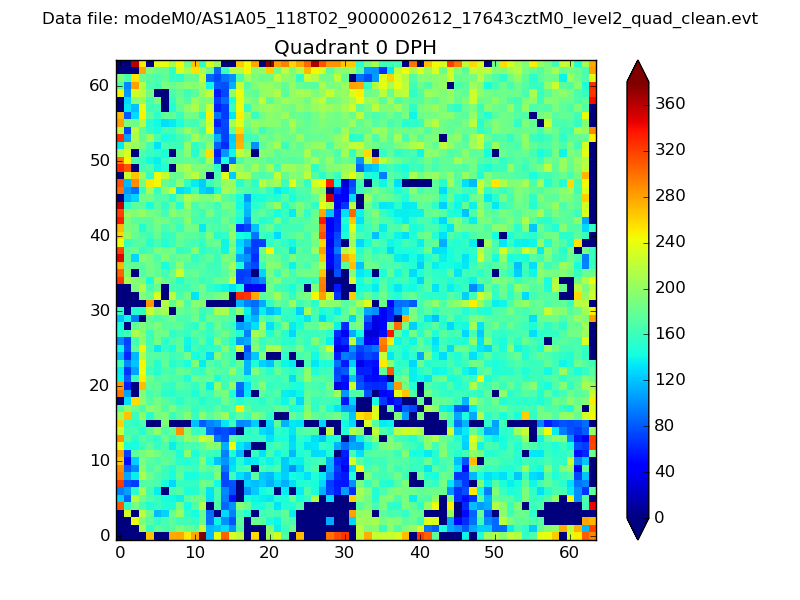 |
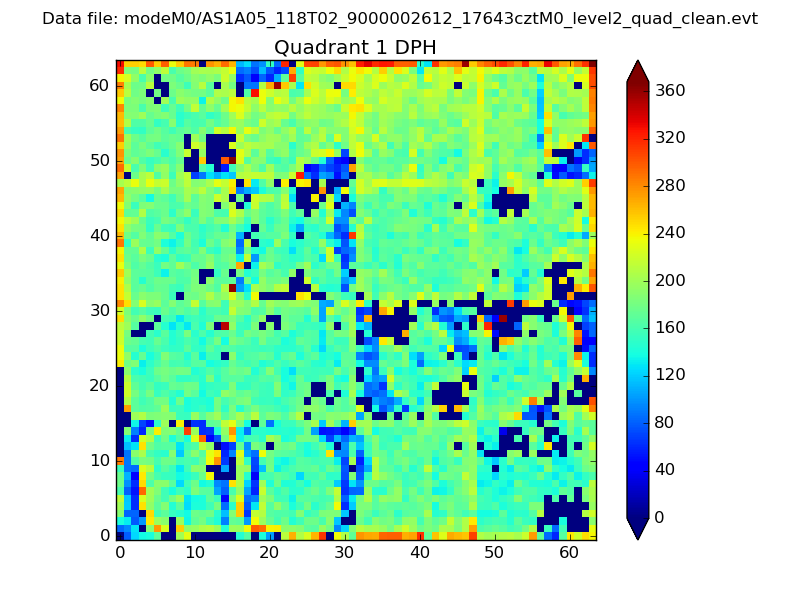 |
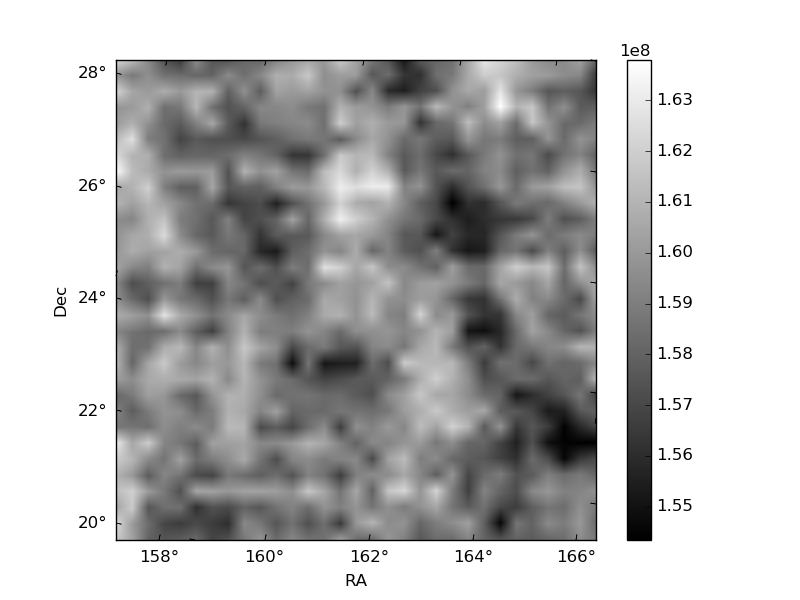
Quadrant B |
|---|---|---|---|
| Quadrant D | 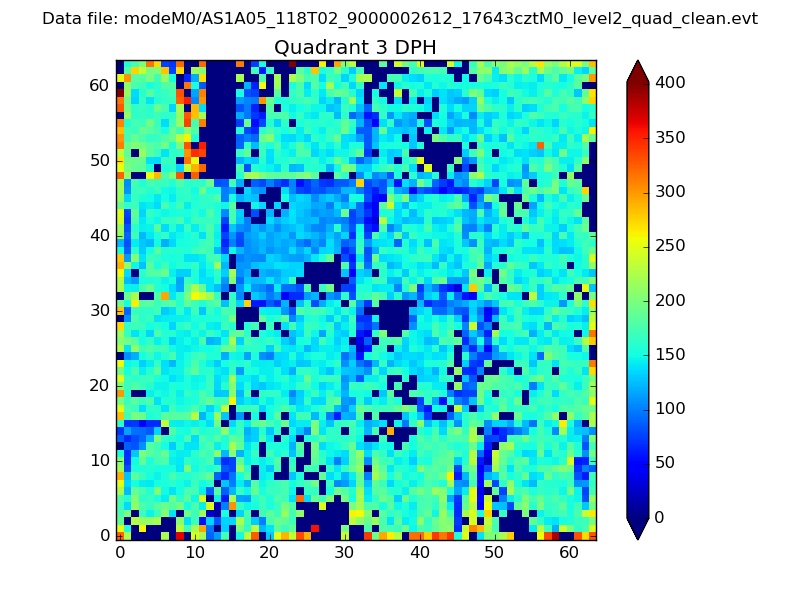 |
 |
Quadrant C |
| Plot type | Count rate plots | Images |
|---|---|---|
| Comparison with Poisson distribution Blue bars denote a histogram of data divided into 1 sec bins. Red curve is a Poisson curve with rate = median count rate of data. |
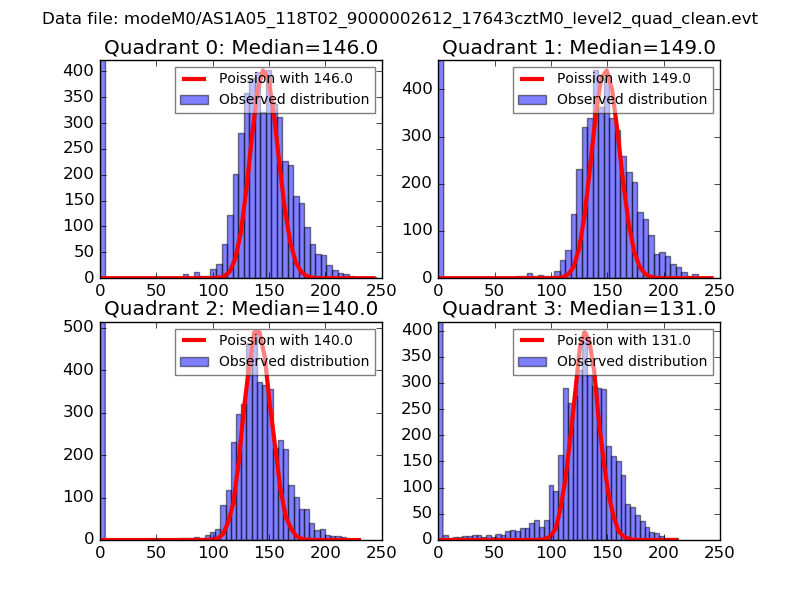 |
 |
| Quadrant-wise count rates Data is divided into 100 sec bins |
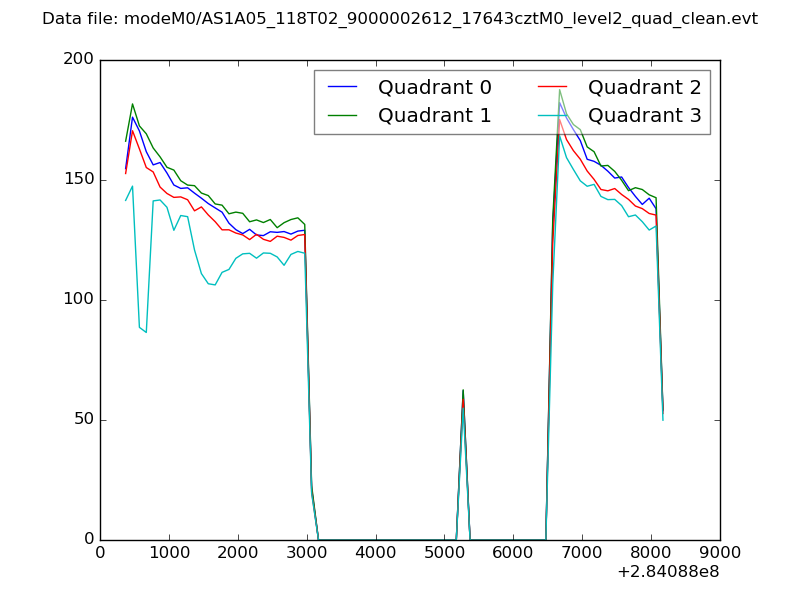 |
|
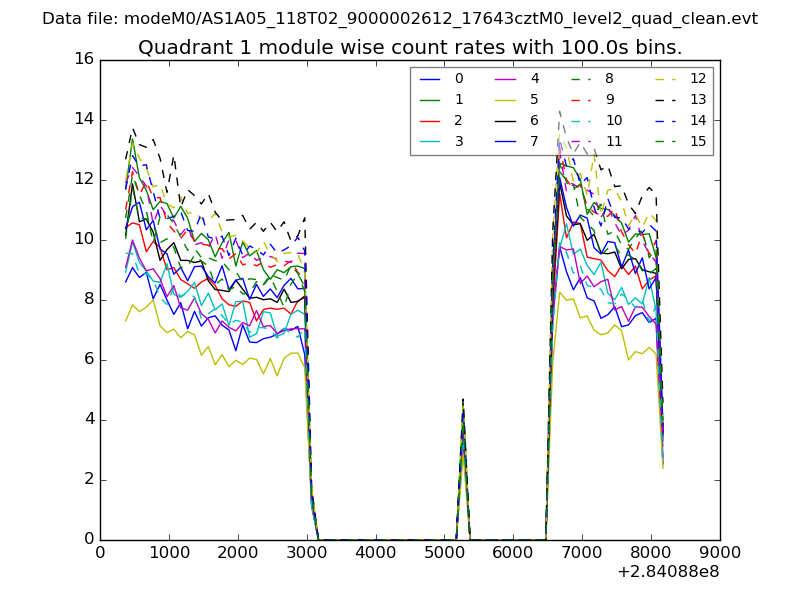
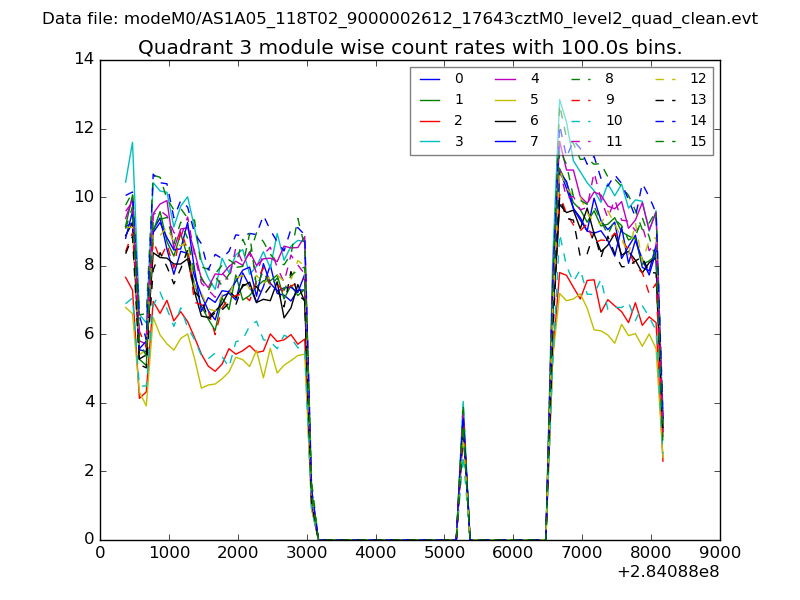
| Module-wise count rates for Quadrant A Data is divided into 100 sec bins |
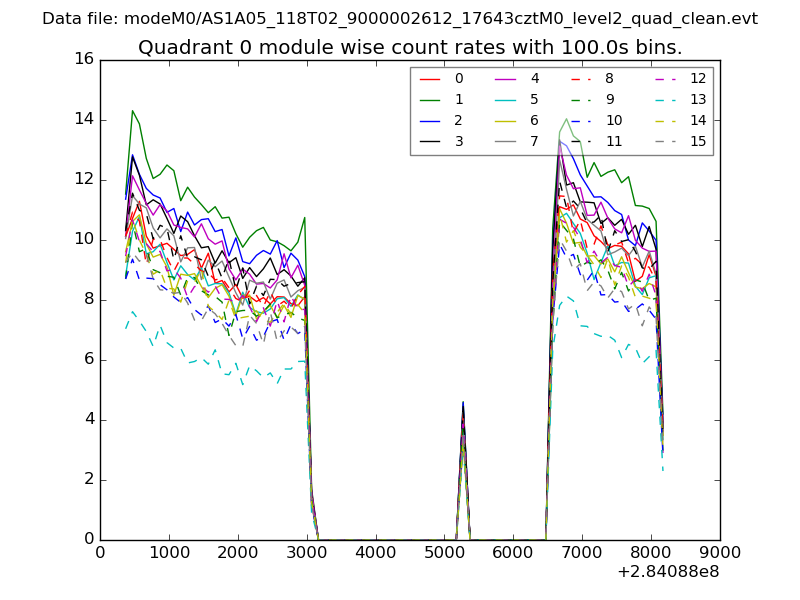 |
 |
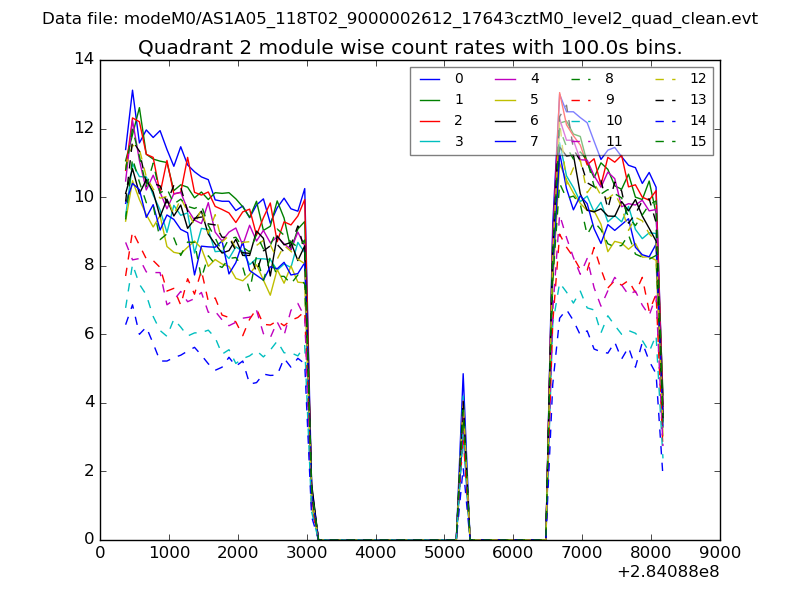
| Module-wise count rates for Quadrant B Data is divided into 100 sec bins |
 |
 |
| Module-wise count rates for Quadrant C Data is divided into 100 sec bins |
 |
 |
| Module-wise count rates for Quadrant D Data is divided into 100 sec bins |
 |
 |
| Parameter | Plot |
|---|---|
| CZT HV Monitor | 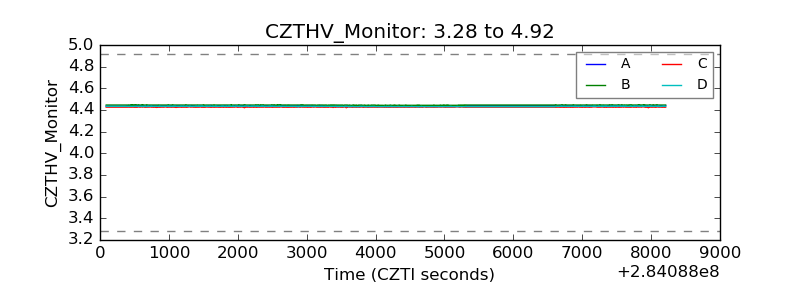 |
| D_VDD |  |
| Temperature 1 | 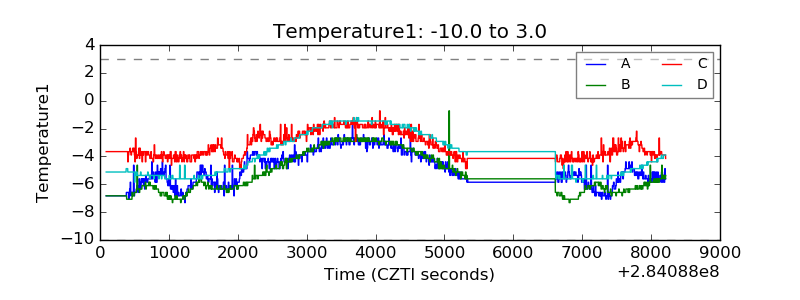 |
| Veto HV Monitor | 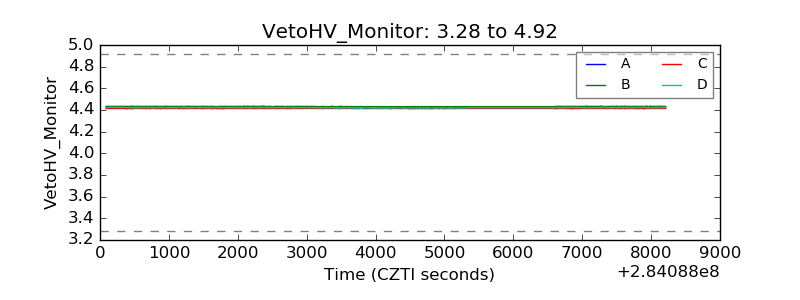 |
| Veto LLD | 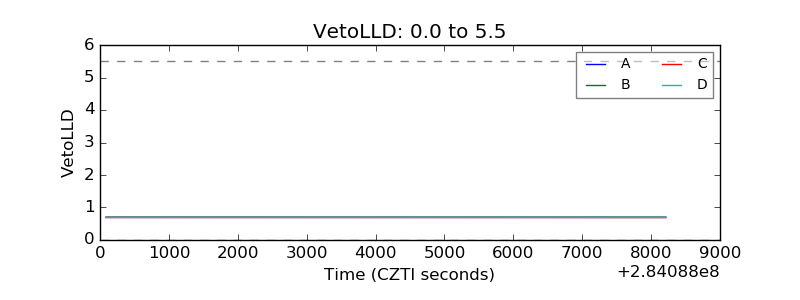 |
| Alpha Counter | 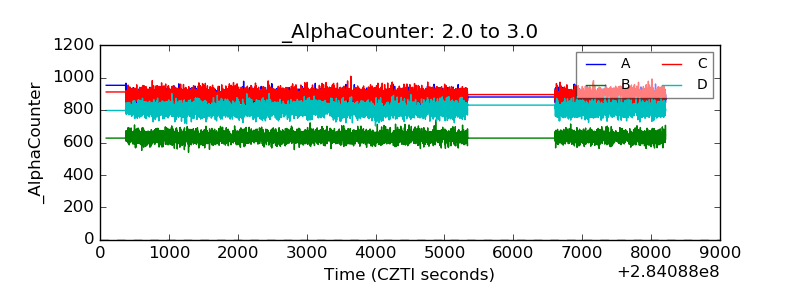 |
| _CPM_Rate | 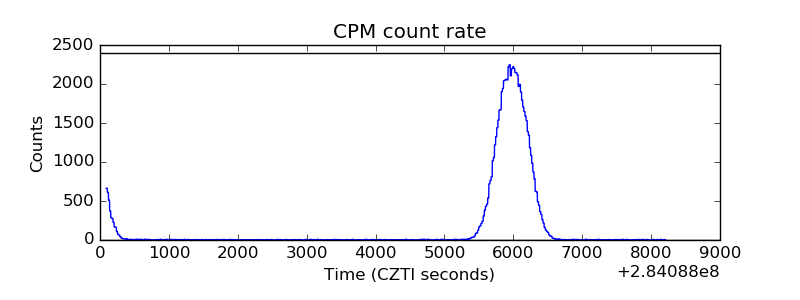 |
| CZT Counter | 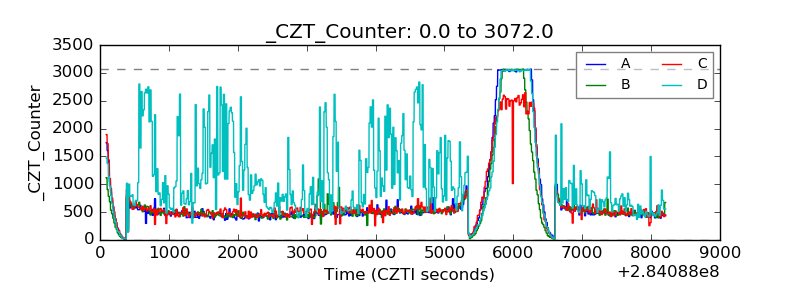 |
| +2.5 Volts monitor |  |
| +5 Volts monitor |  |
| _ROLL_ROT |  |
| _Roll_DEC | 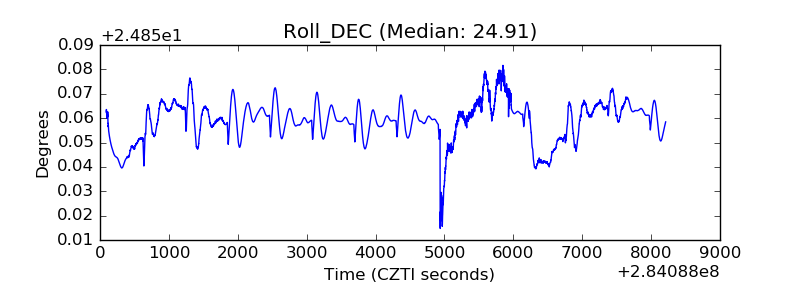 |
| _Roll_RA | 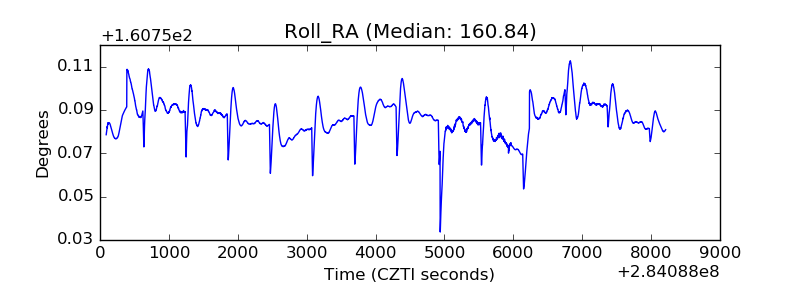 |
| Veto Counter |  |