| Param | Original file | Final file |
|---|---|---|
| Filename | modeM0/AS1A05_118T02_9000002612_17645cztM0_level2.evt | modeM0/AS1A05_118T02_9000002612_17645cztM0_level2_quad_clean.evt |
| Size (bytes) | 660,660,480 | 76,245,120 |
| Size | 630.1 MB | 72.7 MB |
| Events in quadrant A | 2,881,570 | 518,226 |
| Events in quadrant B | 2,969,171 | 526,942 |
| Events in quadrant C | 3,018,163 | 501,427 |
| Events in quadrant D | 10,745,470 | 355,073 |
| Mode SS | |||
|---|---|---|---|
| Quadrant | BADHDUFLAG | Total packets | Discarded packets |
| A | 0 | 118 | 0 |
| B | 0 | 118 | 0 |
| C | 0 | 118 | 0 |
| D | 0 | 118 | 0 |
| Mode M0 | |||
|---|---|---|---|
| Quadrant | BADHDUFLAG | Total packets | Discarded packets |
| A | 0 | 11952 | 1 |
| B | 0 | 12259 | 1 |
| C | 0 | 12176 | 1 |
| D | 0 | 35878 | 7 |
| Mode M9 | |||
|---|---|---|---|
| Quadrant | BADHDUFLAG | Total packets | Discarded packets |
| A | 0 | 13 | 0 |
| B | 0 | 13 | 0 |
| C | 0 | 13 | 0 |
| D | 0 | 13 | 0 |
| Quadrant | Total seconds | Saturated seconds | Saturation percentage |
|---|---|---|---|
| A | 5815 | 39 | 0.670679% |
| B | 5815 | 55 | 0.945830% |
| C | 5815 | 64 | 1.100602% |
| D | 5814 | 3054 | 52.528380% |
Noise dominated data is calculated using 1-second bins in cleaned event files. If a bin has >2000 counts, and if more than 50% of those come from <1% of pixels, then it is considered to be noise-dominated and hence unusable.
| Quadrant | # 1 sec bins | Bins with >0 counts | Bins with >2000 counts | High rate bins dominated by noise | Noise dominated (total time) | Noise dominated (detector-on time) | Marked lightcurve |
|---|---|---|---|---|---|---|---|
| A | 7080 | 5816 | 0 | 0 | 0.00% | 0.00% | 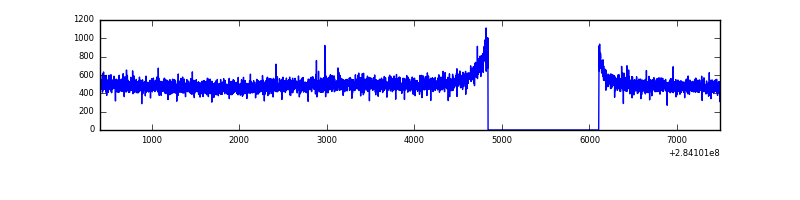 |
| B | 7080 | 5816 | 3 | 3 | 0.04% | 0.05% | 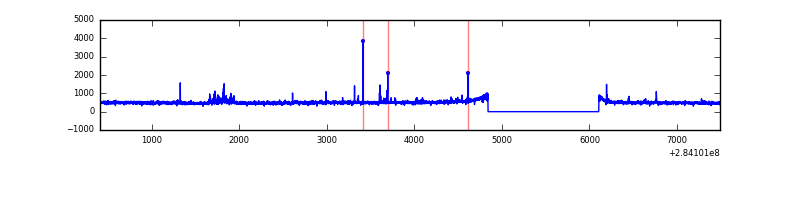 |
| C | 7080 | 5816 | 0 | 0 | 0.00% | 0.00% | 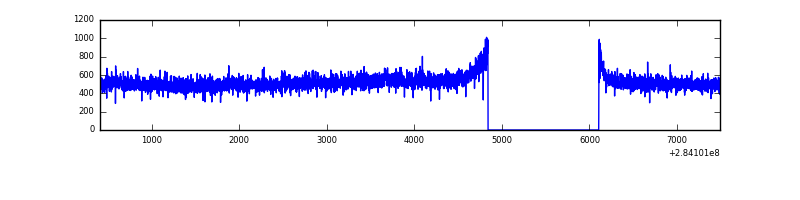 |
| D | 7078 | 5813 | 2880 | 2880 | 40.69% | 49.54% | 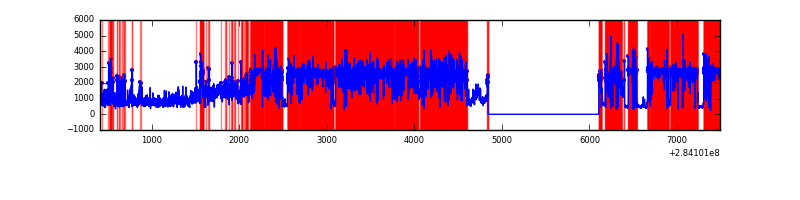 |
Top three noisy pixels from each quadrant. If the there are fewer than three noisy pixels in the level2.evt file, extra rows are filled as -1
| Pixel properties | Quadrant properties | ||||||
|---|---|---|---|---|---|---|---|
| Quadrant | DetID | PixID | Counts | Sigma | Mean | Median | Sigma |
| A | 14 | 237 | 17246 | 109.51 | 745 | 732 | 150.8 |
| A | 0 | 226 | 6431 | 37.79 | 745 | 732 | 150.8 |
| A | 12 | 194 | 5474 | 31.45 | 745 | 732 | 150.8 |
| B | 0 | 230 | 45730 | 322.53 | 735 | 719 | 139.6 |
| B | 3 | 64 | 19923 | 137.61 | 735 | 719 | 139.6 |
| B | 12 | 111 | 16237 | 111.19 | 735 | 719 | 139.6 |
| C | 3 | 233 | 133277 | 811.75 | 705 | 710 | 163.3 |
| C | 14 | 238 | 111997 | 681.45 | 705 | 710 | 163.3 |
| C | 5 | 218 | 15559 | 90.93 | 705 | 710 | 163.3 |
| D | 1 | 52 | 8589137 | 67585.75 | 520 | 504 | 127.1 |
| D | 13 | 189 | 122642 | 961.13 | 520 | 504 | 127.1 |
| D | 12 | 233 | 19171 | 146.89 | 520 | 504 | 127.1 |
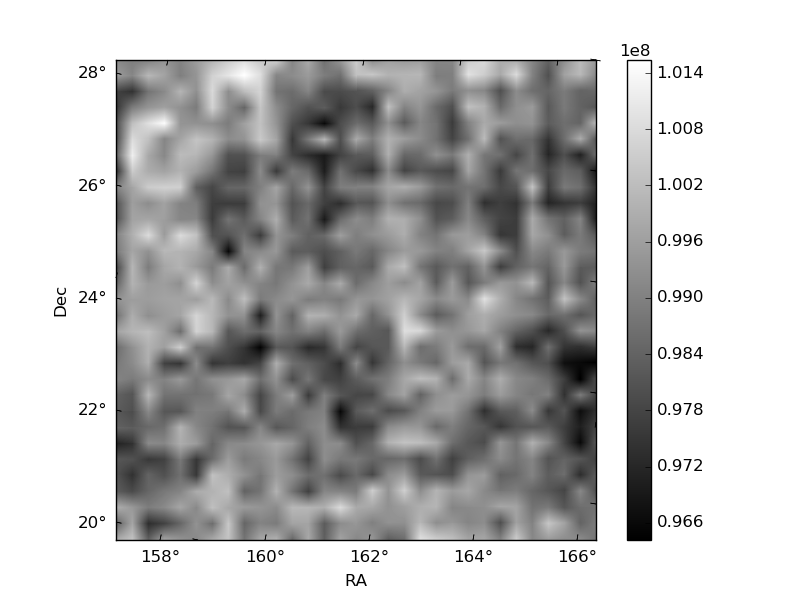
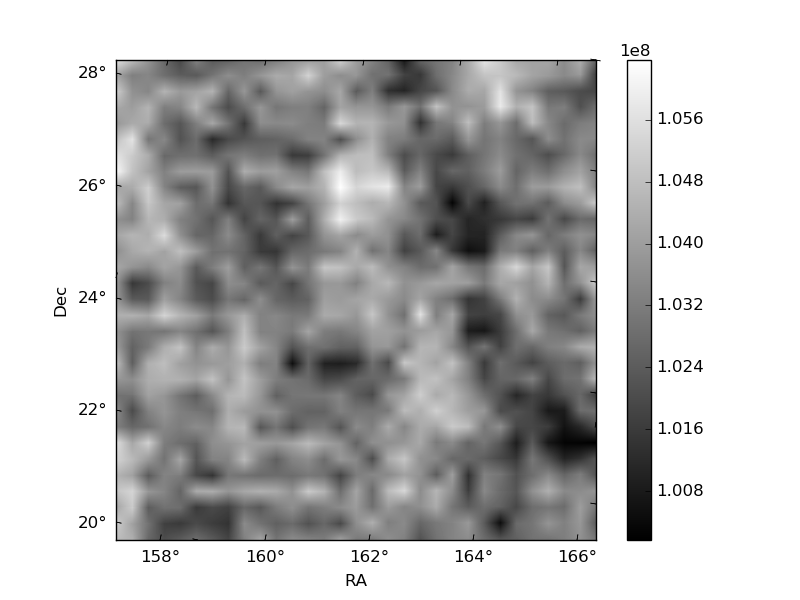
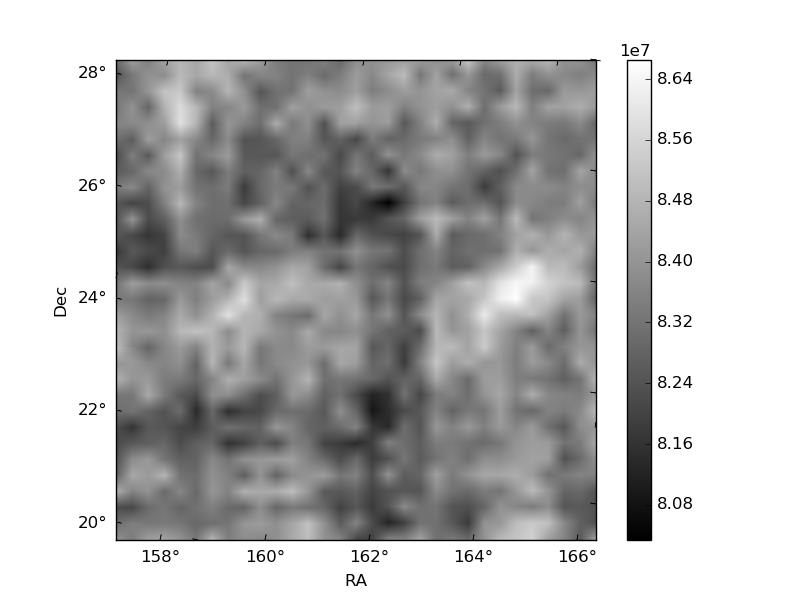
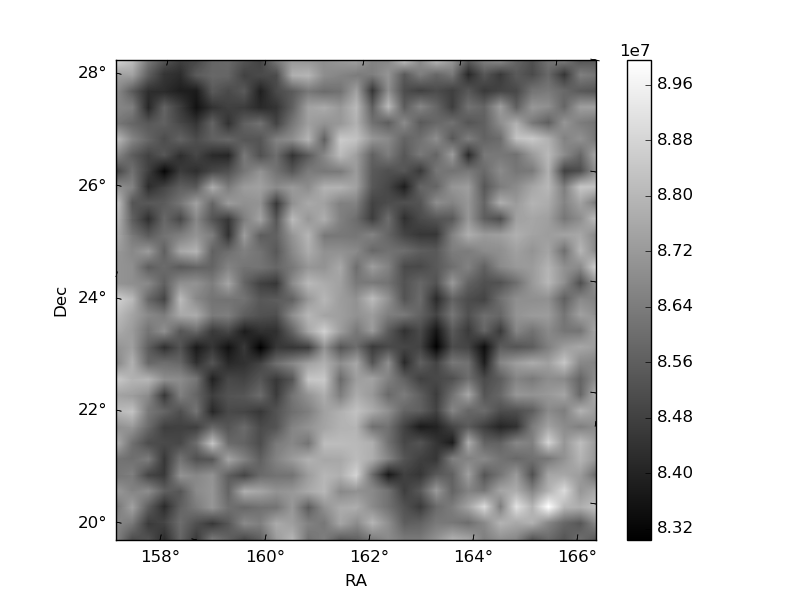
Histogram calculated using DETX and DETY for each event in the final _common_clean file
| Quadrant A | 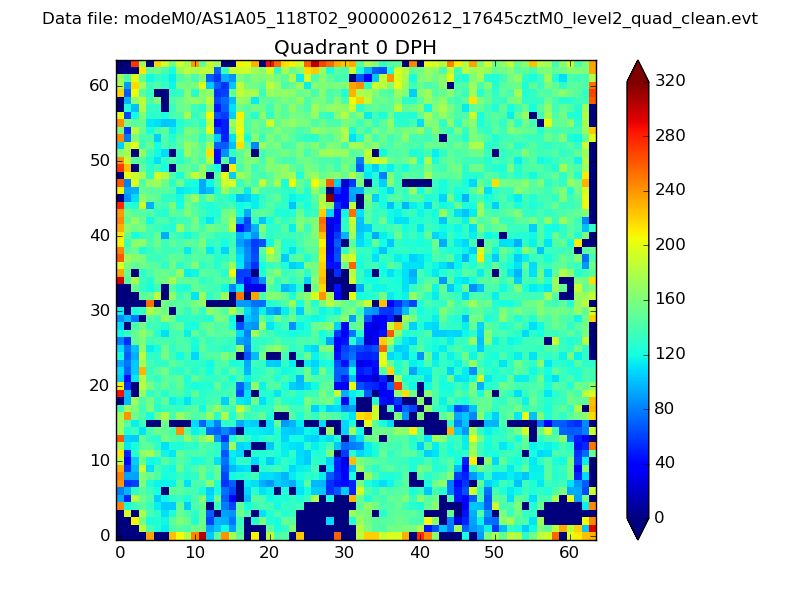 |
 |
Quadrant B |
|---|---|---|---|
| Quadrant D |  |
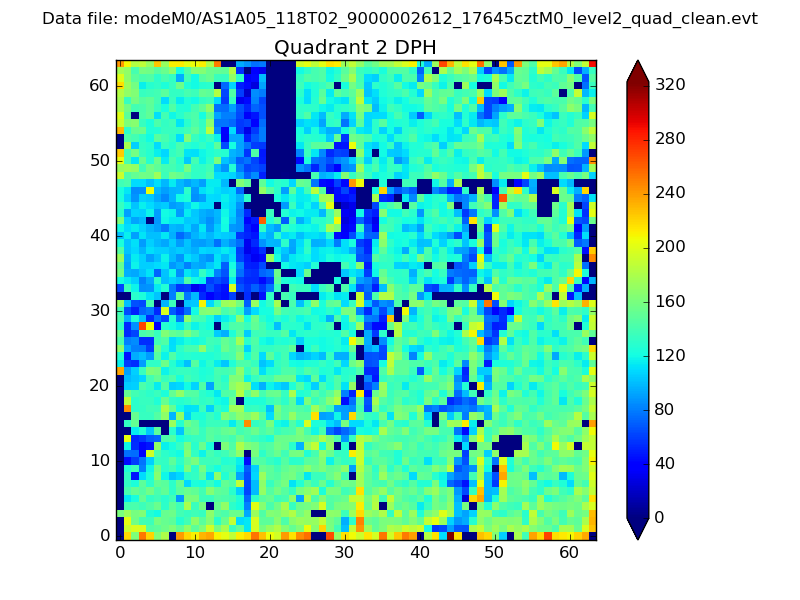 |
Quadrant C |
| Plot type | Count rate plots | Images |
|---|---|---|
| Comparison with Poisson distribution Blue bars denote a histogram of data divided into 1 sec bins. Red curve is a Poisson curve with rate = median count rate of data. |
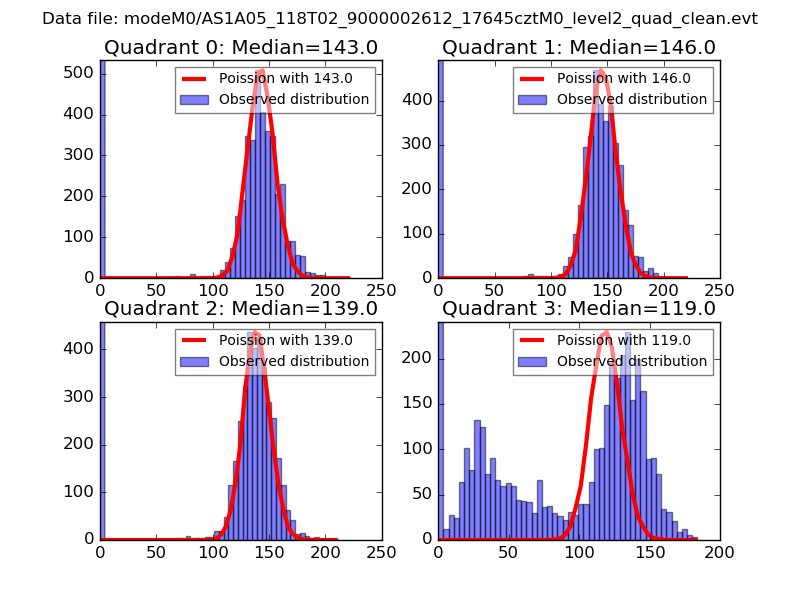 |
 |
| Quadrant-wise count rates Data is divided into 100 sec bins |
 |
|
| Module-wise count rates for Quadrant A Data is divided into 100 sec bins |
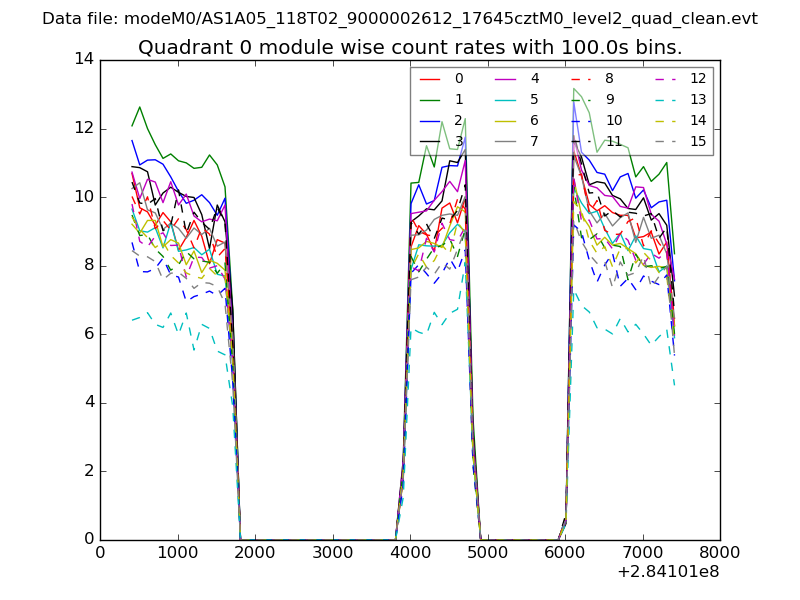 |
 |
| Module-wise count rates for Quadrant B Data is divided into 100 sec bins |
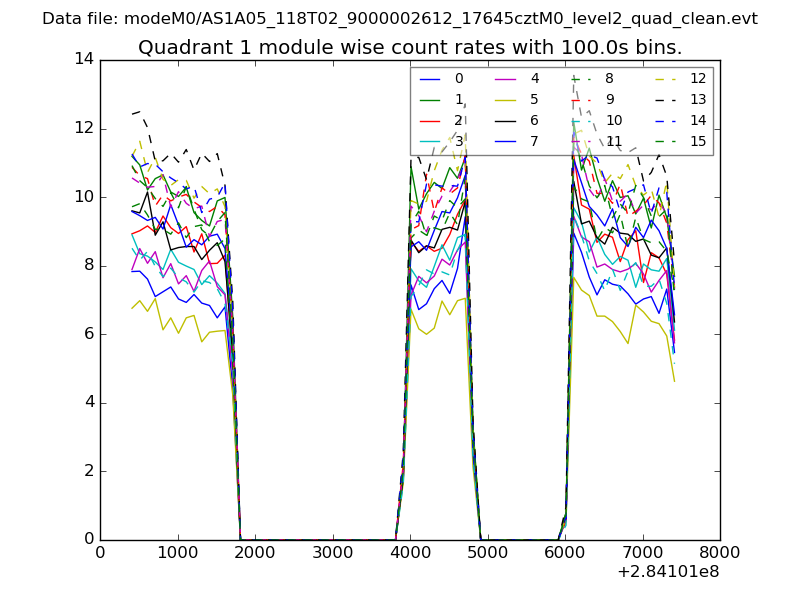 |
 |
| Module-wise count rates for Quadrant C Data is divided into 100 sec bins |
 |
 |
| Module-wise count rates for Quadrant D Data is divided into 100 sec bins |
 |
 |
| Parameter | Plot |
|---|---|
| CZT HV Monitor |  |
| D_VDD | 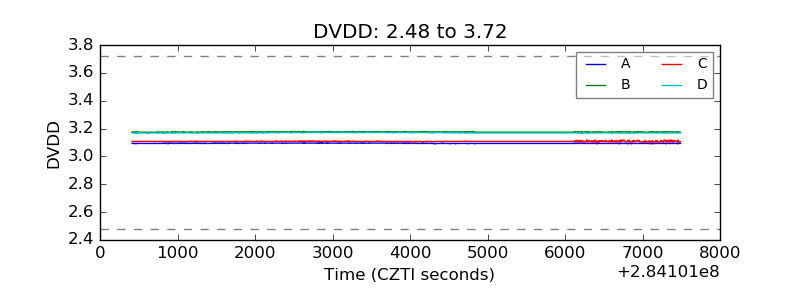 |
| Temperature 1 | 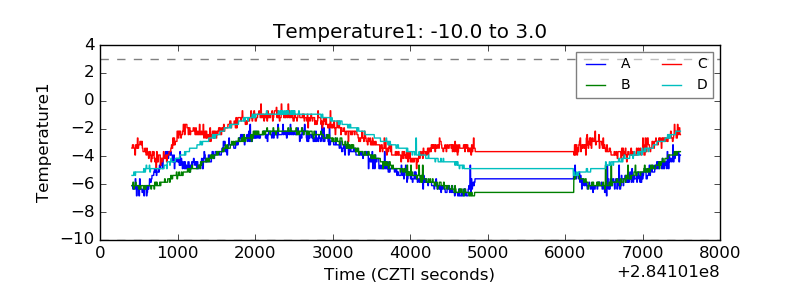 |
| Veto HV Monitor | 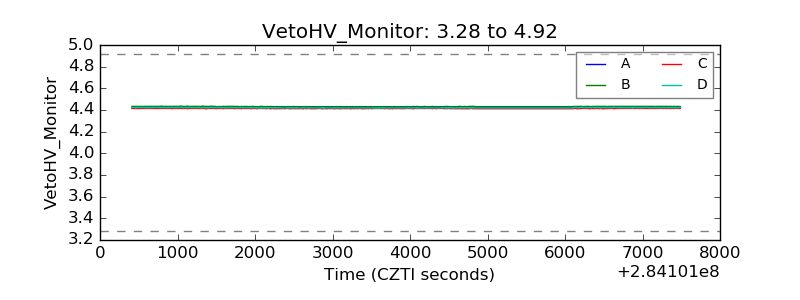 |
| Veto LLD | 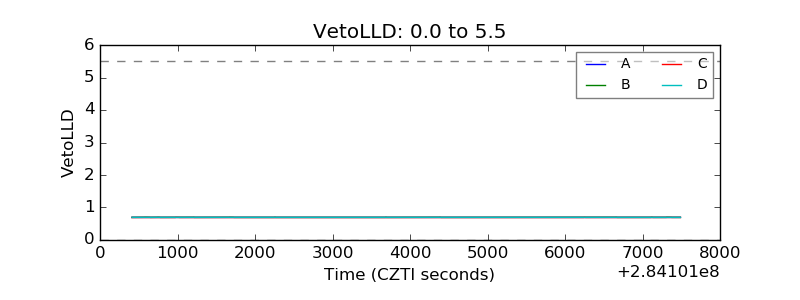 |
| Alpha Counter | 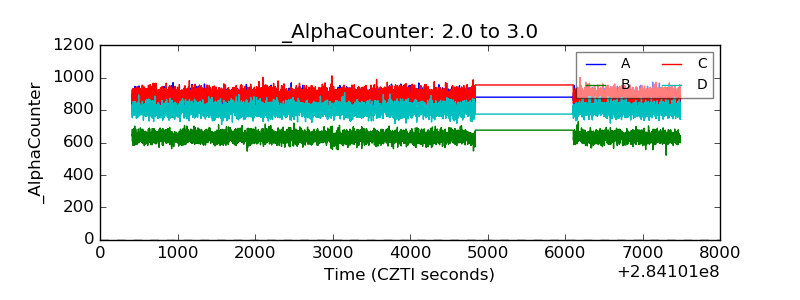 |
| _CPM_Rate | 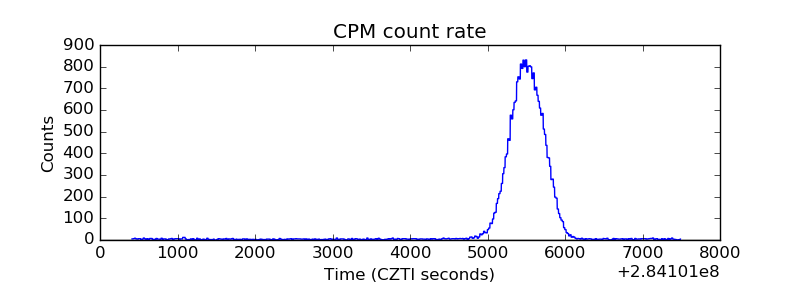 |
| CZT Counter | 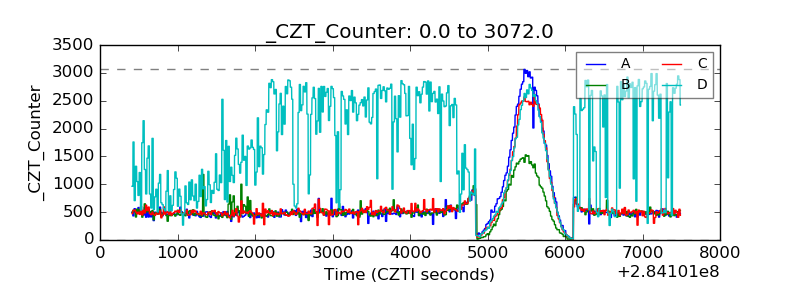 |
| +2.5 Volts monitor |  |
| +5 Volts monitor | 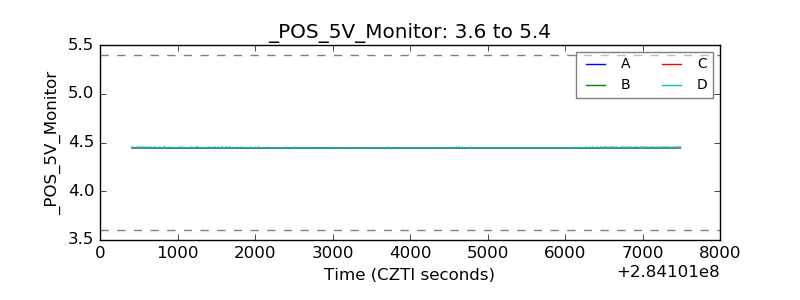 |
| _ROLL_ROT |  |
| _Roll_DEC | 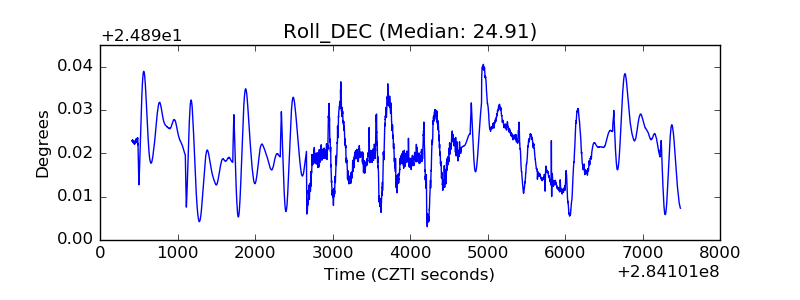 |
| _Roll_RA | 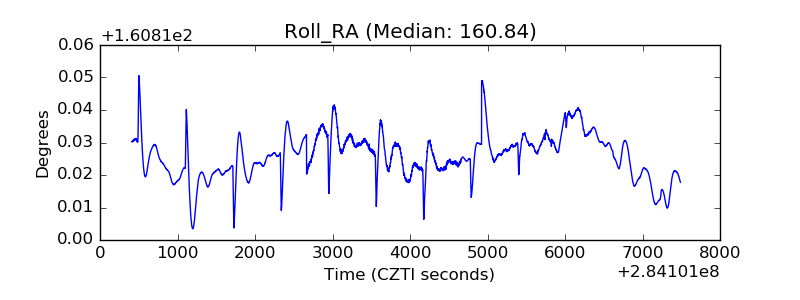 |
| Veto Counter | 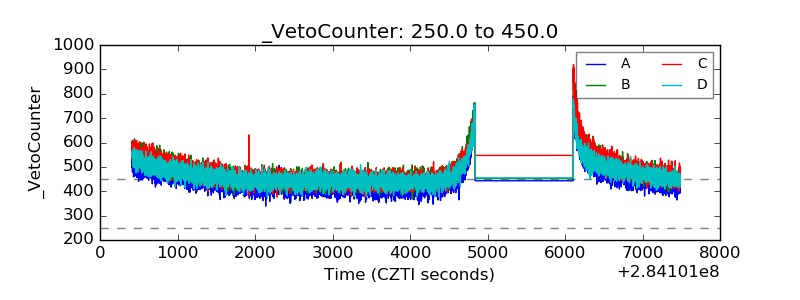 |