| Param | Original file | Final file |
|---|---|---|
| Filename | modeM0/AS1A05_118T02_9000002612_17647cztM0_level2.evt | modeM0/AS1A05_118T02_9000002612_17647cztM0_level2_quad_clean.evt |
| Size (bytes) | 504,328,320 | 84,306,240 |
| Size | 481.0 MB | 80.4 MB |
| Events in quadrant A | 3,298,030 | 528,965 |
| Events in quadrant B | 3,449,484 | 535,614 |
| Events in quadrant C | 3,435,787 | 512,809 |
| Events in quadrant D | 4,620,574 | 493,664 |
| Mode SS | |||
|---|---|---|---|
| Quadrant | BADHDUFLAG | Total packets | Discarded packets |
| A | 0 | 142 | 0 |
| B | 0 | 142 | 0 |
| C | 0 | 142 | 0 |
| D | 0 | 142 | 0 |
| Mode M0 | |||
|---|---|---|---|
| Quadrant | BADHDUFLAG | Total packets | Discarded packets |
| A | 0 | 14194 | 2 |
| B | 0 | 14555 | 2 |
| C | 0 | 14240 | 2 |
| D | 0 | 18109 | 2 |
| Mode M9 | |||
|---|---|---|---|
| Quadrant | BADHDUFLAG | Total packets | Discarded packets |
| A | 0 | 7 | 0 |
| B | 0 | 7 | 0 |
| C | 0 | 7 | 0 |
| D | 0 | 7 | 0 |
| Quadrant | Total seconds | Saturated seconds | Saturation percentage |
|---|---|---|---|
| A | 6909 | 114 | 1.650022% |
| B | 6910 | 120 | 1.736614% |
| C | 6910 | 140 | 2.026049% |
| D | 6910 | 354 | 5.123010% |
Noise dominated data is calculated using 1-second bins in cleaned event files. If a bin has >2000 counts, and if more than 50% of those come from <1% of pixels, then it is considered to be noise-dominated and hence unusable.
| Quadrant | # 1 sec bins | Bins with >0 counts | Bins with >2000 counts | High rate bins dominated by noise | Noise dominated (total time) | Noise dominated (detector-on time) | Marked lightcurve |
|---|---|---|---|---|---|---|---|
| A | 7619 | 6909 | 0 | 0 | 0.00% | 0.00% | 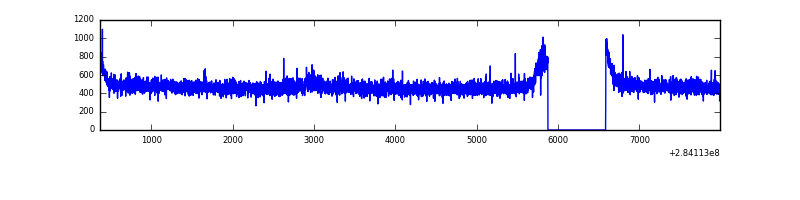 |
| B | 7620 | 6910 | 3 | 3 | 0.04% | 0.04% | 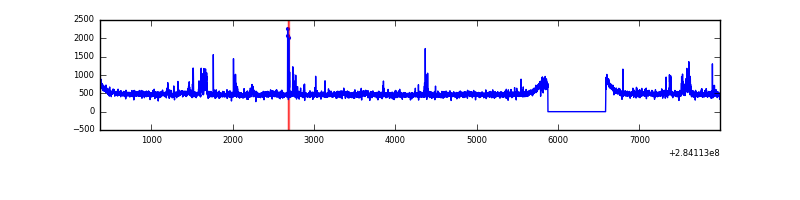 |
| C | 7620 | 6910 | 0 | 0 | 0.00% | 0.00% | 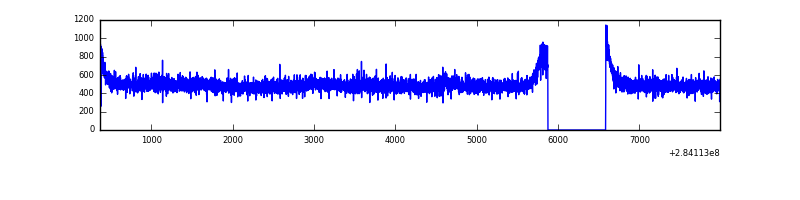 |
| D | 7620 | 6910 | 220 | 220 | 2.89% | 3.18% | 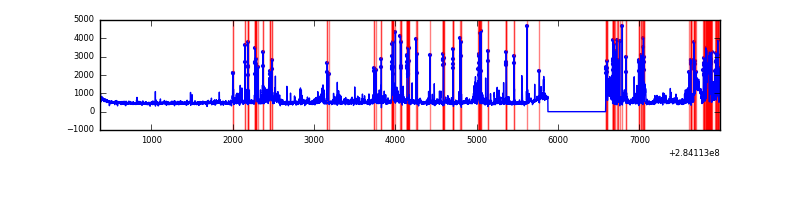 |
Top three noisy pixels from each quadrant. If the there are fewer than three noisy pixels in the level2.evt file, extra rows are filled as -1
| Pixel properties | Quadrant properties | ||||||
|---|---|---|---|---|---|---|---|
| Quadrant | DetID | PixID | Counts | Sigma | Mean | Median | Sigma |
| A | 14 | 237 | 16527 | 90.71 | 854 | 833 | 173.0 |
| A | 0 | 226 | 7578 | 38.99 | 854 | 833 | 173.0 |
| A | 3 | 137 | 6250 | 31.31 | 854 | 833 | 173.0 |
| B | 0 | 230 | 73870 | 445.63 | 845 | 822 | 163.9 |
| B | 12 | 111 | 19657 | 114.9 | 845 | 822 | 163.9 |
| B | 7 | 220 | 17834 | 103.78 | 845 | 822 | 163.9 |
| C | 3 | 233 | 139691 | 732.52 | 813 | 816 | 189.6 |
| C | 14 | 238 | 125063 | 655.36 | 813 | 816 | 189.6 |
| C | 13 | 61 | 5709 | 25.81 | 813 | 816 | 189.6 |
| D | 1 | 52 | 1128717 | 5666.83 | 817 | 794 | 199.0 |
| D | 13 | 189 | 281780 | 1411.71 | 817 | 794 | 199.0 |
| D | 10 | 70 | 47668 | 235.5 | 817 | 794 | 199.0 |
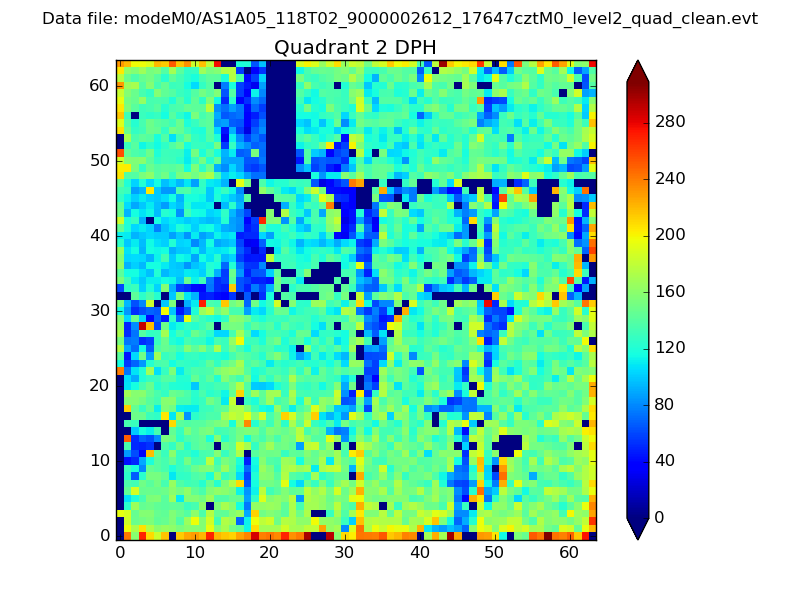
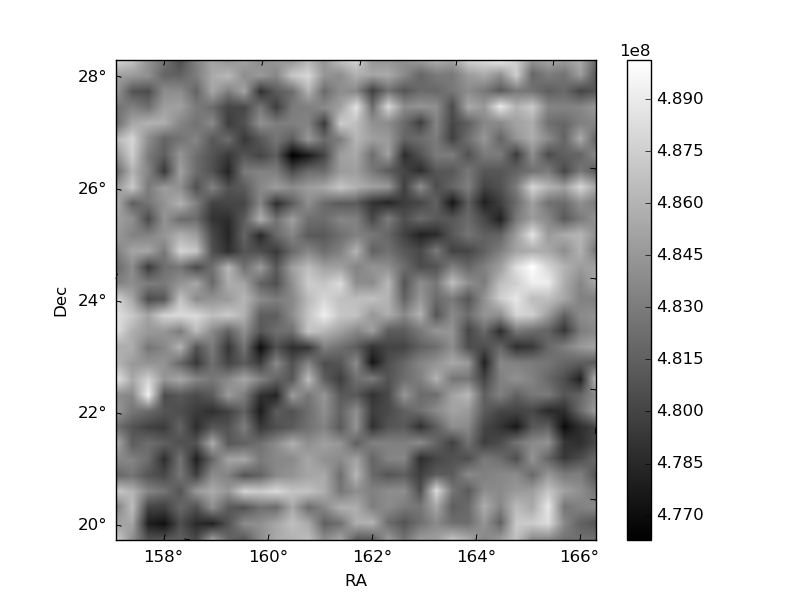
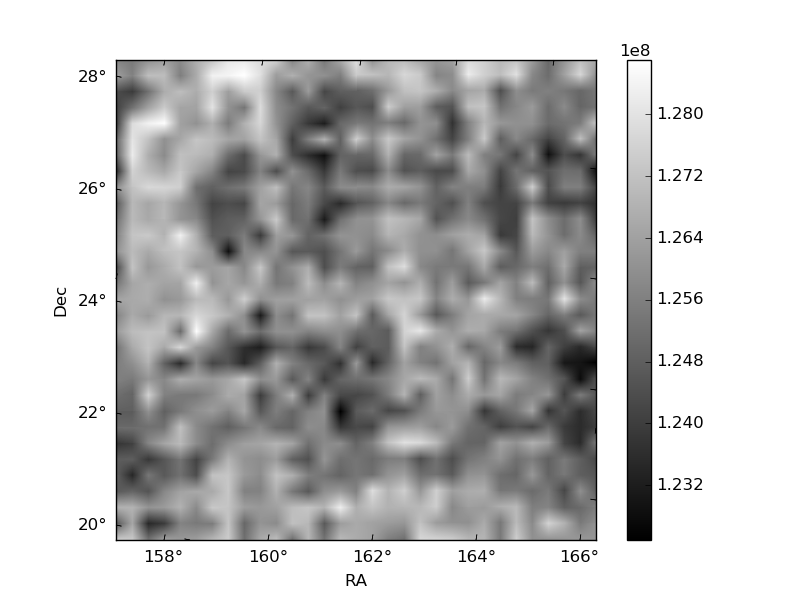
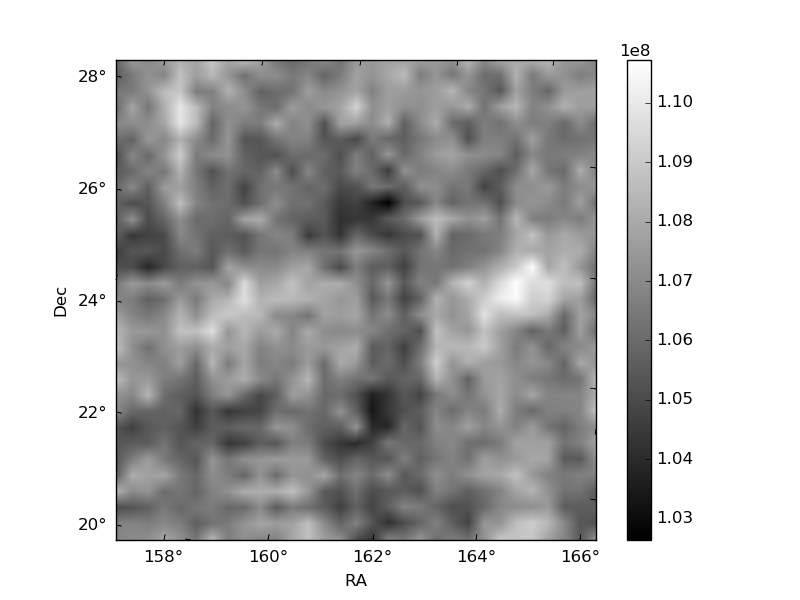
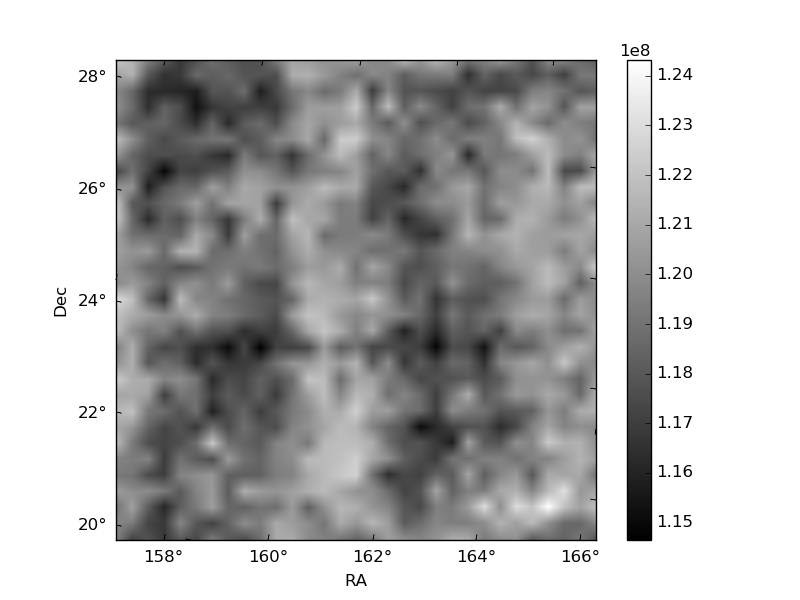
Histogram calculated using DETX and DETY for each event in the final _common_clean file
| Quadrant A | 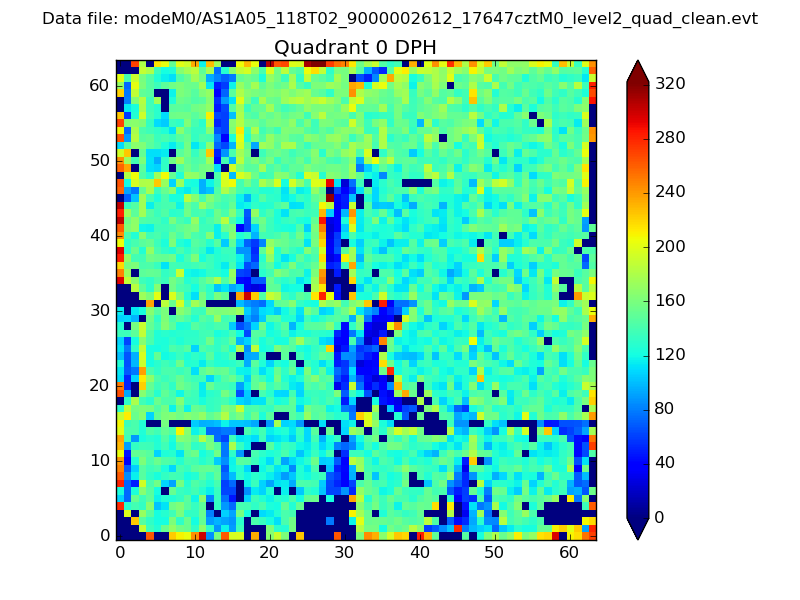 |
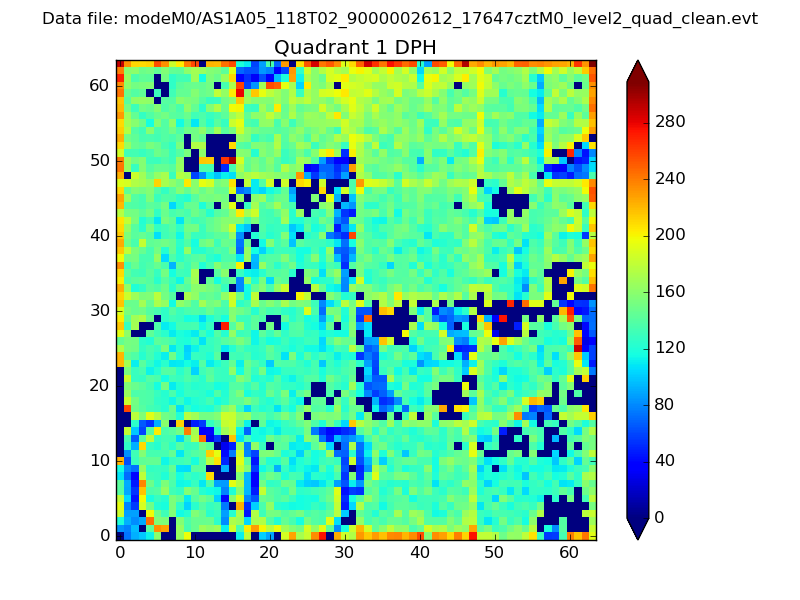 |
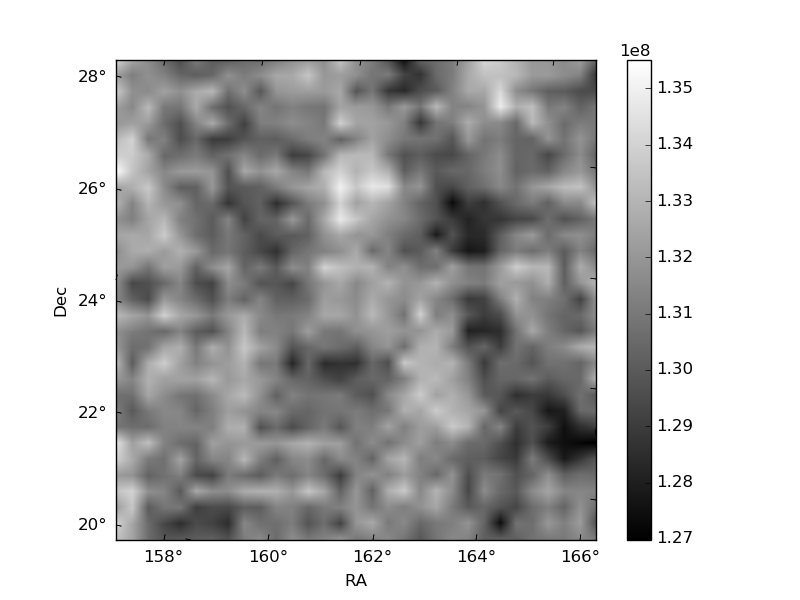
Quadrant B |
|---|---|---|---|
| Quadrant D | 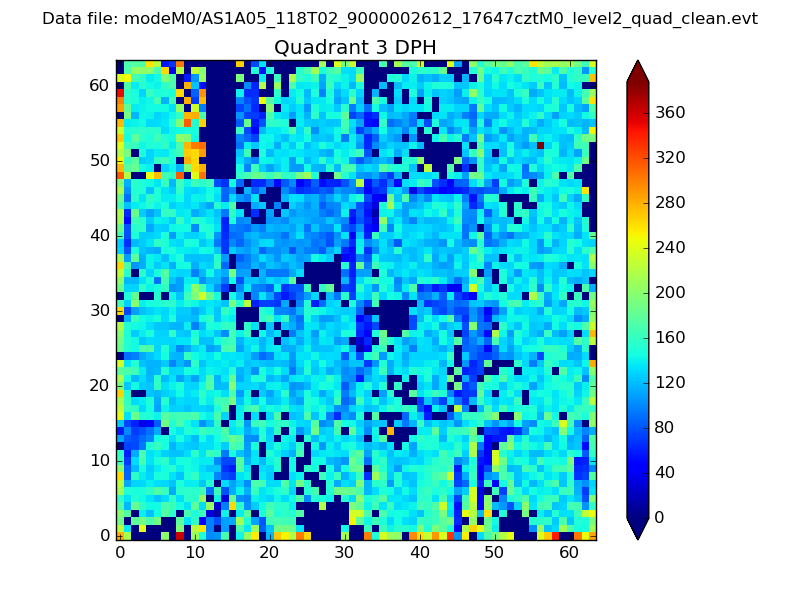 |
 |
Quadrant C |
| Plot type | Count rate plots | Images |
|---|---|---|
| Comparison with Poisson distribution Blue bars denote a histogram of data divided into 1 sec bins. Red curve is a Poisson curve with rate = median count rate of data. |
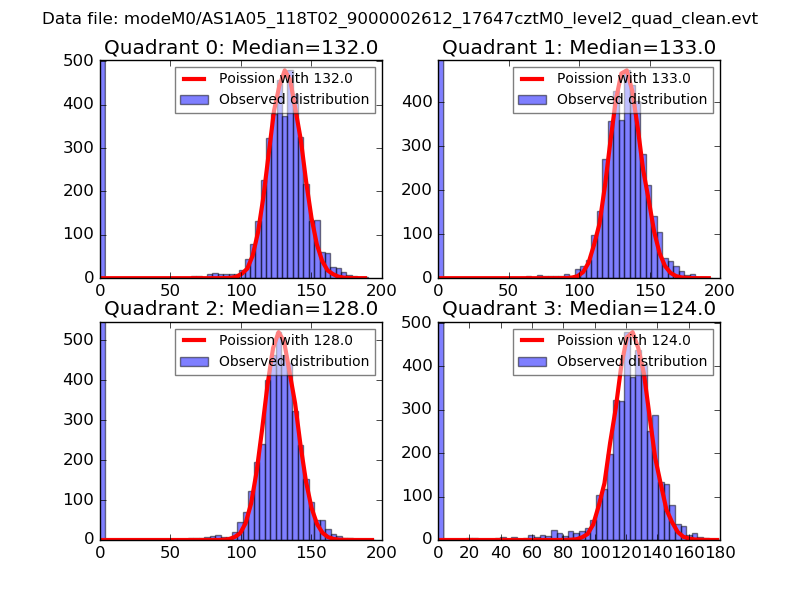 |
 |
| Quadrant-wise count rates Data is divided into 100 sec bins |
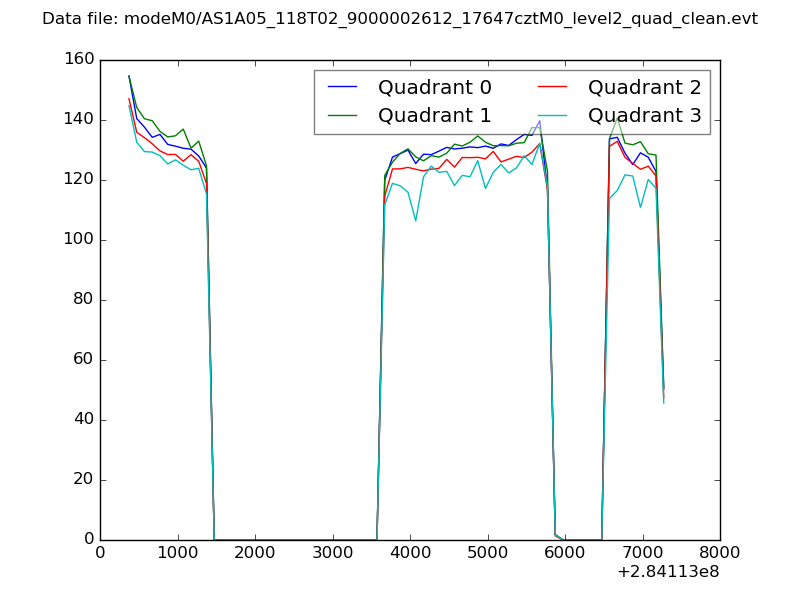 |
|
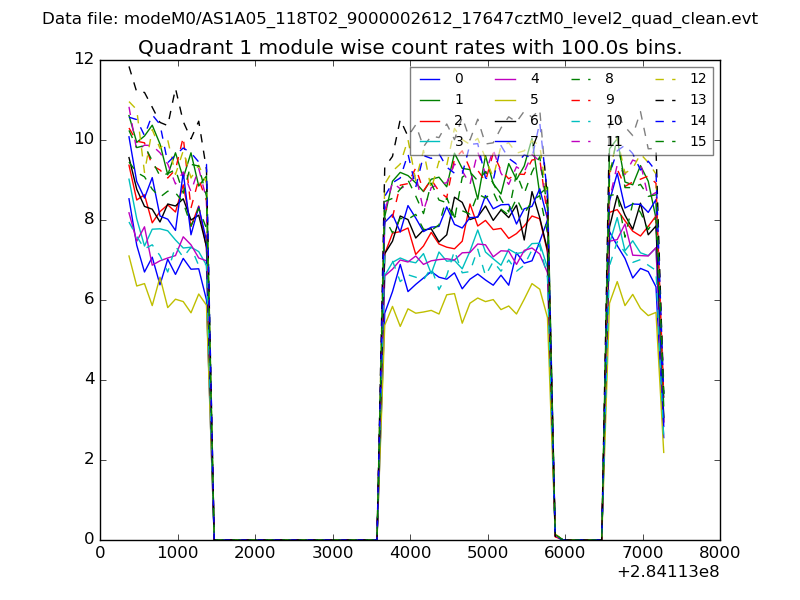
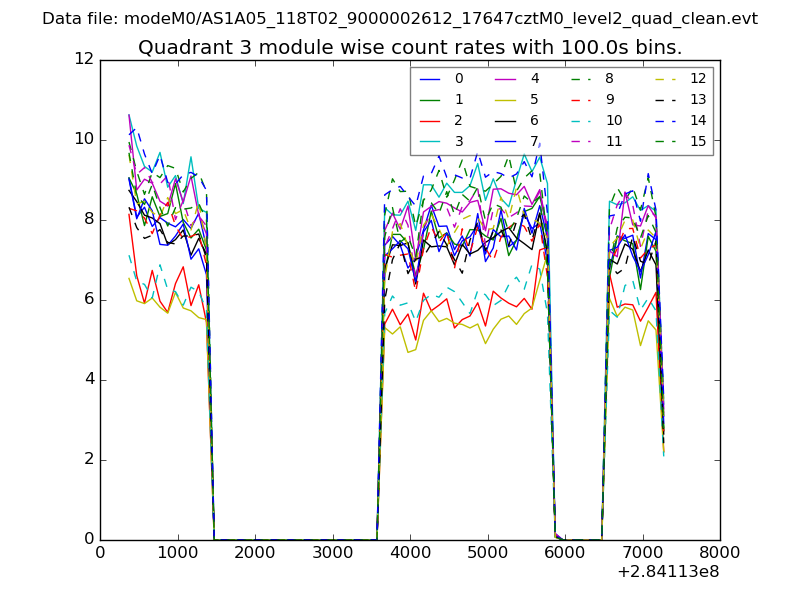
| Module-wise count rates for Quadrant A Data is divided into 100 sec bins |
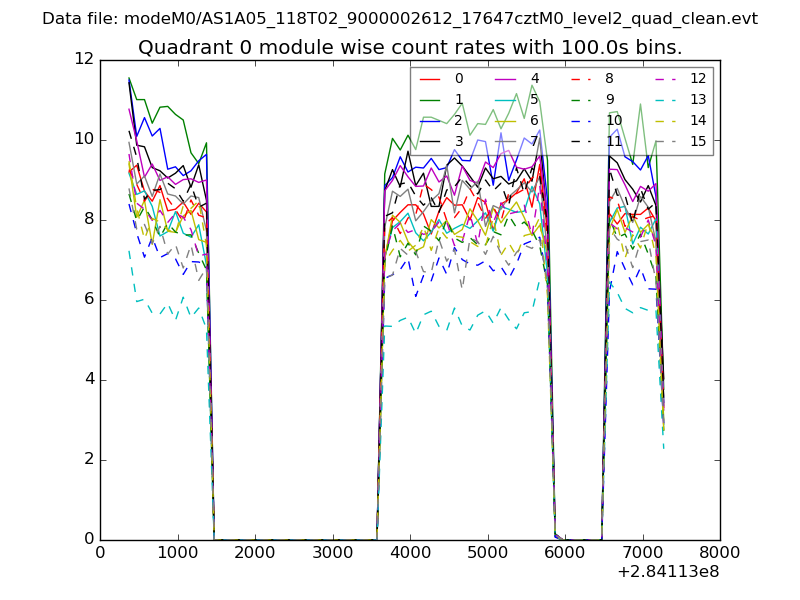 |
 |
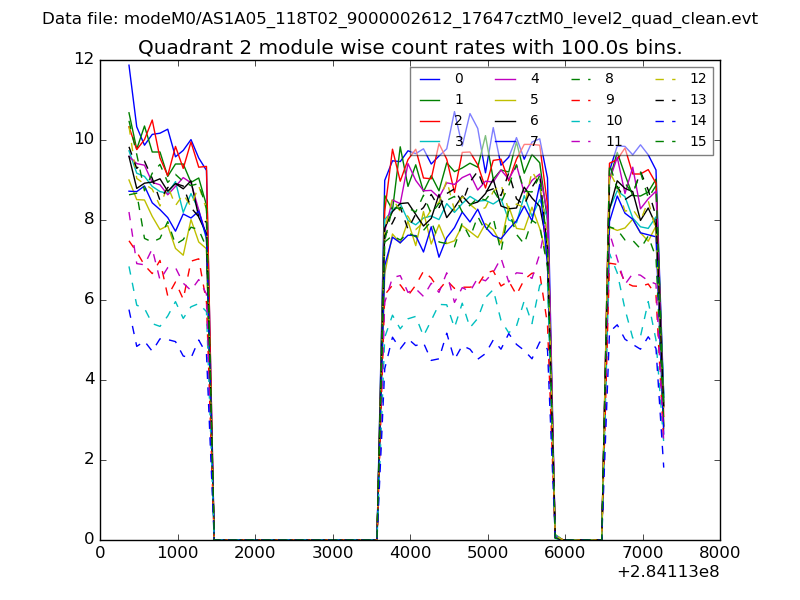
| Module-wise count rates for Quadrant B Data is divided into 100 sec bins |
 |
 |
| Module-wise count rates for Quadrant C Data is divided into 100 sec bins |
 |
 |
| Module-wise count rates for Quadrant D Data is divided into 100 sec bins |
 |
 |
| Parameter | Plot |
|---|---|
| CZT HV Monitor | 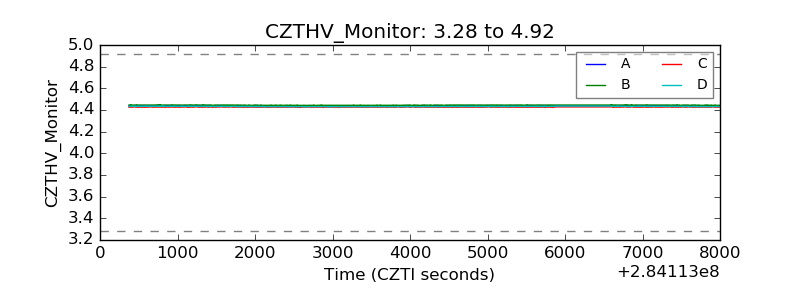 |
| D_VDD |  |
| Temperature 1 |  |
| Veto HV Monitor | 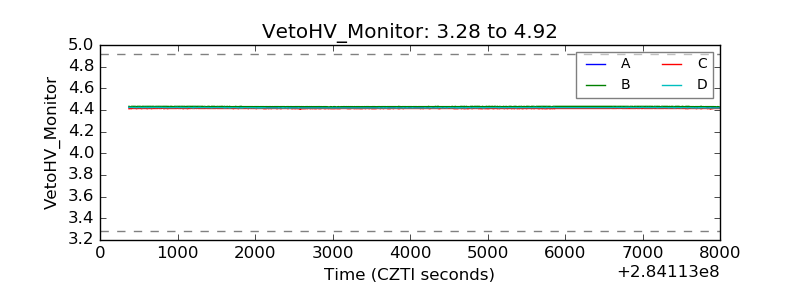 |
| Veto LLD | 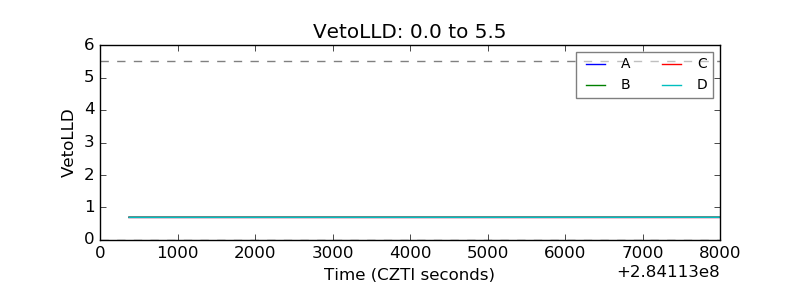 |
| Alpha Counter | 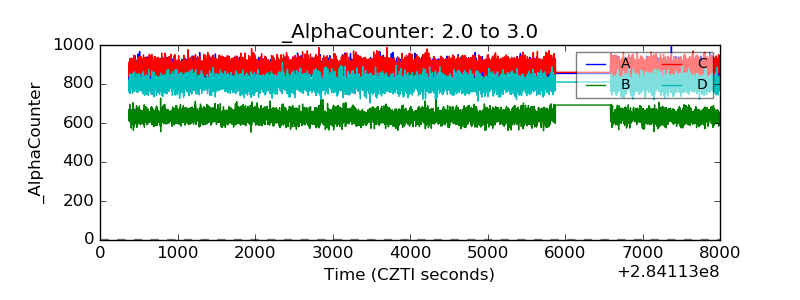 |
| _CPM_Rate | 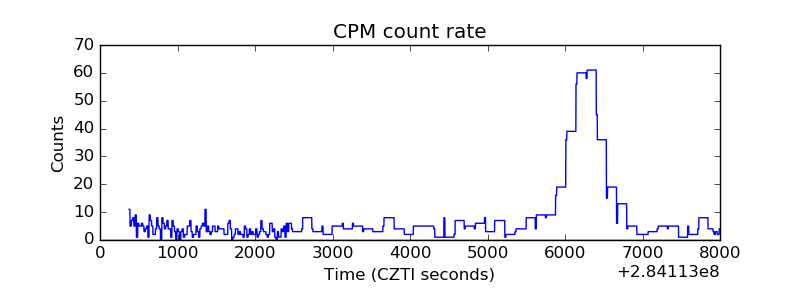 |
| CZT Counter | 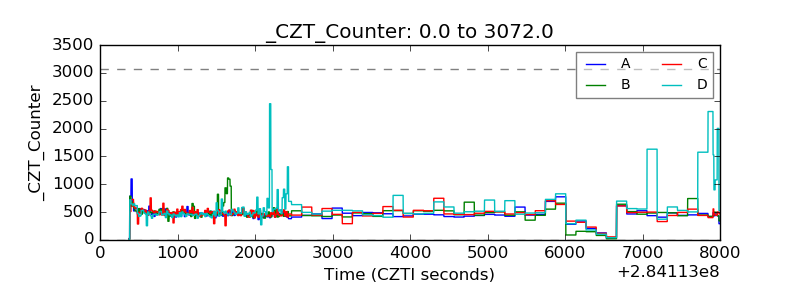 |
| +2.5 Volts monitor | 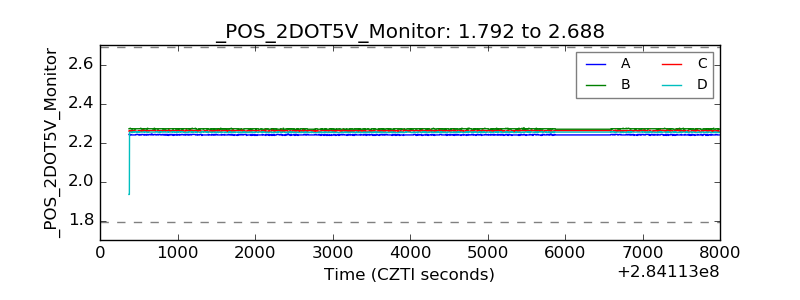 |
| +5 Volts monitor |  |
| _ROLL_ROT | 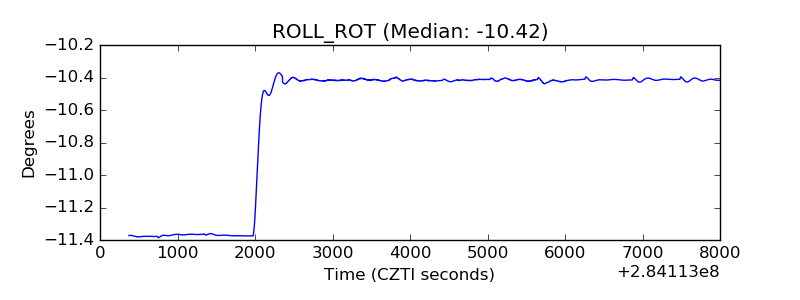 |
| _Roll_DEC | 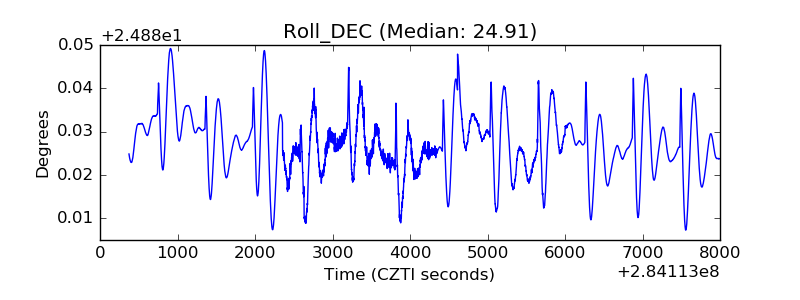 |
| _Roll_RA | 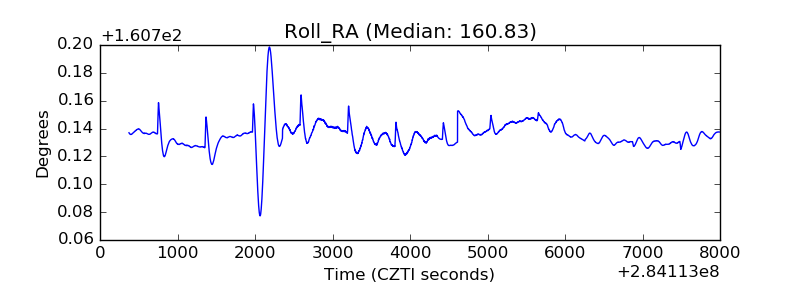 |
| Veto Counter | 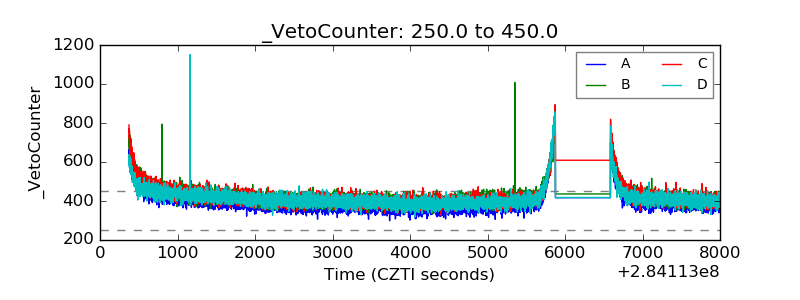 |