| Param | Original file | Final file |
|---|---|---|
| Filename | modeM0/AS1A05_118T02_9000002612_17648cztM0_level2.evt | modeM0/AS1A05_118T02_9000002612_17648cztM0_level2_quad_clean.evt |
| Size (bytes) | 525,378,240 | 80,568,000 |
| Size | 501.0 MB | 76.8 MB |
| Events in quadrant A | 3,423,390 | 492,015 |
| Events in quadrant B | 3,604,787 | 497,113 |
| Events in quadrant C | 3,525,803 | 477,056 |
| Events in quadrant D | 4,863,181 | 466,708 |
| Mode SS | |||
|---|---|---|---|
| Quadrant | BADHDUFLAG | Total packets | Discarded packets |
| A | 0 | 148 | 0 |
| B | 0 | 148 | 0 |
| C | 0 | 148 | 0 |
| D | 0 | 148 | 0 |
| Mode M0 | |||
|---|---|---|---|
| Quadrant | BADHDUFLAG | Total packets | Discarded packets |
| A | 0 | 14897 | 1 |
| B | 0 | 15300 | 1 |
| C | 0 | 14935 | 2 |
| D | 0 | 19305 | 1 |
| Mode M9 | |||
|---|---|---|---|
| Quadrant | BADHDUFLAG | Total packets | Discarded packets |
| A | 0 | 4 | 0 |
| B | 0 | 4 | 0 |
| C | 0 | 4 | 0 |
| D | 0 | 4 | 0 |
| Quadrant | Total seconds | Saturated seconds | Saturation percentage |
|---|---|---|---|
| A | 7277 | 91 | 1.250515% |
| B | 7278 | 96 | 1.319044% |
| C | 7277 | 133 | 1.827676% |
| D | 7277 | 265 | 3.641611% |
Noise dominated data is calculated using 1-second bins in cleaned event files. If a bin has >2000 counts, and if more than 50% of those come from <1% of pixels, then it is considered to be noise-dominated and hence unusable.
| Quadrant | # 1 sec bins | Bins with >0 counts | Bins with >2000 counts | High rate bins dominated by noise | Noise dominated (total time) | Noise dominated (detector-on time) | Marked lightcurve |
|---|---|---|---|---|---|---|---|
| A | 7682 | 7278 | 0 | 0 | 0.00% | 0.00% | 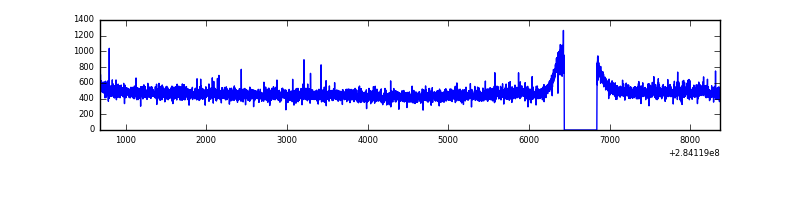 |
| B | 7683 | 7279 | 3 | 3 | 0.04% | 0.04% | 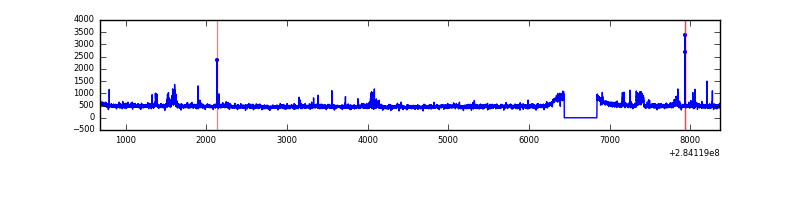 |
| C | 7682 | 7277 | 0 | 0 | 0.00% | 0.00% | 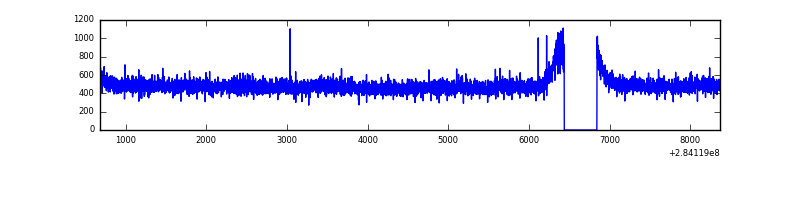 |
| D | 7682 | 7278 | 152 | 152 | 1.98% | 2.09% | 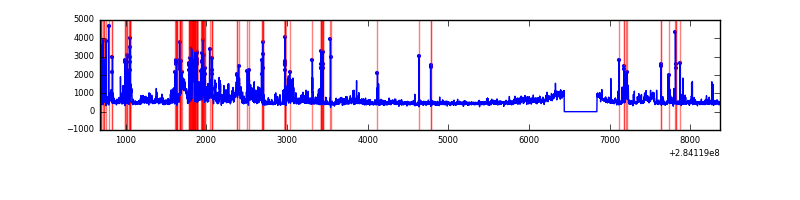 |
Top three noisy pixels from each quadrant. If the there are fewer than three noisy pixels in the level2.evt file, extra rows are filled as -1
| Pixel properties | Quadrant properties | ||||||
|---|---|---|---|---|---|---|---|
| Quadrant | DetID | PixID | Counts | Sigma | Mean | Median | Sigma |
| A | 14 | 237 | 13370 | 69.25 | 887 | 866 | 180.6 |
| A | 0 | 226 | 7913 | 39.03 | 887 | 866 | 180.6 |
| A | 3 | 137 | 6529 | 31.36 | 887 | 866 | 180.6 |
| B | 0 | 230 | 77839 | 453.57 | 880 | 857 | 169.7 |
| B | 4 | 80 | 23453 | 133.13 | 880 | 857 | 169.7 |
| B | 0 | 189 | 20544 | 115.99 | 880 | 857 | 169.7 |
| C | 14 | 238 | 129530 | 649.06 | 845 | 852 | 198.3 |
| C | 3 | 233 | 93434 | 466.99 | 845 | 852 | 198.3 |
| C | 5 | 218 | 7346 | 32.76 | 845 | 852 | 198.3 |
| D | 1 | 52 | 1227037 | 5825.85 | 854 | 827 | 210.5 |
| D | 13 | 189 | 302676 | 1434.11 | 854 | 827 | 210.5 |
| D | 2 | 120 | 36249 | 168.29 | 854 | 827 | 210.5 |
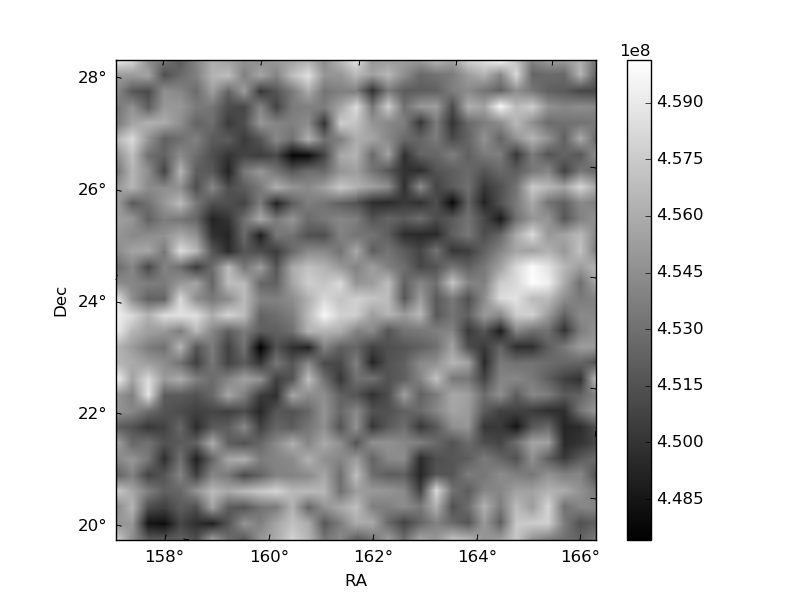
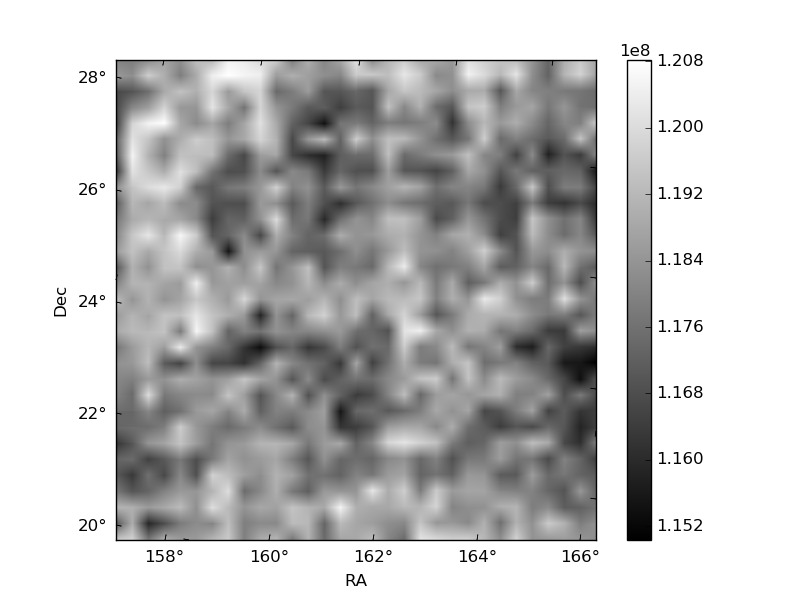
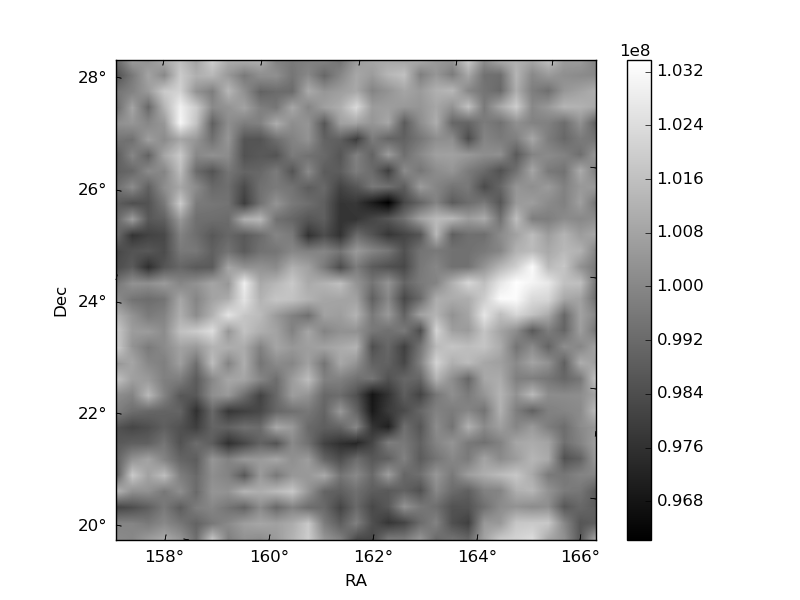
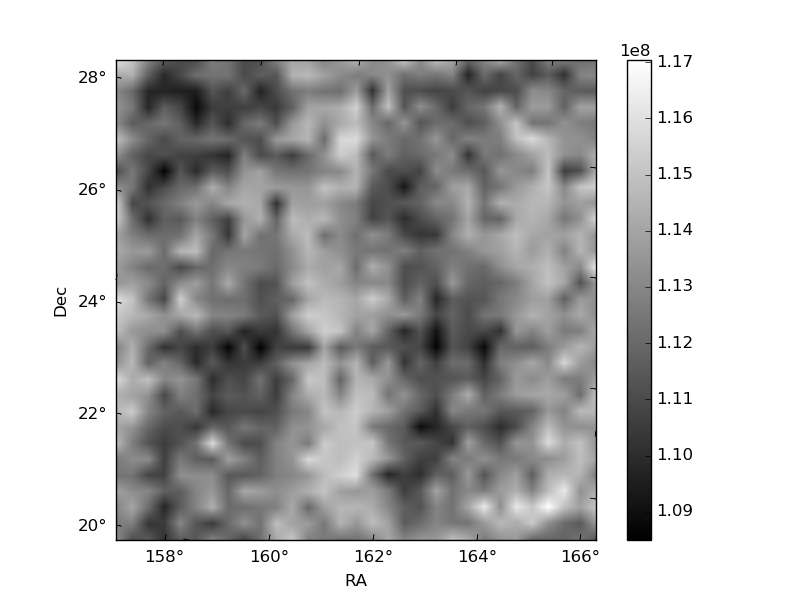
Histogram calculated using DETX and DETY for each event in the final _common_clean file
| Quadrant A | 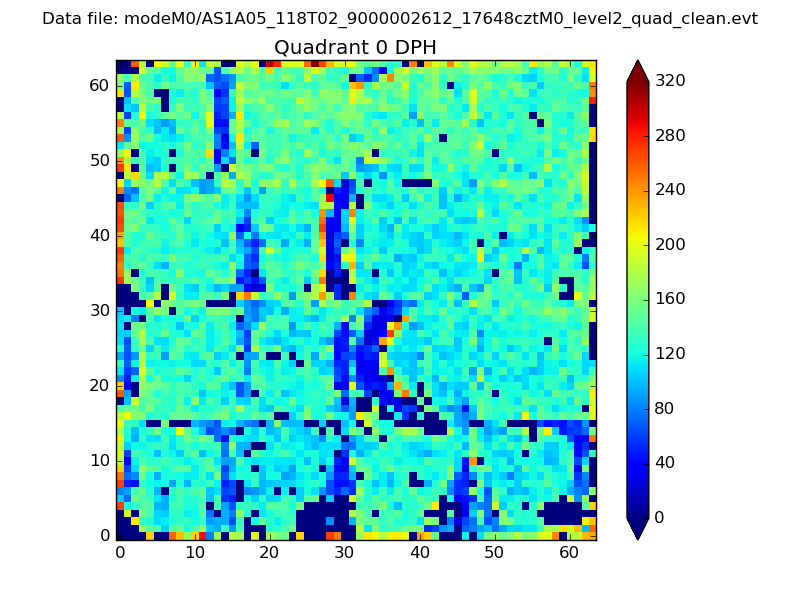 |
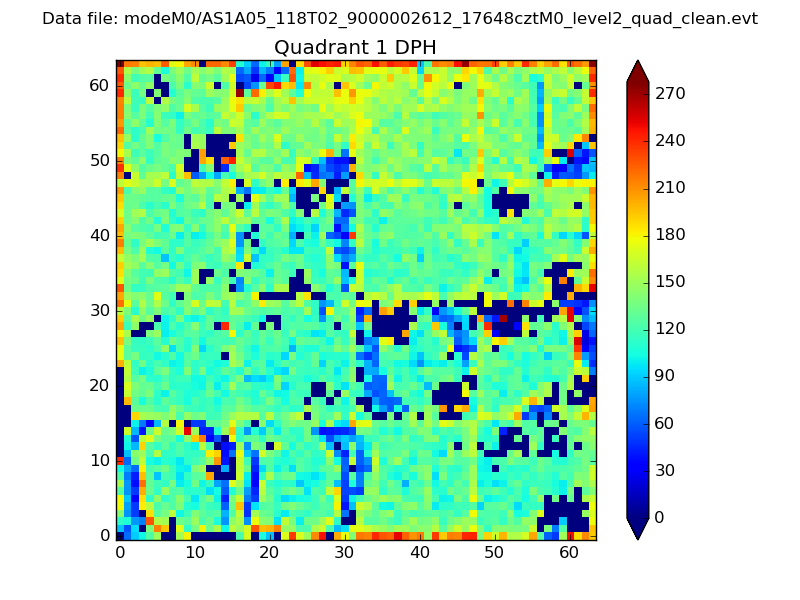 |
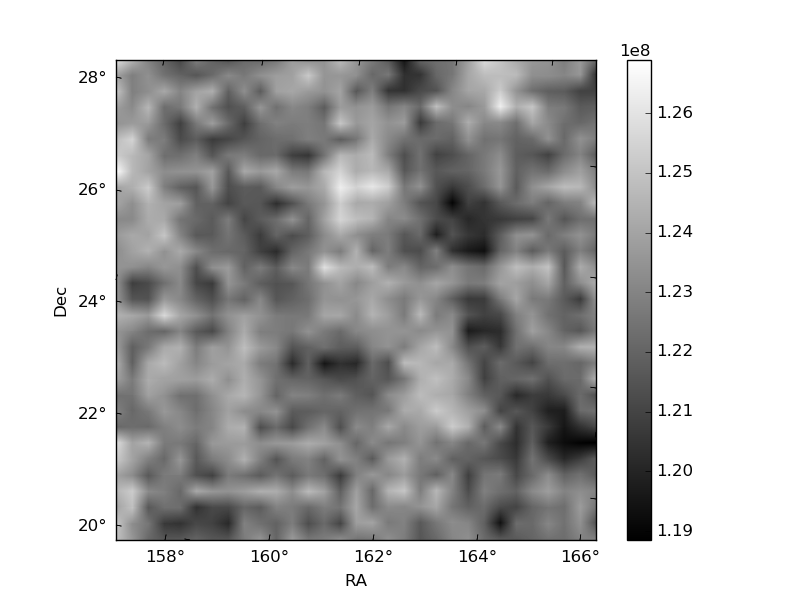
Quadrant B |
|---|---|---|---|
| Quadrant D | 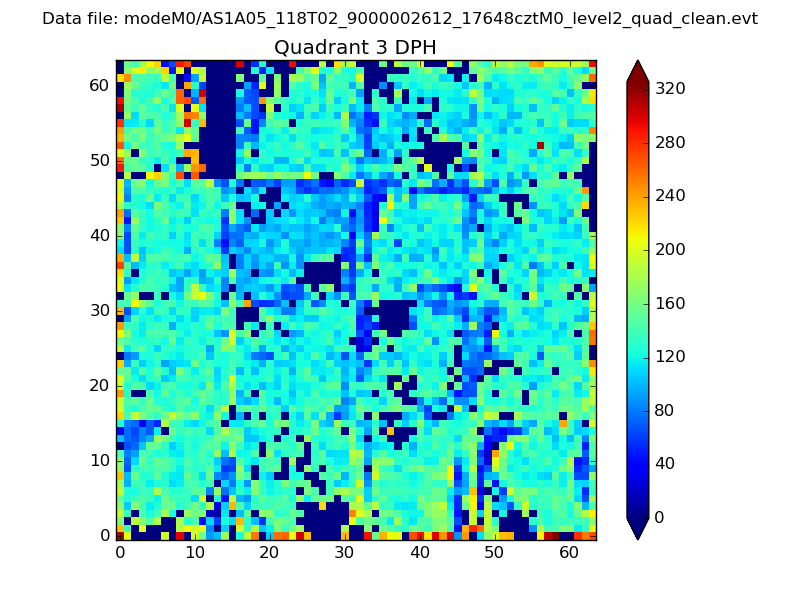 |
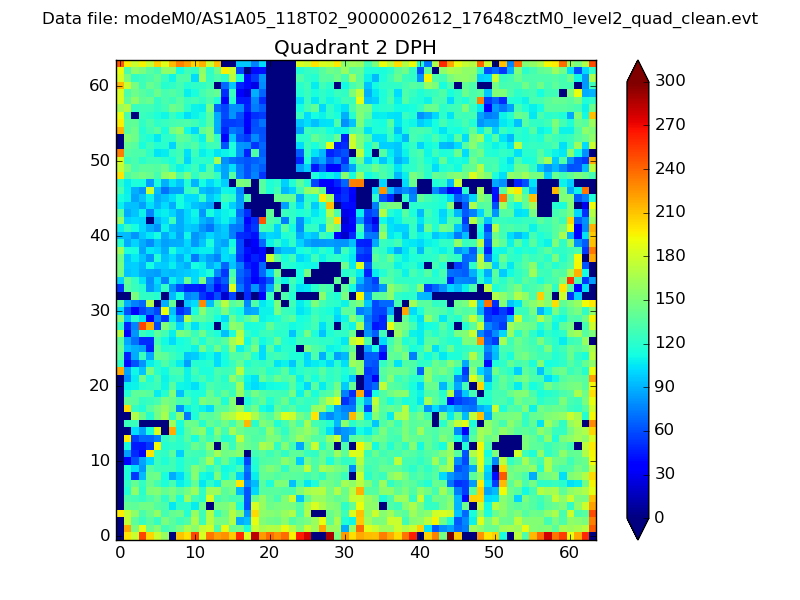 |
Quadrant C |
| Plot type | Count rate plots | Images |
|---|---|---|
| Comparison with Poisson distribution Blue bars denote a histogram of data divided into 1 sec bins. Red curve is a Poisson curve with rate = median count rate of data. |
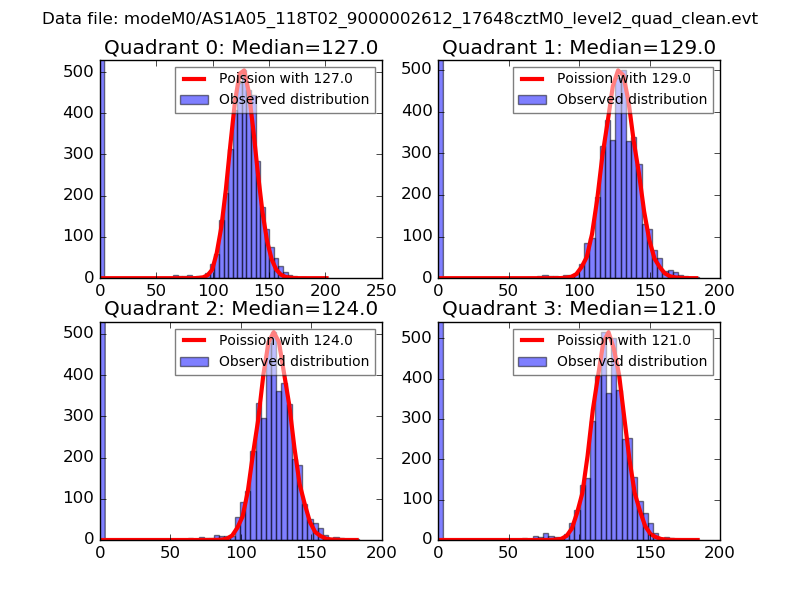 |
 |
| Quadrant-wise count rates Data is divided into 100 sec bins |
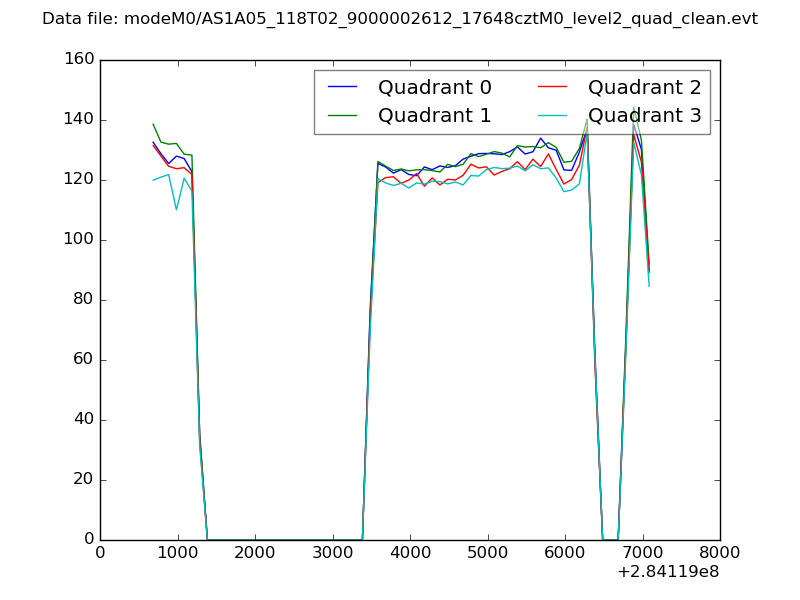 |
|
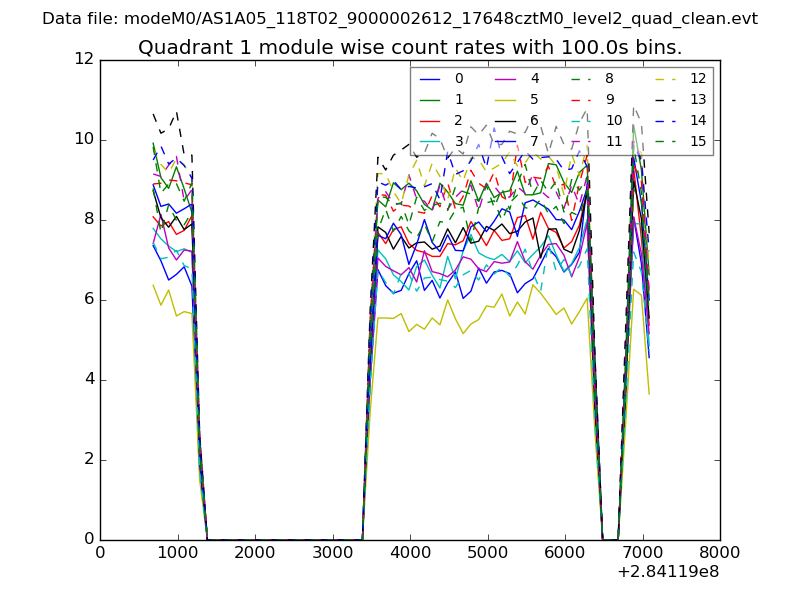
| Module-wise count rates for Quadrant A Data is divided into 100 sec bins |
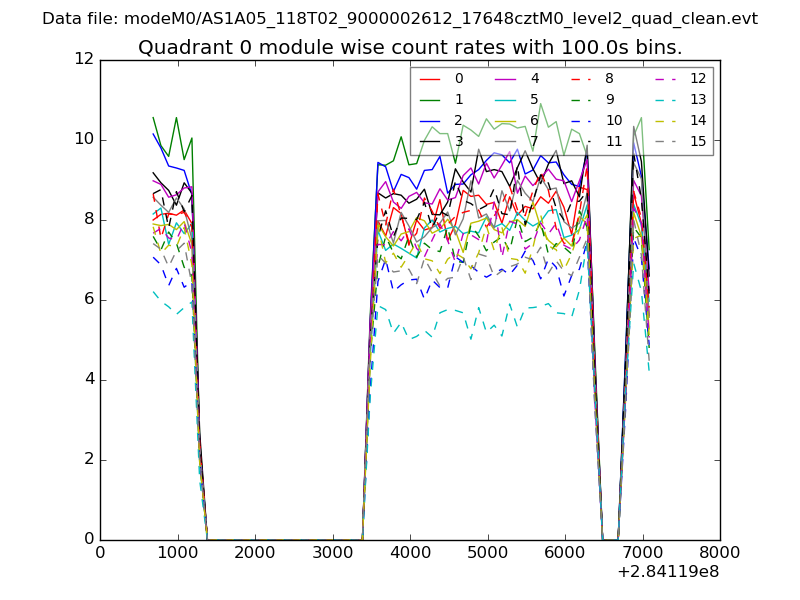 |
 |
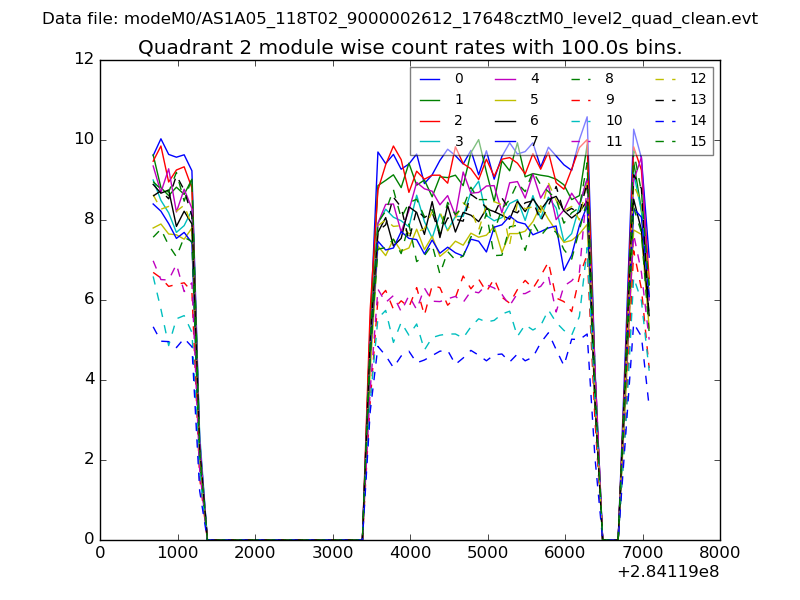
| Module-wise count rates for Quadrant B Data is divided into 100 sec bins |
 |
 |
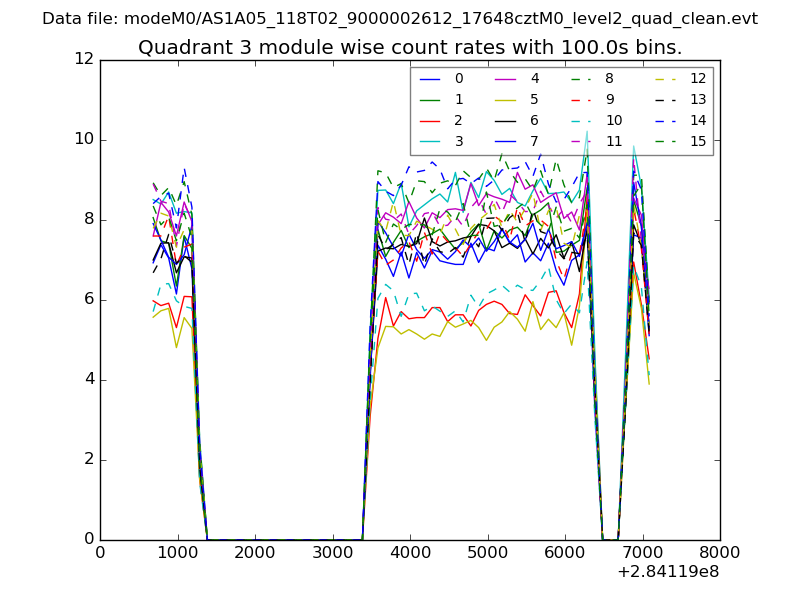
| Module-wise count rates for Quadrant C Data is divided into 100 sec bins |
 |
 |
| Module-wise count rates for Quadrant D Data is divided into 100 sec bins |
 |
 |
| Parameter | Plot |
|---|---|
| CZT HV Monitor | 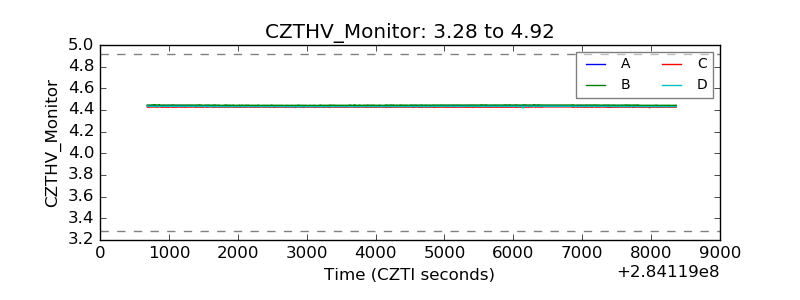 |
| D_VDD | 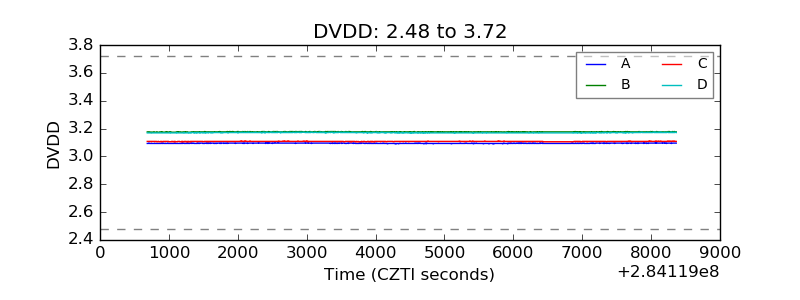 |
| Temperature 1 | 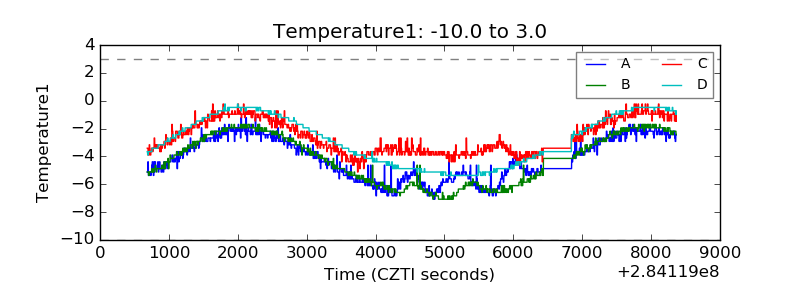 |
| Veto HV Monitor | 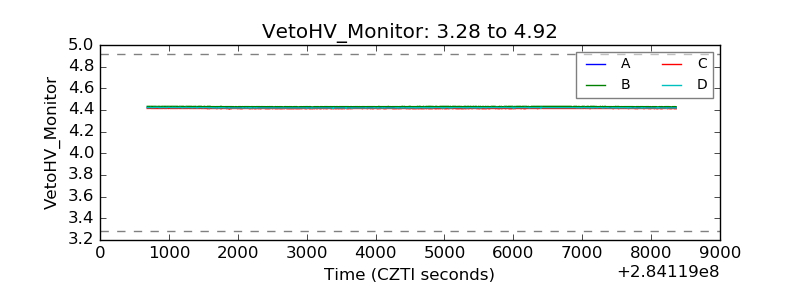 |
| Veto LLD | 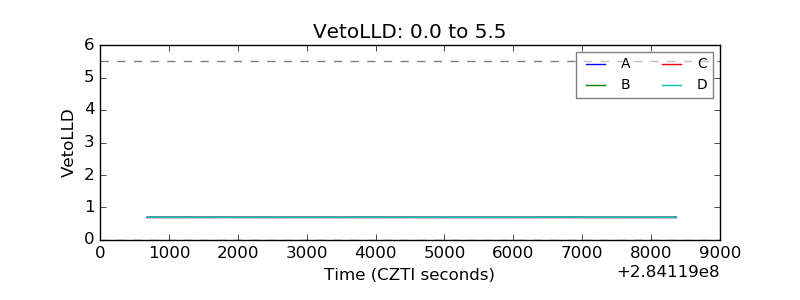 |
| Alpha Counter | 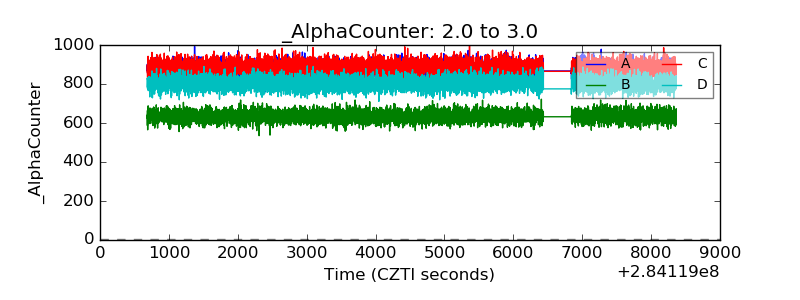 |
| _CPM_Rate | 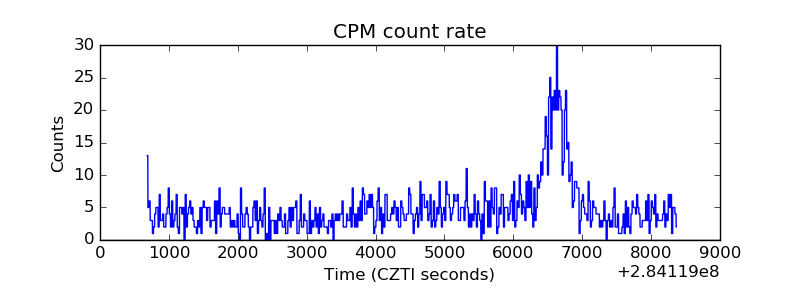 |
| CZT Counter | 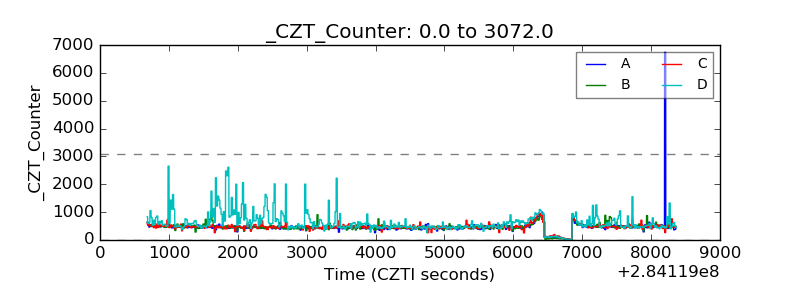 |
| +2.5 Volts monitor |  |
| +5 Volts monitor | 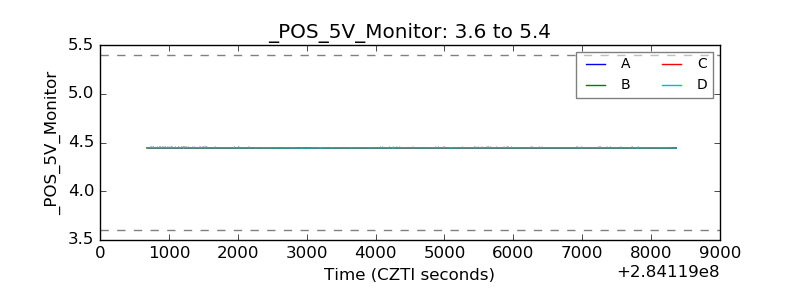 |
| _ROLL_ROT | 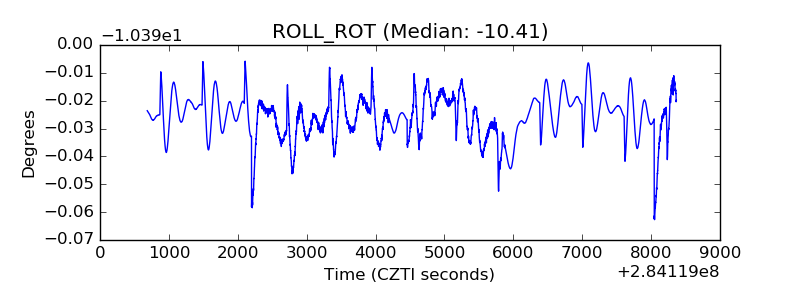 |
| _Roll_DEC | 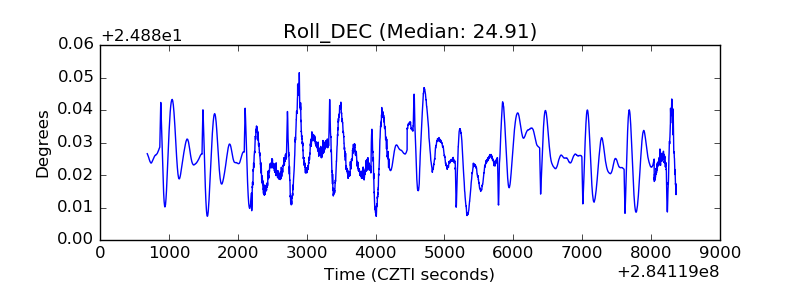 |
| _Roll_RA | 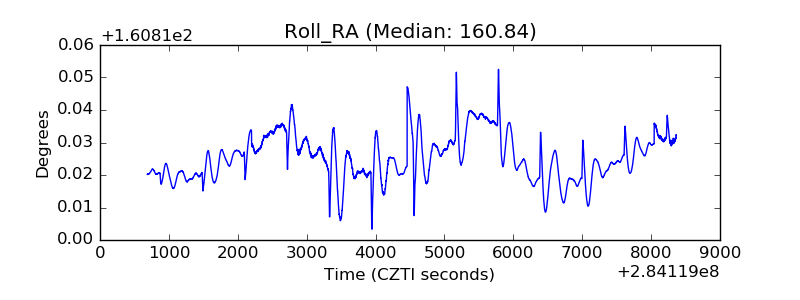 |
| Veto Counter |  |