| Param | Original file | Final file |
|---|---|---|
| Filename | modeM0/AS1A05_118T02_9000002612_17650cztM0_level2.evt | modeM0/AS1A05_118T02_9000002612_17650cztM0_level2_quad_clean.evt |
| Size (bytes) | 746,110,080 | 71,308,800 |
| Size | 711.5 MB | 68.0 MB |
| Events in quadrant A | 3,416,572 | 447,155 |
| Events in quadrant B | 3,605,008 | 449,093 |
| Events in quadrant C | 4,052,891 | 431,482 |
| Events in quadrant D | 11,032,477 | 327,332 |
| Mode SS | |||
|---|---|---|---|
| Quadrant | BADHDUFLAG | Total packets | Discarded packets |
| A | 0 | 146 | 0 |
| B | 0 | 146 | 0 |
| C | 0 | 146 | 0 |
| D | 0 | 146 | 0 |
| Mode M0 | |||
|---|---|---|---|
| Quadrant | BADHDUFLAG | Total packets | Discarded packets |
| A | 0 | 14857 | 1 |
| B | 0 | 15358 | 1 |
| C | 0 | 16669 | 1 |
| D | 0 | 37713 | 1 |
| Mode M9 | |||
|---|---|---|---|
| Quadrant | BADHDUFLAG | Total packets | Discarded packets |
| A | 0 | 5 | 0 |
| B | 0 | 5 | 0 |
| C | 0 | 5 | 0 |
| D | 0 | 5 | 0 |
| Quadrant | Total seconds | Saturated seconds | Saturation percentage |
|---|---|---|---|
| A | 7228 | 33 | 0.456558% |
| B | 7229 | 78 | 1.078987% |
| C | 7229 | 100 | 1.383317% |
| D | 7229 | 2872 | 39.728870% |
Noise dominated data is calculated using 1-second bins in cleaned event files. If a bin has >2000 counts, and if more than 50% of those come from <1% of pixels, then it is considered to be noise-dominated and hence unusable.
| Quadrant | # 1 sec bins | Bins with >0 counts | Bins with >2000 counts | High rate bins dominated by noise | Noise dominated (total time) | Noise dominated (detector-on time) | Marked lightcurve |
|---|---|---|---|---|---|---|---|
| A | 7684 | 7229 | 0 | 0 | 0.00% | 0.00% | 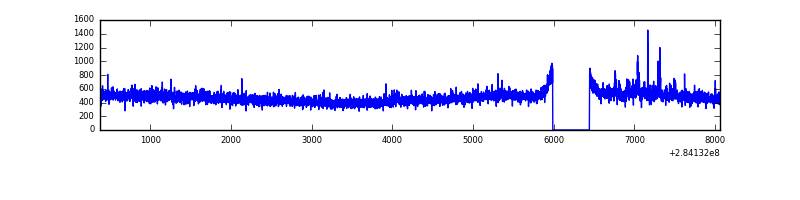 |
| B | 7685 | 7230 | 28 | 28 | 0.36% | 0.39% | 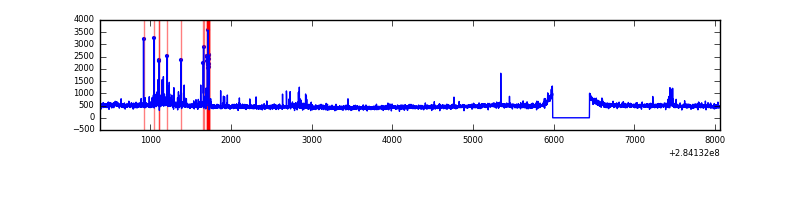 |
| C | 7685 | 7229 | 1 | 1 | 0.01% | 0.01% | 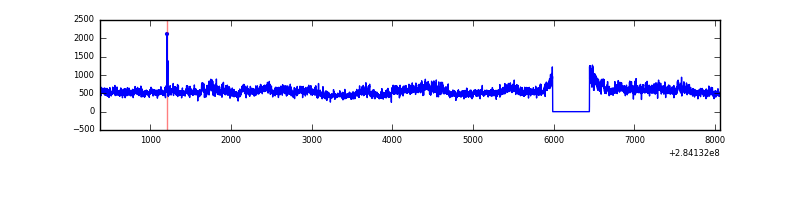 |
| D | 7685 | 7230 | 2686 | 2686 | 34.95% | 37.15% | 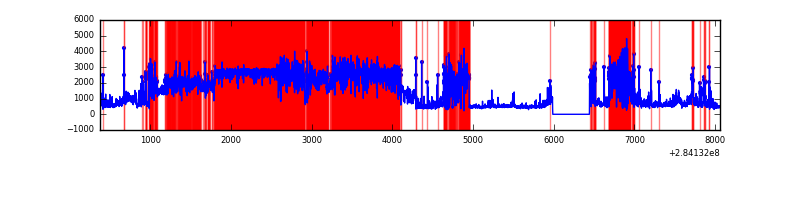 |
Top three noisy pixels from each quadrant. If the there are fewer than three noisy pixels in the level2.evt file, extra rows are filled as -1
| Pixel properties | Quadrant properties | ||||||
|---|---|---|---|---|---|---|---|
| Quadrant | DetID | PixID | Counts | Sigma | Mean | Median | Sigma |
| A | 14 | 237 | 69968 | 390.23 | 871 | 853 | 177.1 |
| A | 0 | 226 | 7520 | 37.64 | 871 | 853 | 177.1 |
| A | 3 | 137 | 6606 | 32.48 | 871 | 853 | 177.1 |
| B | 7 | 220 | 127473 | 762.73 | 862 | 842 | 166.0 |
| B | 4 | 216 | 31180 | 182.73 | 862 | 842 | 166.0 |
| B | 4 | 80 | 22692 | 131.61 | 862 | 842 | 166.0 |
| C | 3 | 233 | 669322 | 3433.64 | 829 | 836 | 194.7 |
| C | 14 | 238 | 126296 | 644.42 | 829 | 836 | 194.7 |
| C | 5 | 218 | 12277 | 58.77 | 829 | 836 | 194.7 |
| D | 1 | 52 | 8099364 | 45156.59 | 717 | 691 | 179.3 |
| D | 13 | 189 | 103762 | 574.7 | 717 | 691 | 179.3 |
| D | 12 | 233 | 66273 | 365.67 | 717 | 691 | 179.3 |
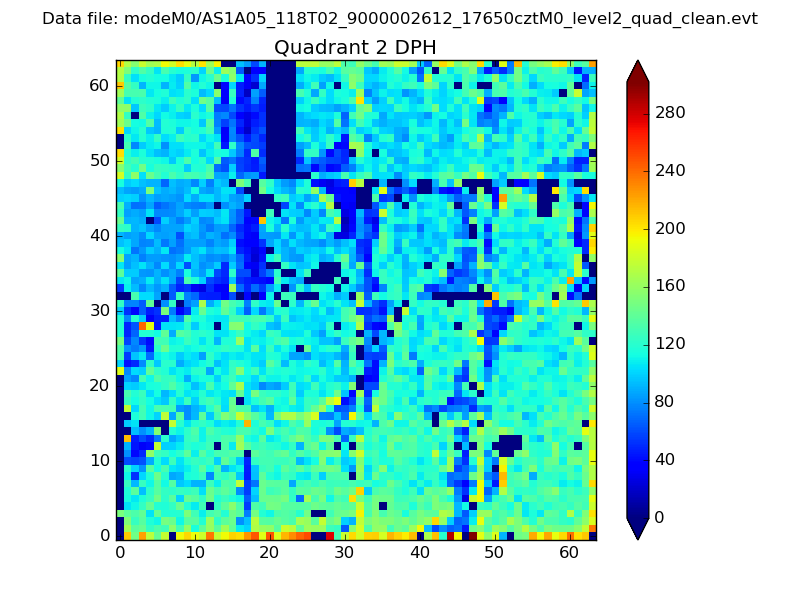
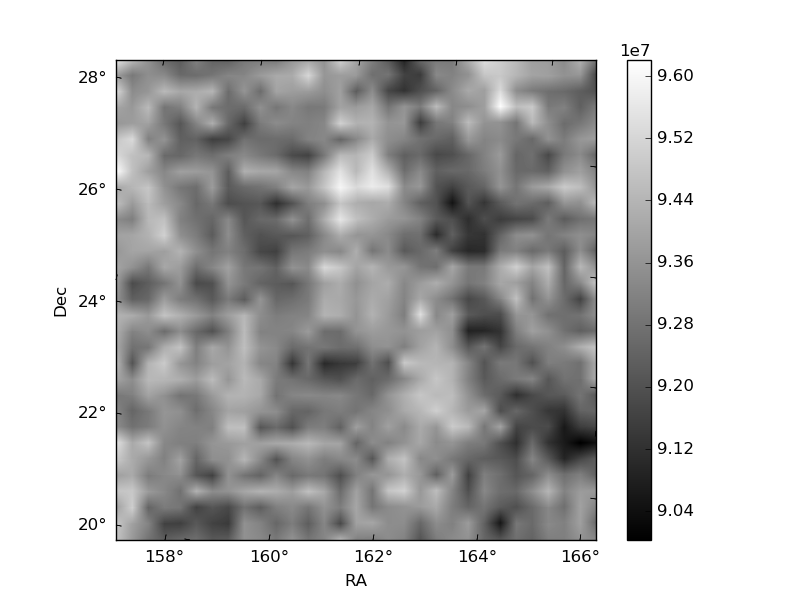
Histogram calculated using DETX and DETY for each event in the final _common_clean file
| Quadrant A | 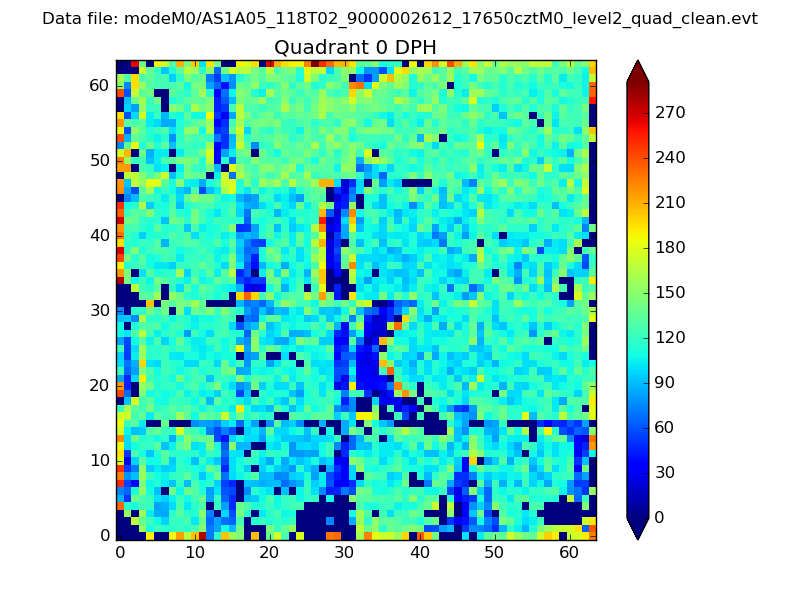 |
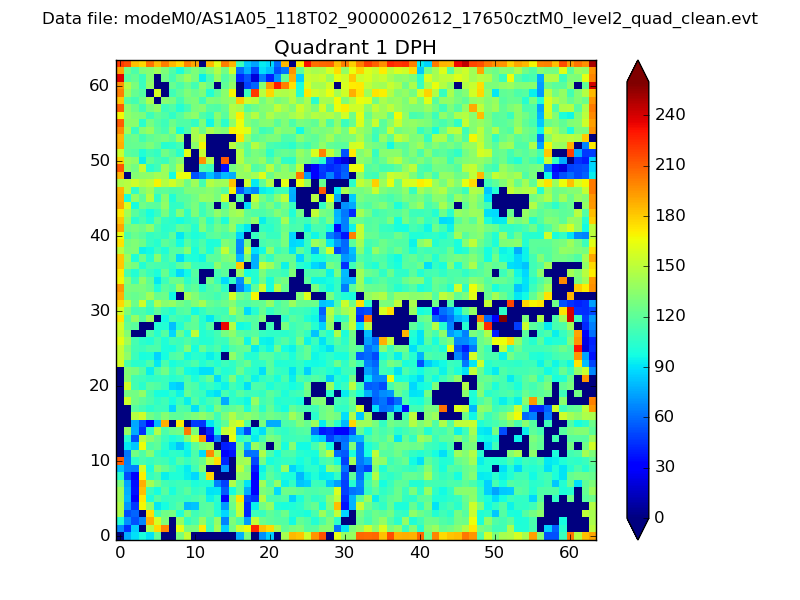 |
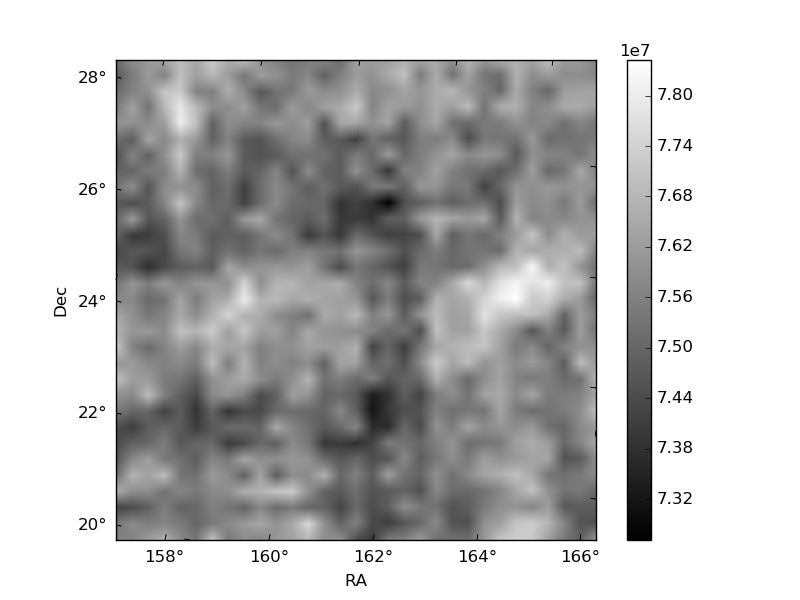
Quadrant B |
|---|---|---|---|
| Quadrant D | 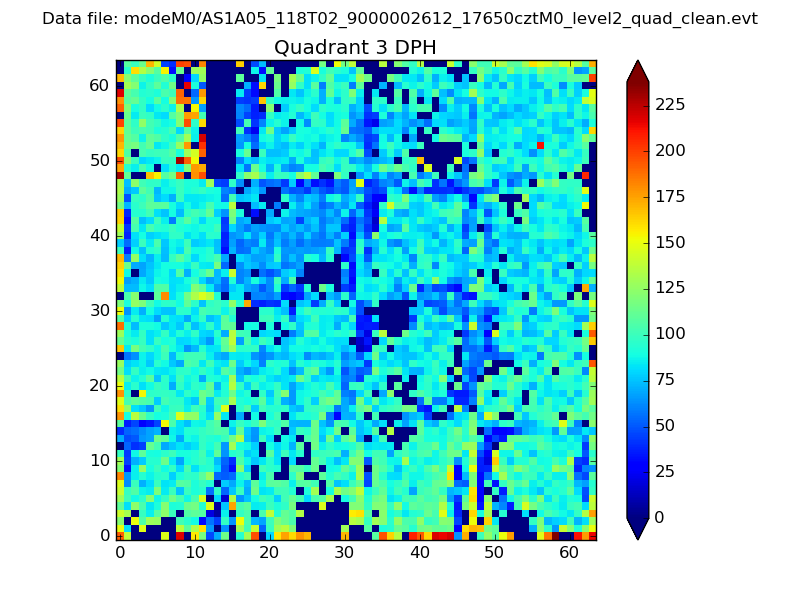 |
 |
Quadrant C |
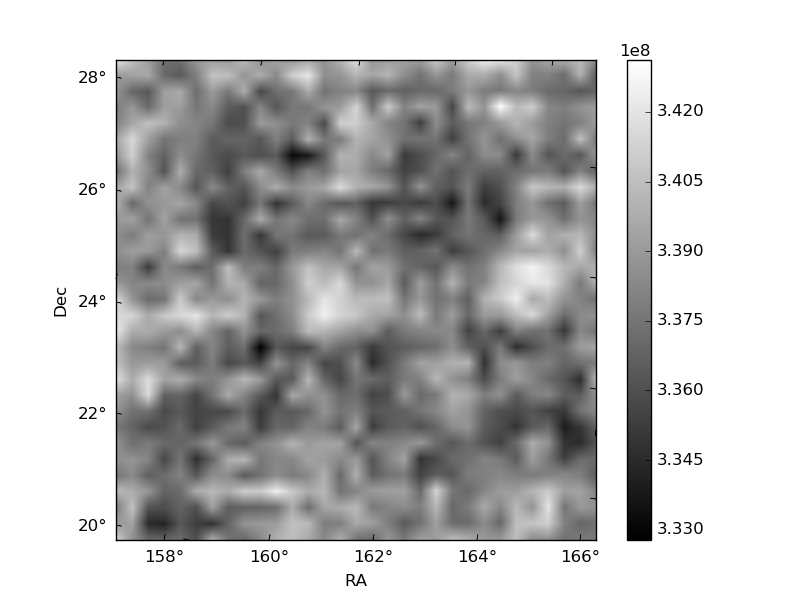
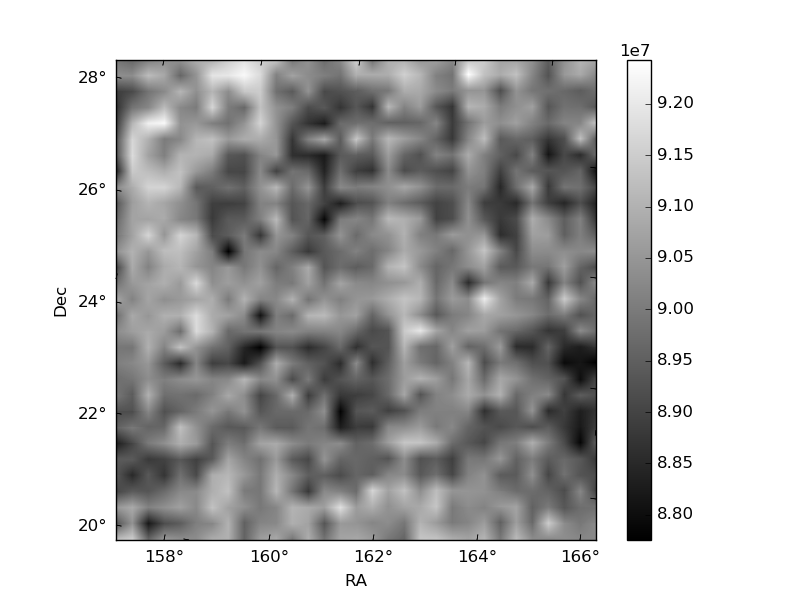
| Plot type | Count rate plots | Images |
|---|---|---|
| Comparison with Poisson distribution Blue bars denote a histogram of data divided into 1 sec bins. Red curve is a Poisson curve with rate = median count rate of data. |
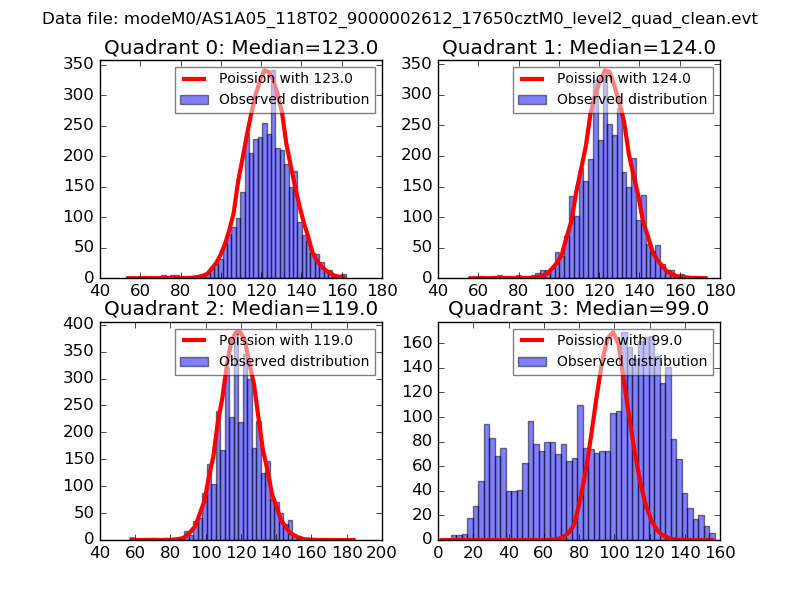 |
 |
| Quadrant-wise count rates Data is divided into 100 sec bins |
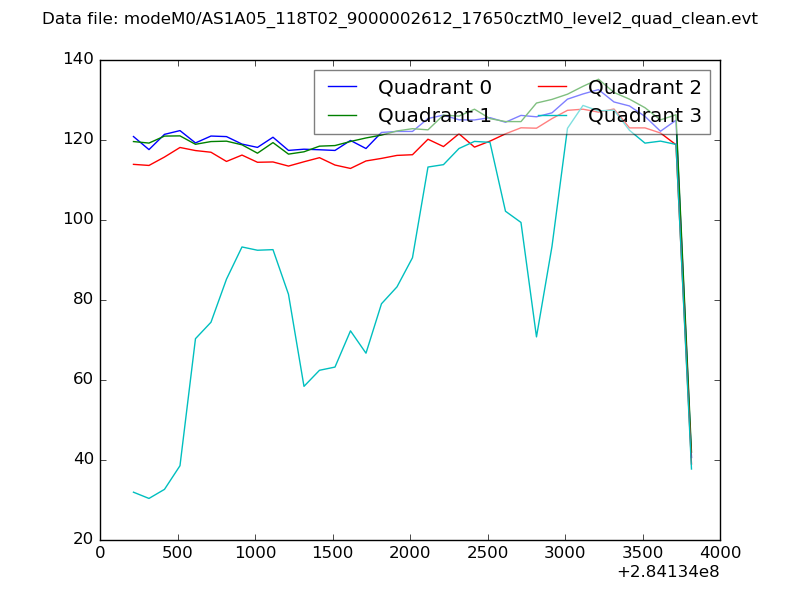 |
|
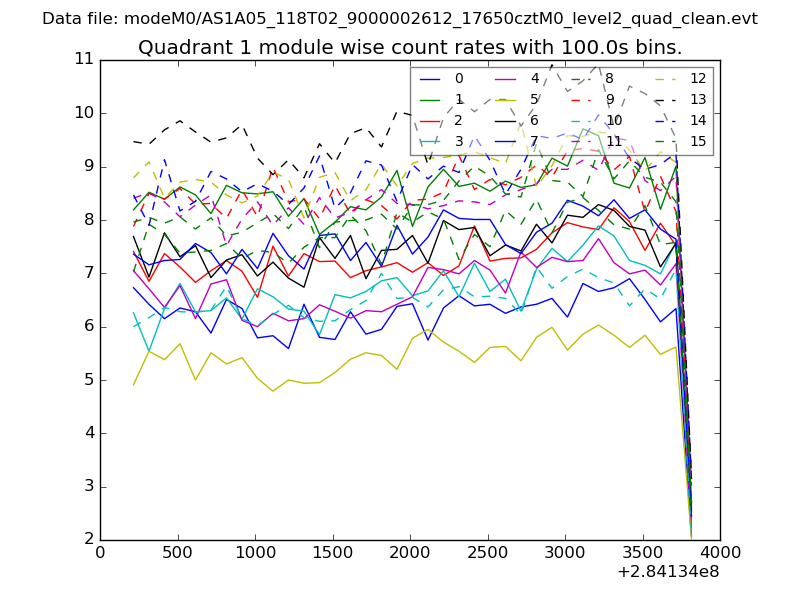
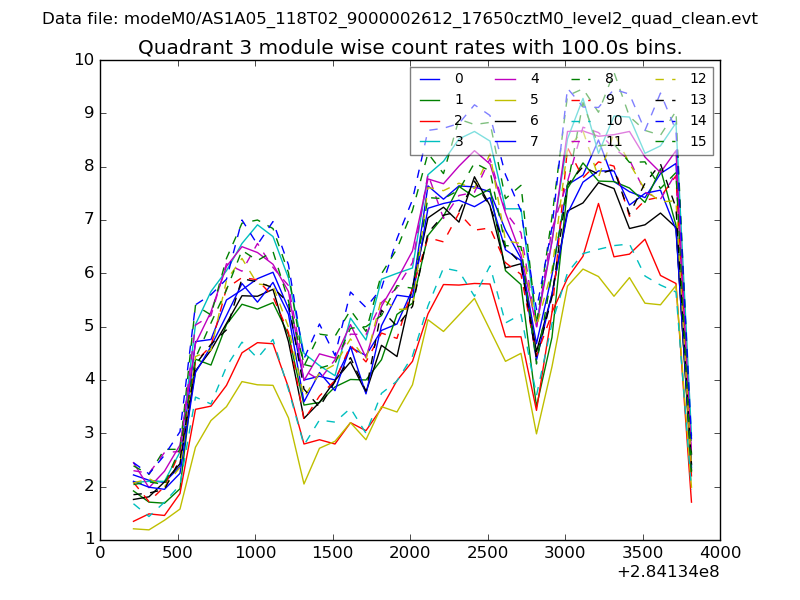
| Module-wise count rates for Quadrant A Data is divided into 100 sec bins |
 |
 |
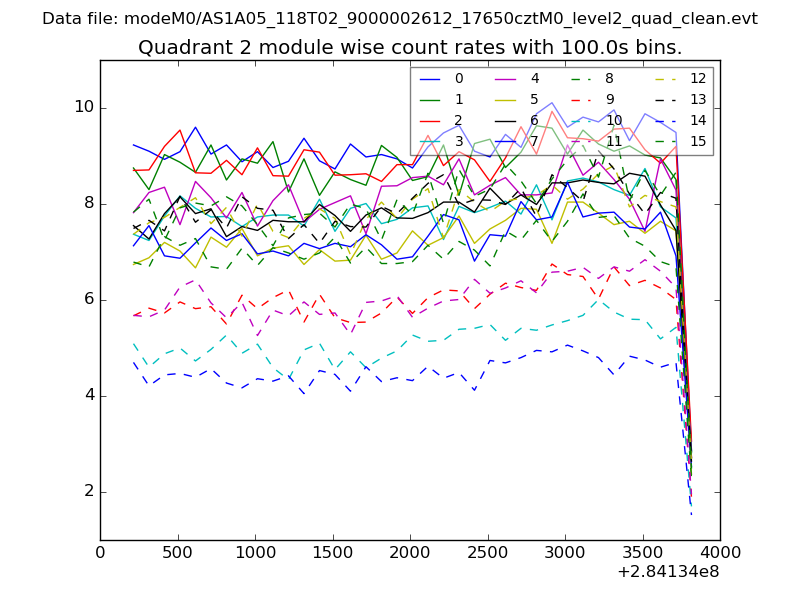
| Module-wise count rates for Quadrant B Data is divided into 100 sec bins |
 |
 |
| Module-wise count rates for Quadrant C Data is divided into 100 sec bins |
 |
 |
| Module-wise count rates for Quadrant D Data is divided into 100 sec bins |
 |
 |
| Parameter | Plot |
|---|---|
| CZT HV Monitor | 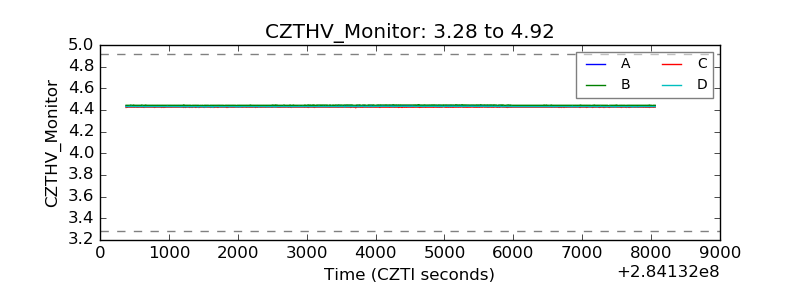 |
| D_VDD | 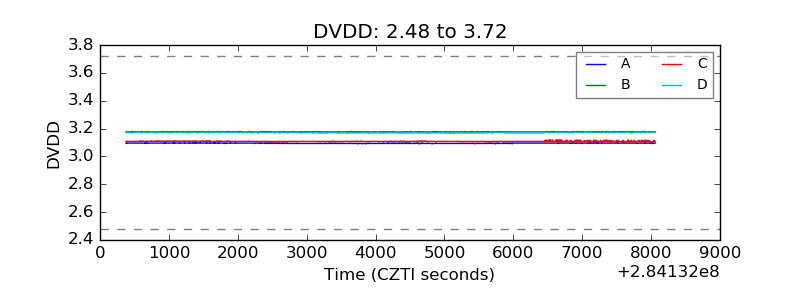 |
| Temperature 1 | 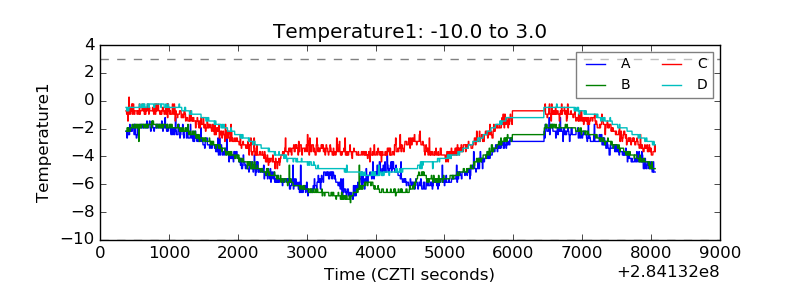 |
| Veto HV Monitor | 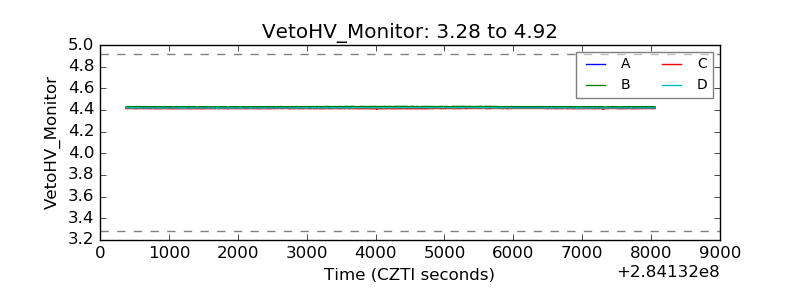 |
| Veto LLD | 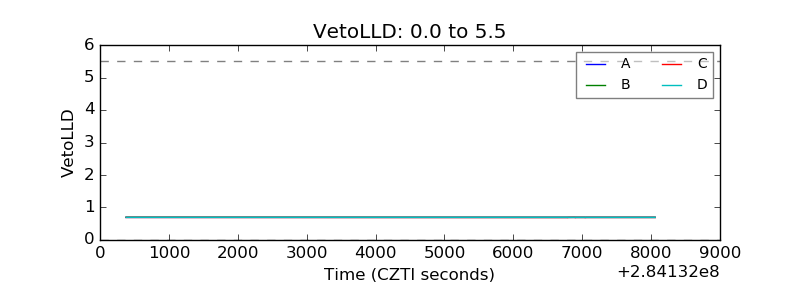 |
| Alpha Counter | 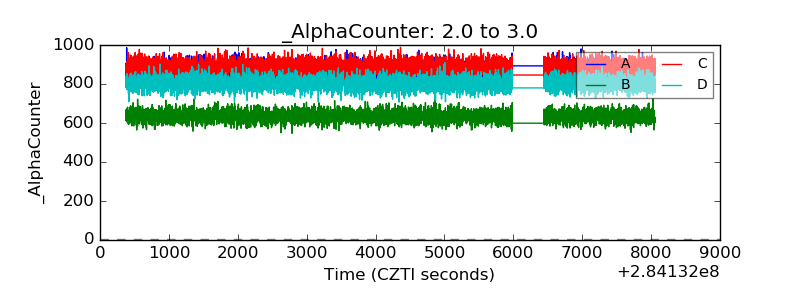 |
| _CPM_Rate | 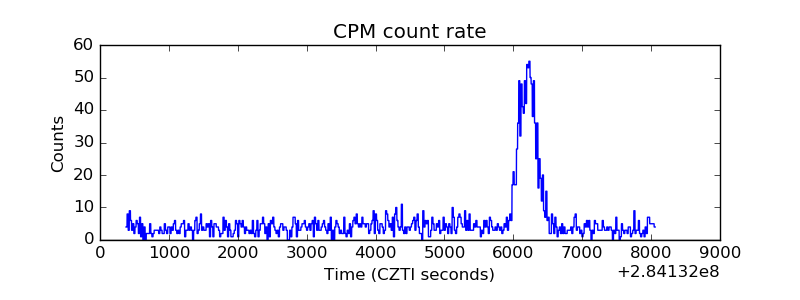 |
| CZT Counter | 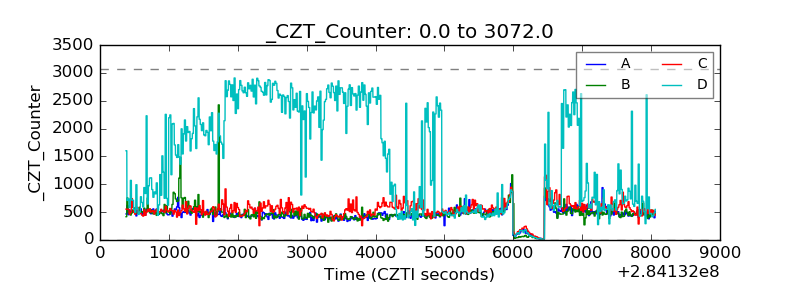 |
| +2.5 Volts monitor |  |
| +5 Volts monitor |  |
| _ROLL_ROT | 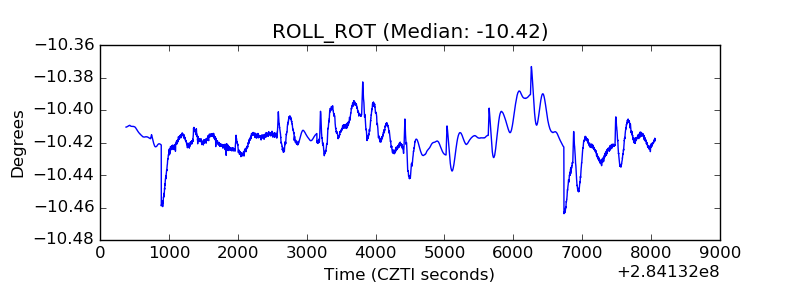 |
| _Roll_DEC | 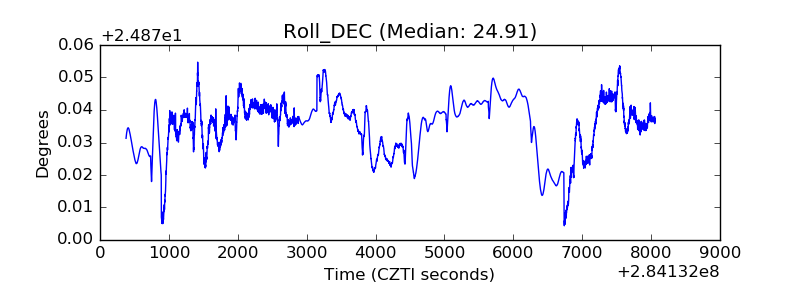 |
| _Roll_RA | 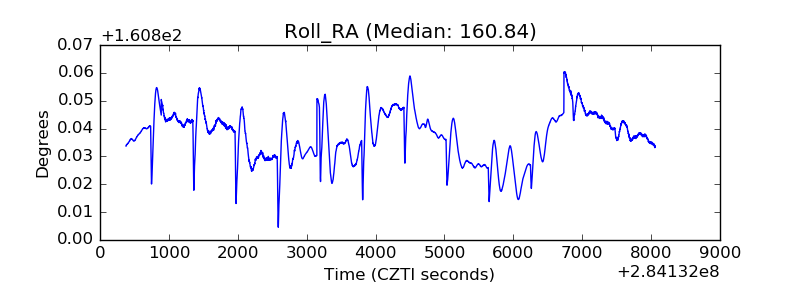 |
| Veto Counter | 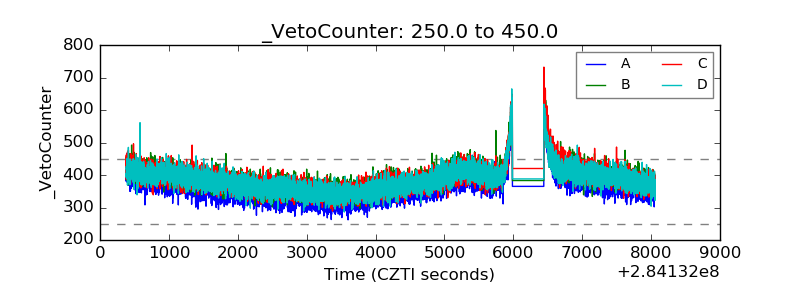 |