| Param | Original file | Final file |
|---|---|---|
| Filename | modeM0/AS1A05_118T02_9000002612_17652cztM0_level2.evt | modeM0/AS1A05_118T02_9000002612_17652cztM0_level2_quad_clean.evt |
| Size (bytes) | 520,395,840 | 72,887,040 |
| Size | 496.3 MB | 69.5 MB |
| Events in quadrant A | 3,247,101 | 443,253 |
| Events in quadrant B | 3,362,801 | 444,645 |
| Events in quadrant C | 3,535,132 | 429,108 |
| Events in quadrant D | 5,153,182 | 415,714 |
| Mode SS | |||
|---|---|---|---|
| Quadrant | BADHDUFLAG | Total packets | Discarded packets |
| A | 0 | 140 | 0 |
| B | 0 | 140 | 0 |
| C | 0 | 140 | 0 |
| D | 0 | 140 | 0 |
| Mode M0 | |||
|---|---|---|---|
| Quadrant | BADHDUFLAG | Total packets | Discarded packets |
| A | 0 | 14160 | 3 |
| B | 0 | 14385 | 2 |
| C | 0 | 14902 | 2 |
| D | 0 | 20094 | 2 |
| Mode M9 | |||
|---|---|---|---|
| Quadrant | BADHDUFLAG | Total packets | Discarded packets |
| A | 0 | 11 | 0 |
| B | 0 | 11 | 0 |
| C | 0 | 11 | 0 |
| D | 0 | 11 | 0 |
| Quadrant | Total seconds | Saturated seconds | Saturation percentage |
|---|---|---|---|
| A | 6805 | 78 | 1.146216% |
| B | 6806 | 99 | 1.454599% |
| C | 6806 | 153 | 2.248016% |
| D | 6806 | 599 | 8.801058% |
Noise dominated data is calculated using 1-second bins in cleaned event files. If a bin has >2000 counts, and if more than 50% of those come from <1% of pixels, then it is considered to be noise-dominated and hence unusable.
| Quadrant | # 1 sec bins | Bins with >0 counts | Bins with >2000 counts | High rate bins dominated by noise | Noise dominated (total time) | Noise dominated (detector-on time) | Marked lightcurve |
|---|---|---|---|---|---|---|---|
| A | 7846 | 6807 | 0 | 0 | 0.00% | 0.00% | 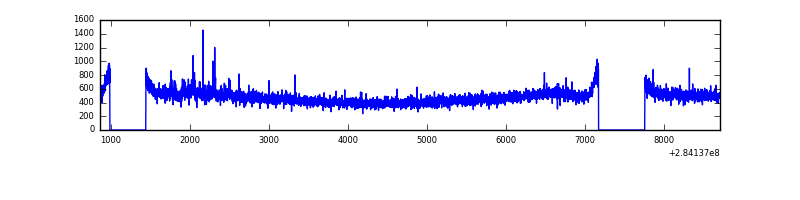 |
| B | 7847 | 6807 | 0 | 0 | 0.00% | 0.00% | 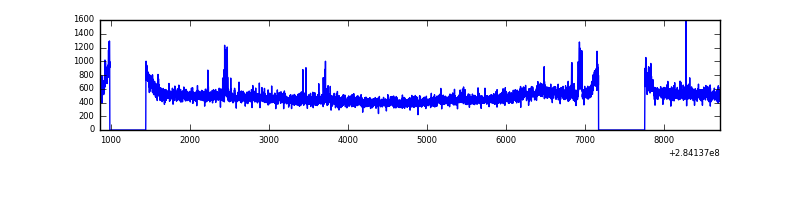 |
| C | 7847 | 6806 | 0 | 0 | 0.00% | 0.00% | 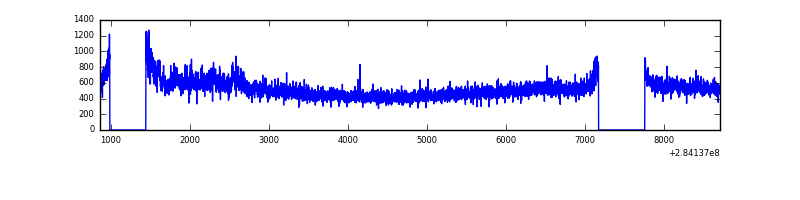 |
| D | 7847 | 6807 | 410 | 410 | 5.22% | 6.02% | 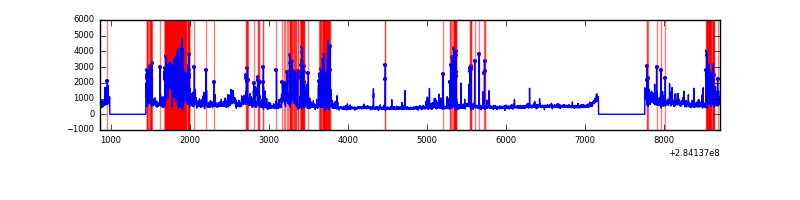 |
Top three noisy pixels from each quadrant. If the there are fewer than three noisy pixels in the level2.evt file, extra rows are filled as -1
| Pixel properties | Quadrant properties | ||||||
|---|---|---|---|---|---|---|---|
| Quadrant | DetID | PixID | Counts | Sigma | Mean | Median | Sigma |
| A | 14 | 237 | 50710 | 295.84 | 832 | 814 | 168.7 |
| A | 0 | 226 | 7203 | 37.88 | 832 | 814 | 168.7 |
| A | 3 | 137 | 6498 | 33.7 | 832 | 814 | 168.7 |
| B | 0 | 230 | 36388 | 220.46 | 826 | 805 | 161.4 |
| B | 0 | 189 | 31201 | 188.32 | 826 | 805 | 161.4 |
| B | 12 | 111 | 19073 | 113.18 | 826 | 805 | 161.4 |
| C | 3 | 233 | 295377 | 1573.62 | 794 | 798 | 187.2 |
| C | 14 | 238 | 121679 | 645.74 | 794 | 798 | 187.2 |
| C | 8 | 128 | 11406 | 56.67 | 794 | 798 | 187.2 |
| D | 1 | 52 | 1831369 | 9538.99 | 777 | 751 | 191.9 |
| D | 13 | 189 | 293425 | 1525.07 | 777 | 751 | 191.9 |
| D | 12 | 233 | 44567 | 228.32 | 777 | 751 | 191.9 |
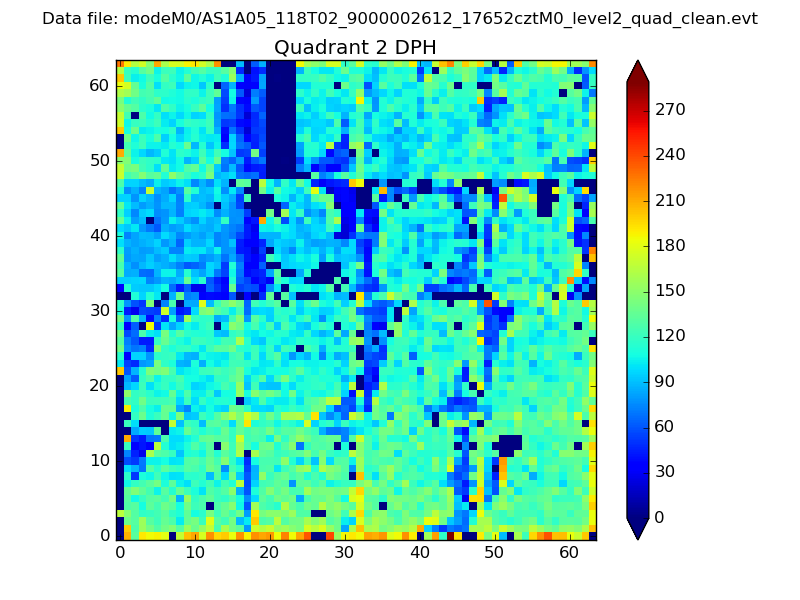
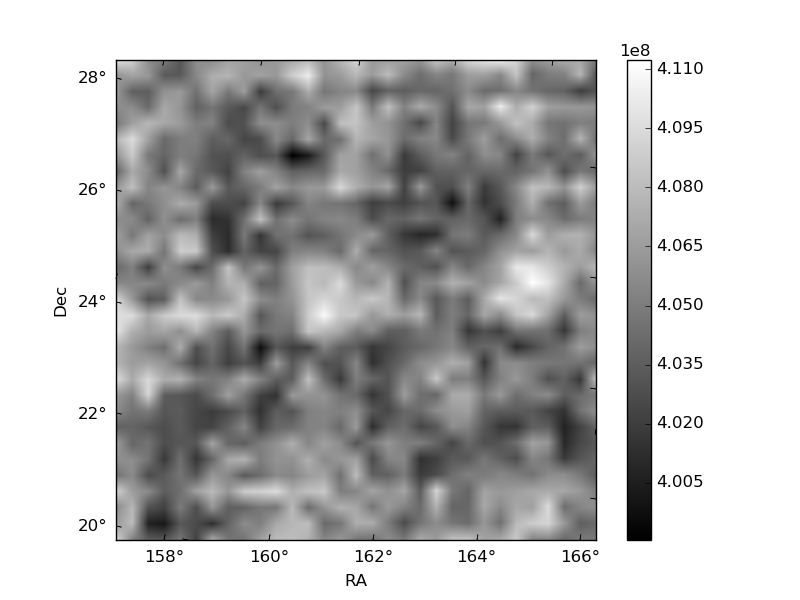
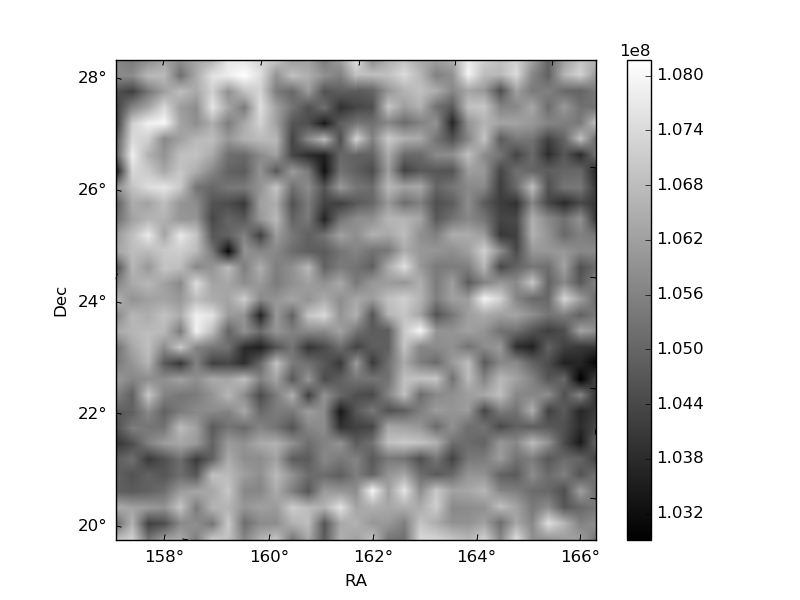
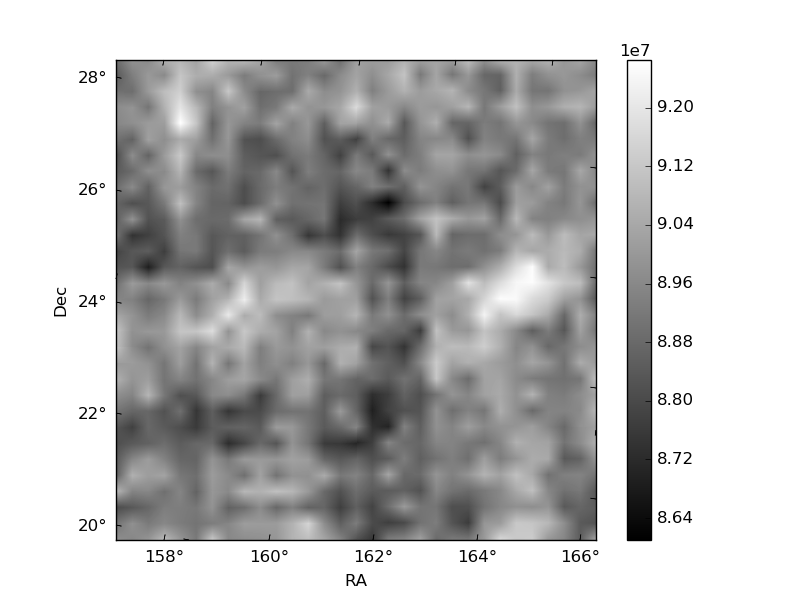
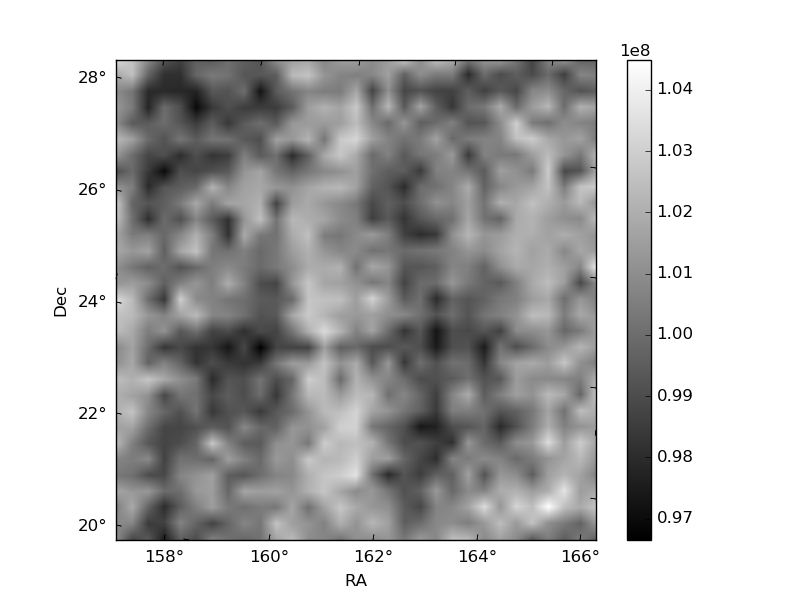
Histogram calculated using DETX and DETY for each event in the final _common_clean file
| Quadrant A | 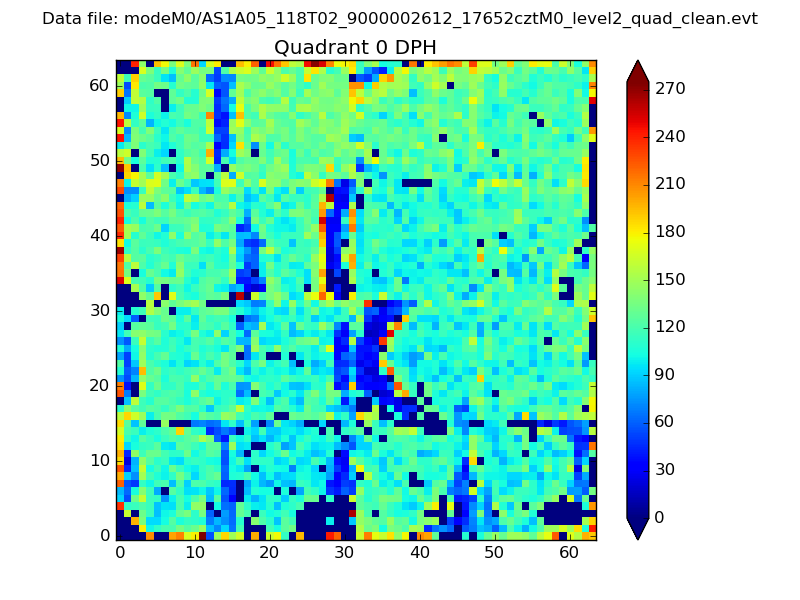 |
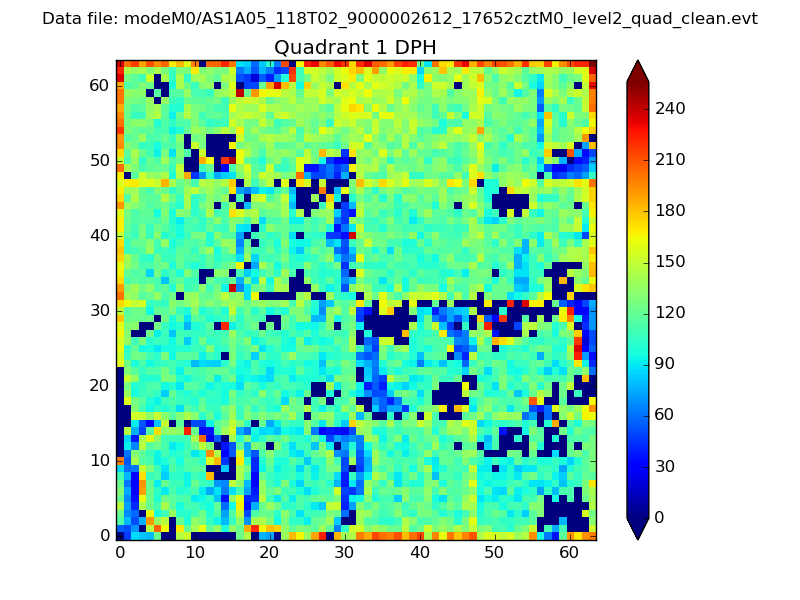 |
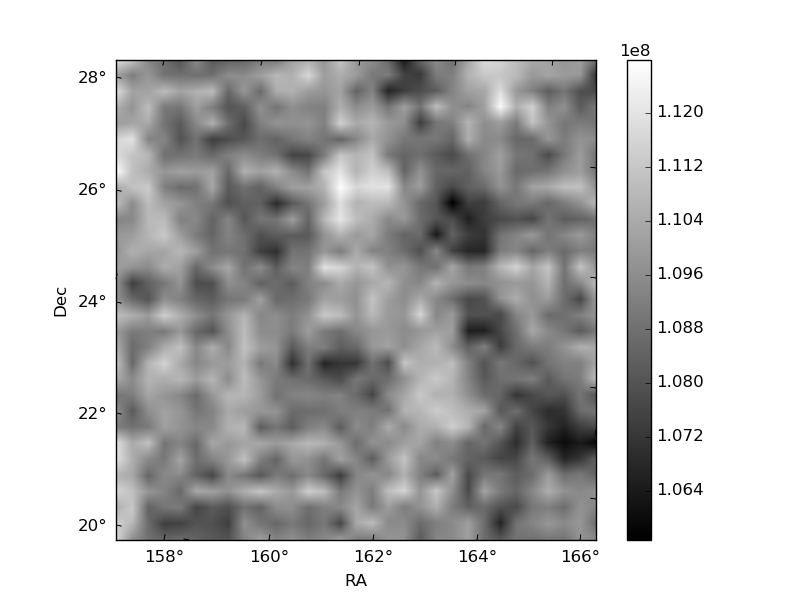
Quadrant B |
|---|---|---|---|
| Quadrant D | 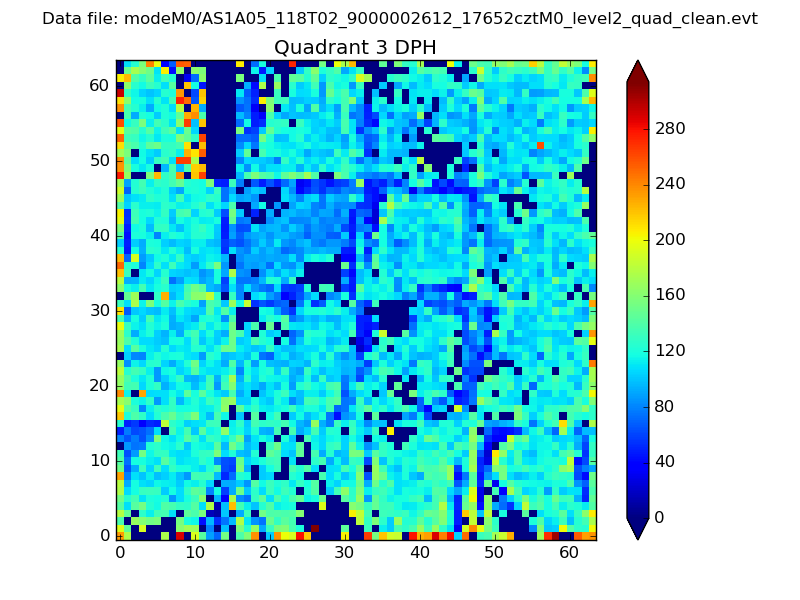 |
 |
Quadrant C |
| Plot type | Count rate plots | Images |
|---|---|---|
| Comparison with Poisson distribution Blue bars denote a histogram of data divided into 1 sec bins. Red curve is a Poisson curve with rate = median count rate of data. |
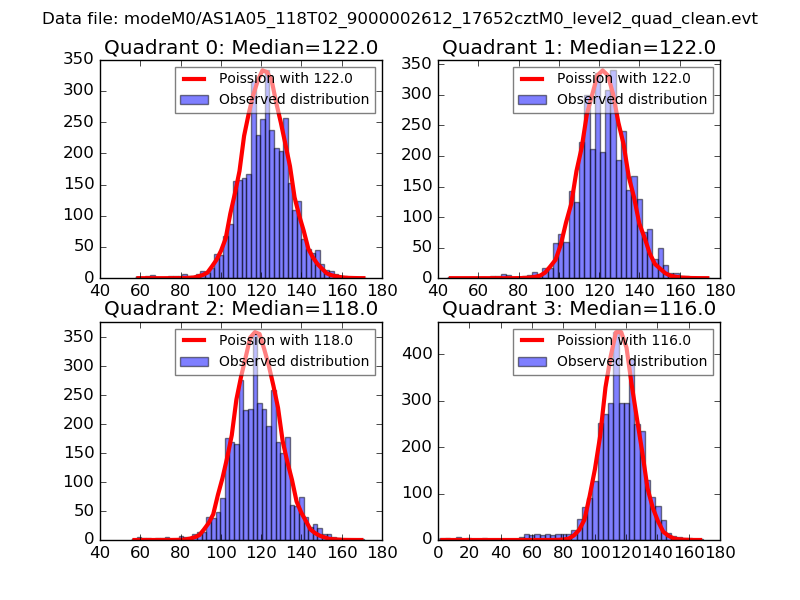 |
 |
| Quadrant-wise count rates Data is divided into 100 sec bins |
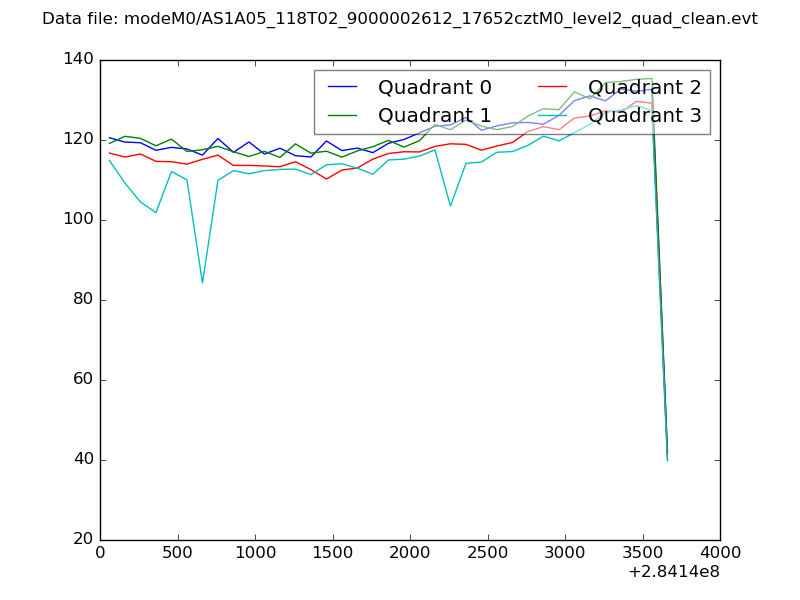 |
|
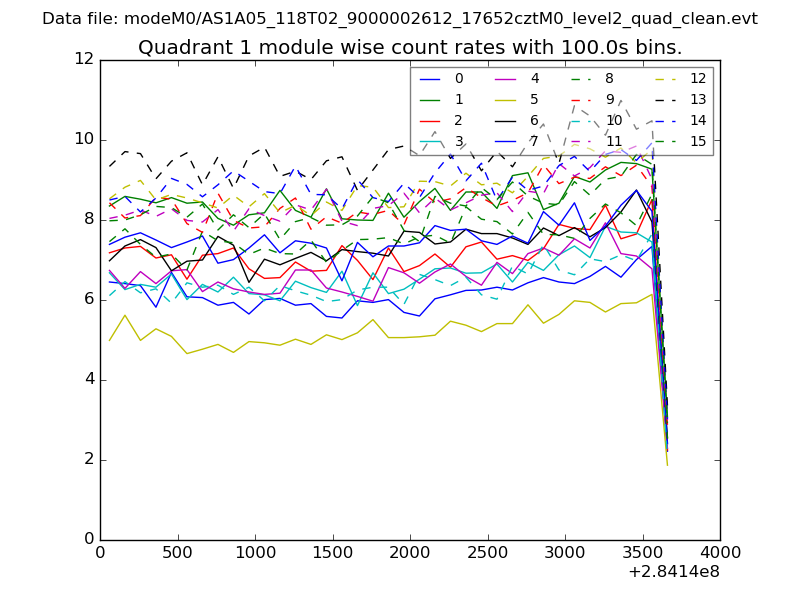
| Module-wise count rates for Quadrant A Data is divided into 100 sec bins |
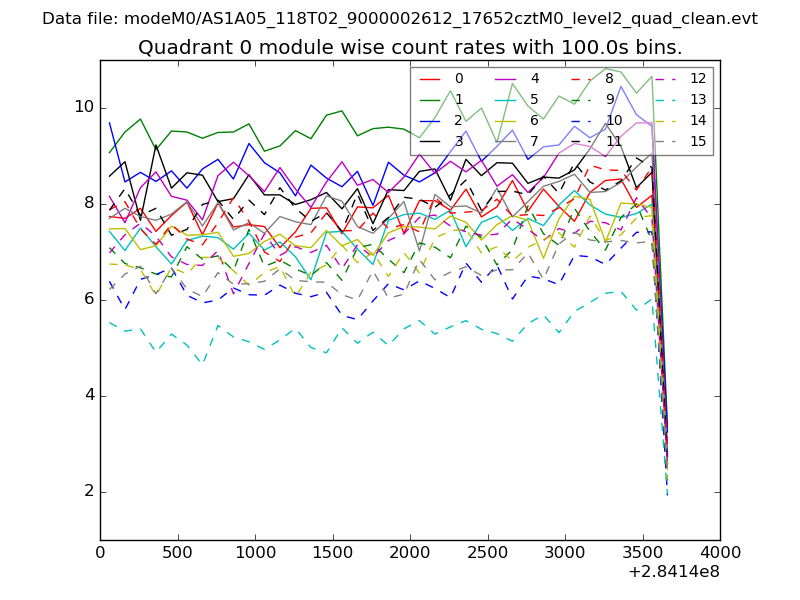 |
 |
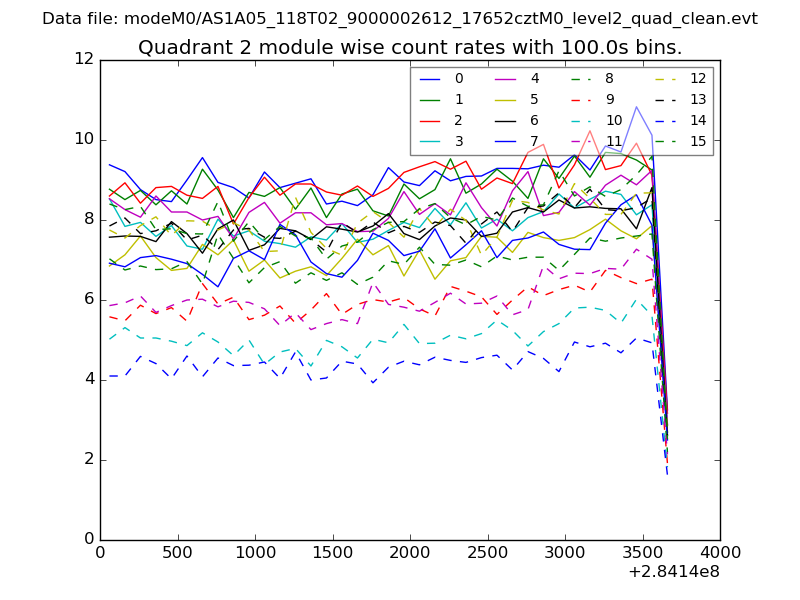
| Module-wise count rates for Quadrant B Data is divided into 100 sec bins |
 |
 |
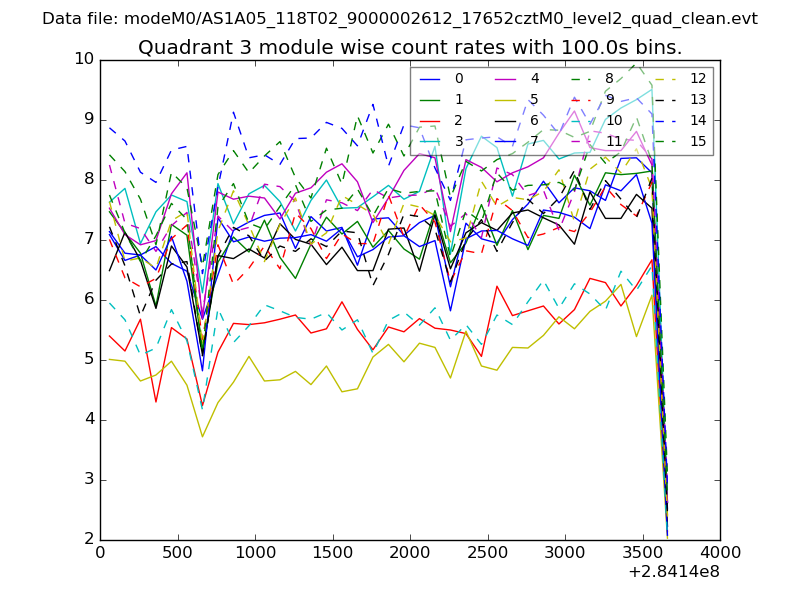
| Module-wise count rates for Quadrant C Data is divided into 100 sec bins |
 |
 |
| Module-wise count rates for Quadrant D Data is divided into 100 sec bins |
 |
 |
| Parameter | Plot |
|---|---|
| CZT HV Monitor | 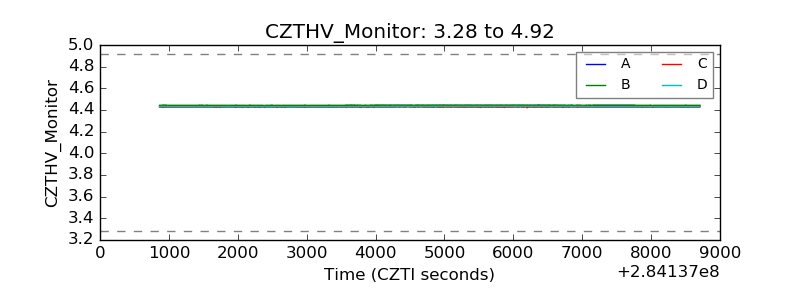 |
| D_VDD | 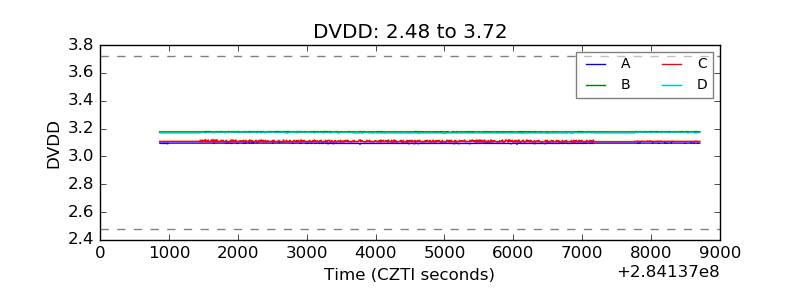 |
| Temperature 1 | 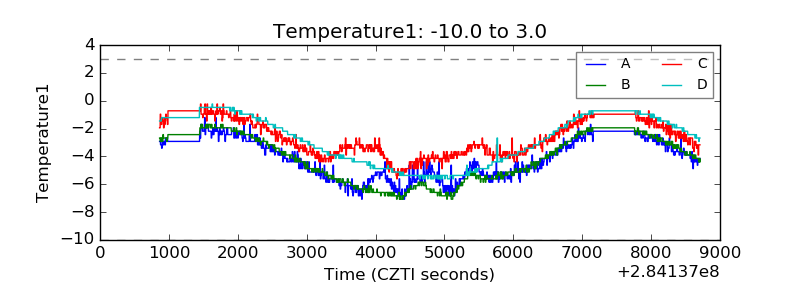 |
| Veto HV Monitor | 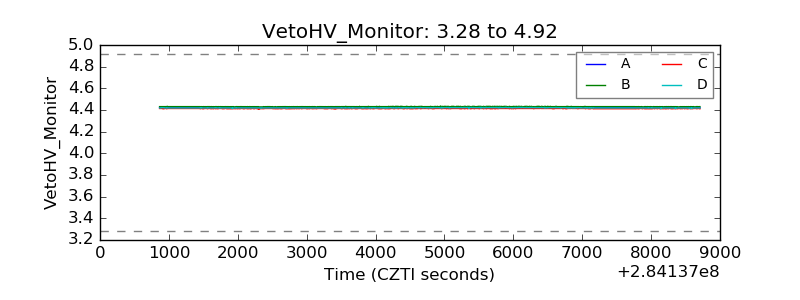 |
| Veto LLD | 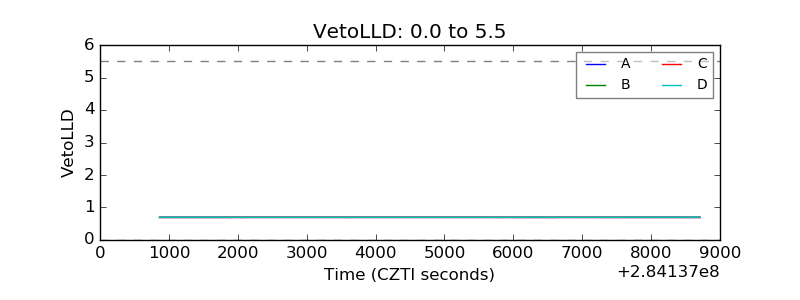 |
| Alpha Counter | 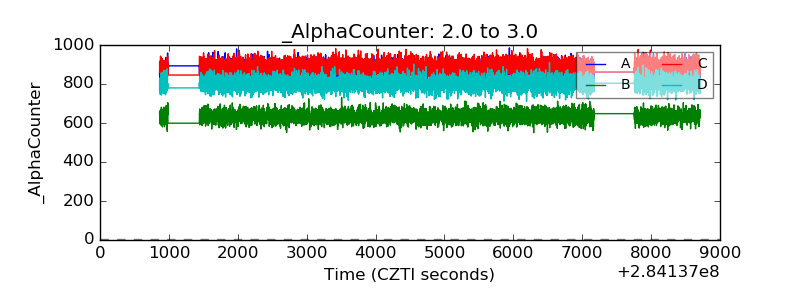 |
| _CPM_Rate | 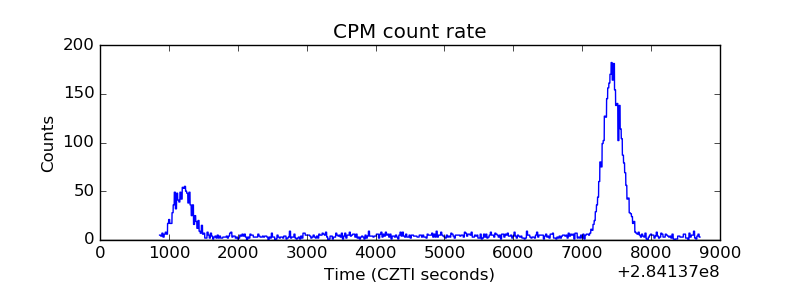 |
| CZT Counter | 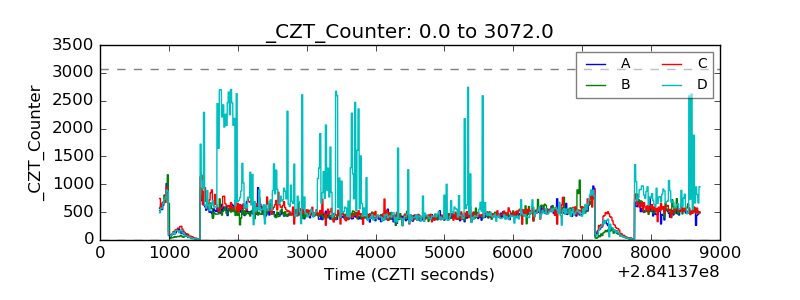 |
| +2.5 Volts monitor |  |
| +5 Volts monitor |  |
| _ROLL_ROT | 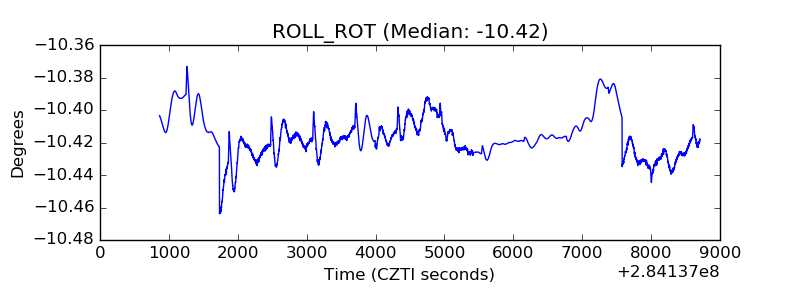 |
| _Roll_DEC | 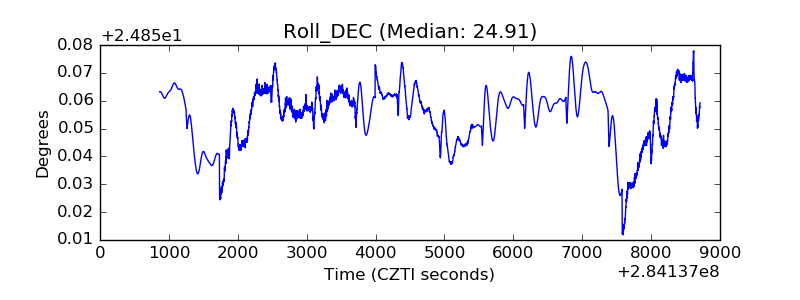 |
| _Roll_RA | 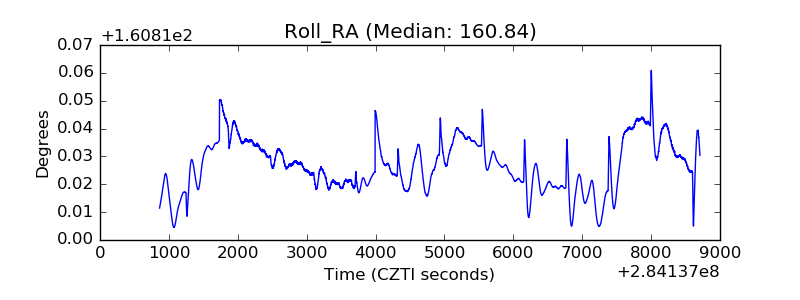 |
| Veto Counter | 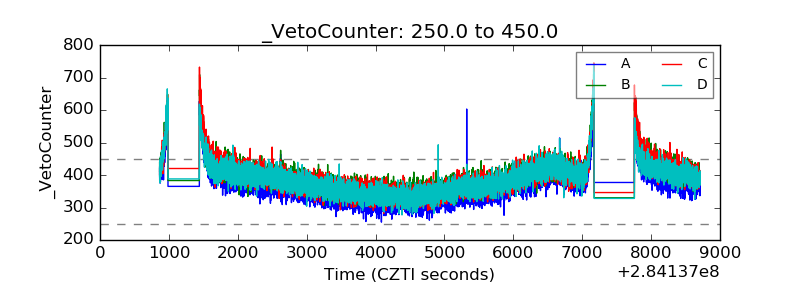 |