| Param | Original file | Final file |
|---|---|---|
| Filename | modeM0/AS1A05_118T02_9000002612_17653cztM0_level2.evt | modeM0/AS1A05_118T02_9000002612_17653cztM0_level2_quad_clean.evt |
| Size (bytes) | 836,081,280 | 161,608,320 |
| Size | 797.3 MB | 154.1 MB |
| Events in quadrant A | 5,675,491 | 1,026,100 |
| Events in quadrant B | 5,910,606 | 1,035,386 |
| Events in quadrant C | 6,053,491 | 1,000,002 |
| Events in quadrant D | 6,845,428 | 979,948 |
| Mode SS | |||
|---|---|---|---|
| Quadrant | BADHDUFLAG | Total packets | Discarded packets |
| A | 0 | 254 | 0 |
| B | 0 | 254 | 0 |
| C | 0 | 254 | 0 |
| D | 0 | 254 | 0 |
| Mode M0 | |||
|---|---|---|---|
| Quadrant | BADHDUFLAG | Total packets | Discarded packets |
| A | 0 | 25188 | 3 |
| B | 0 | 25691 | 3 |
| C | 0 | 25639 | 3 |
| D | 0 | 28988 | 3 |
| Mode M9 | |||
|---|---|---|---|
| Quadrant | BADHDUFLAG | Total packets | Discarded packets |
| A | 0 | 16 | 0 |
| B | 0 | 16 | 0 |
| C | 0 | 16 | 0 |
| D | 0 | 16 | 0 |
| Quadrant | Total seconds | Saturated seconds | Saturation percentage |
|---|---|---|---|
| A | 12330 | 47 | 0.381184% |
| B | 12330 | 64 | 0.519059% |
| C | 12331 | 104 | 0.843403% |
| D | 12331 | 218 | 1.767902% |
Noise dominated data is calculated using 1-second bins in cleaned event files. If a bin has >2000 counts, and if more than 50% of those come from <1% of pixels, then it is considered to be noise-dominated and hence unusable.
| Quadrant | # 1 sec bins | Bins with >0 counts | Bins with >2000 counts | High rate bins dominated by noise | Noise dominated (total time) | Noise dominated (detector-on time) | Marked lightcurve |
|---|---|---|---|---|---|---|---|
| A | 14025 | 12332 | 0 | 0 | 0.00% | 0.00% | 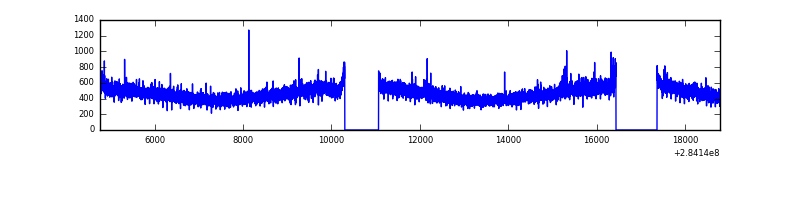 |
| B | 14025 | 12332 | 1 | 1 | 0.01% | 0.01% | 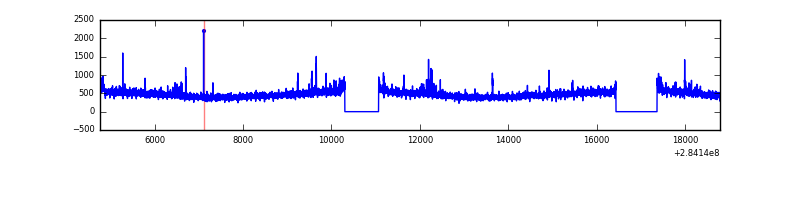 |
| C | 14026 | 12333 | 0 | 0 | 0.00% | 0.00% | 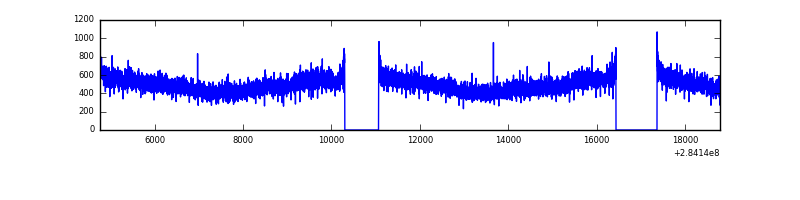 |
| D | 14026 | 12332 | 124 | 124 | 0.88% | 1.01% | 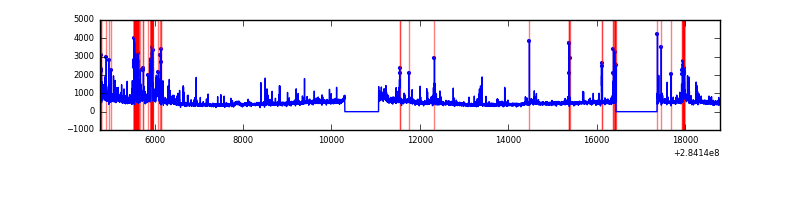 |
Top three noisy pixels from each quadrant. If the there are fewer than three noisy pixels in the level2.evt file, extra rows are filled as -1
| Pixel properties | Quadrant properties | ||||||
|---|---|---|---|---|---|---|---|
| Quadrant | DetID | PixID | Counts | Sigma | Mean | Median | Sigma |
| A | 14 | 237 | 40976 | 132.92 | 1466 | 1436 | 297.5 |
| A | 0 | 226 | 12743 | 38.01 | 1466 | 1436 | 297.5 |
| A | 3 | 137 | 11315 | 33.21 | 1466 | 1436 | 297.5 |
| B | 0 | 189 | 44956 | 155.61 | 1463 | 1426 | 279.7 |
| B | 4 | 80 | 43106 | 149.0 | 1463 | 1426 | 279.7 |
| B | 12 | 111 | 34183 | 117.1 | 1463 | 1426 | 279.7 |
| C | 3 | 233 | 345970 | 1047.83 | 1407 | 1415 | 328.8 |
| C | 14 | 238 | 215128 | 649.92 | 1407 | 1415 | 328.8 |
| C | 5 | 218 | 10355 | 27.19 | 1407 | 1415 | 328.8 |
| D | 1 | 52 | 909495 | 2626.21 | 1416 | 1375 | 345.8 |
| D | 13 | 189 | 503725 | 1452.76 | 1416 | 1375 | 345.8 |
| D | 2 | 234 | 48304 | 135.72 | 1416 | 1375 | 345.8 |
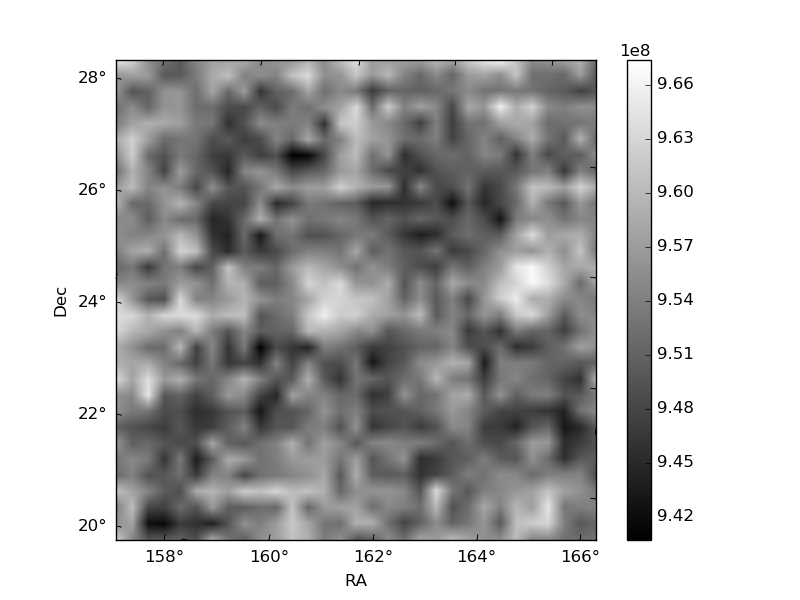
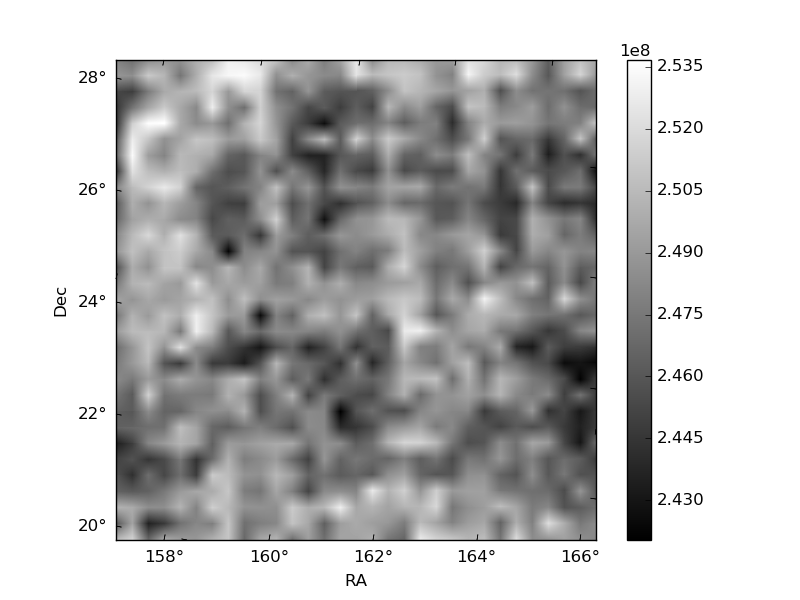
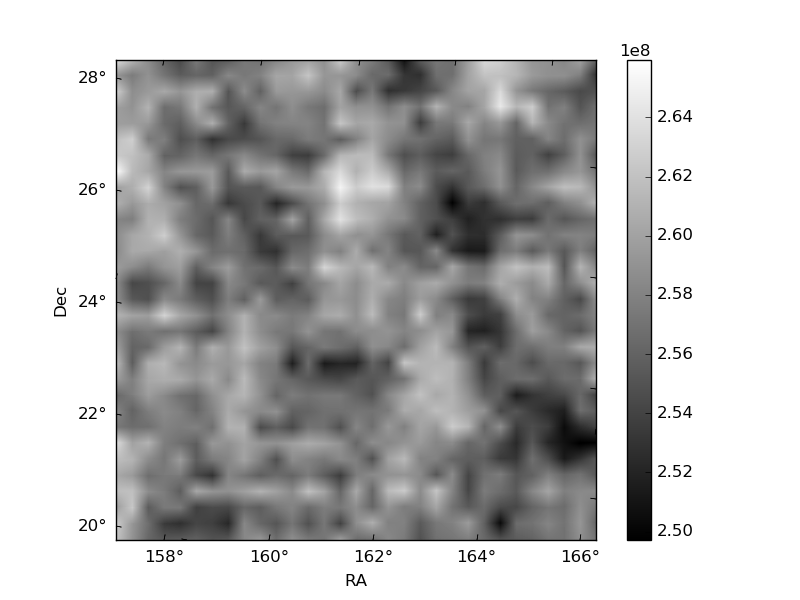
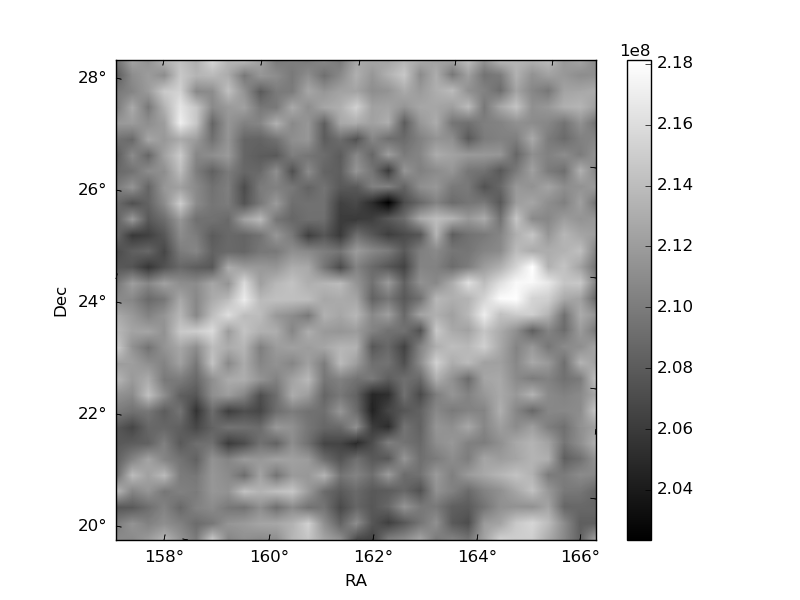
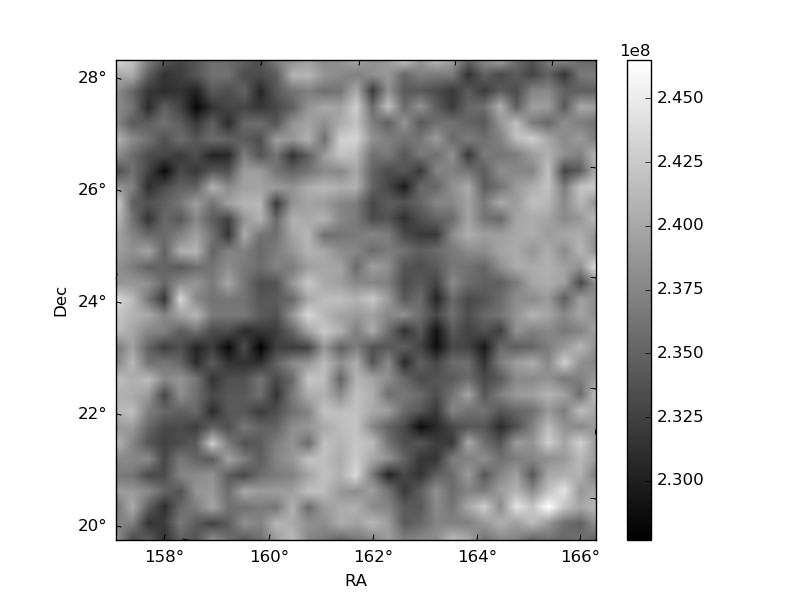
Histogram calculated using DETX and DETY for each event in the final _common_clean file
| Quadrant A | 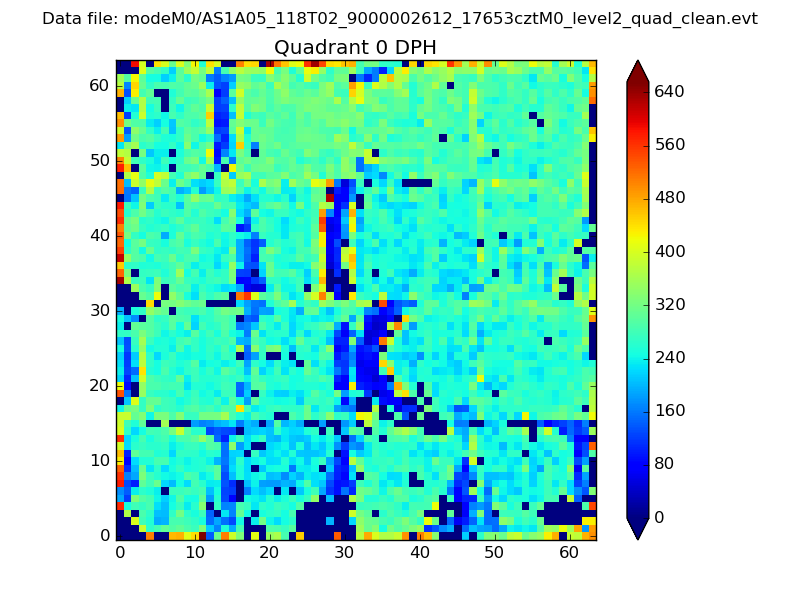 |
 |
Quadrant B |
|---|---|---|---|
| Quadrant D | 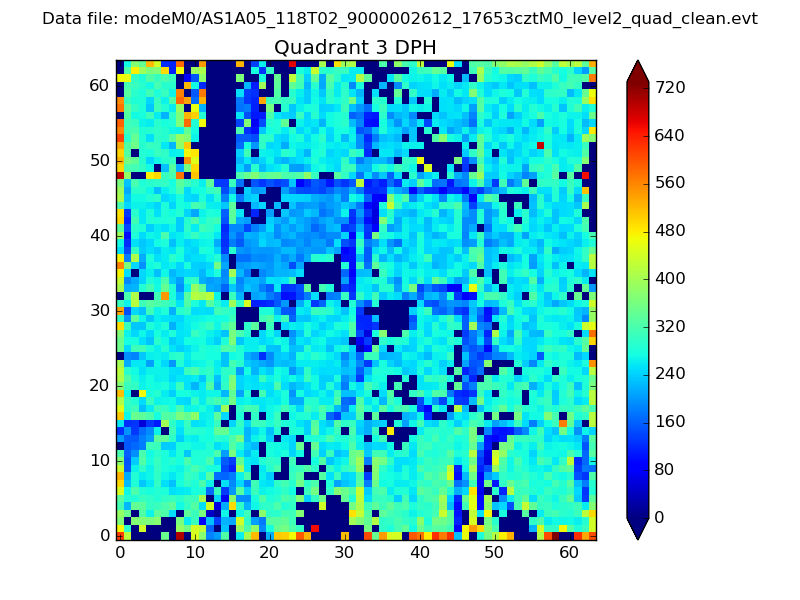 |
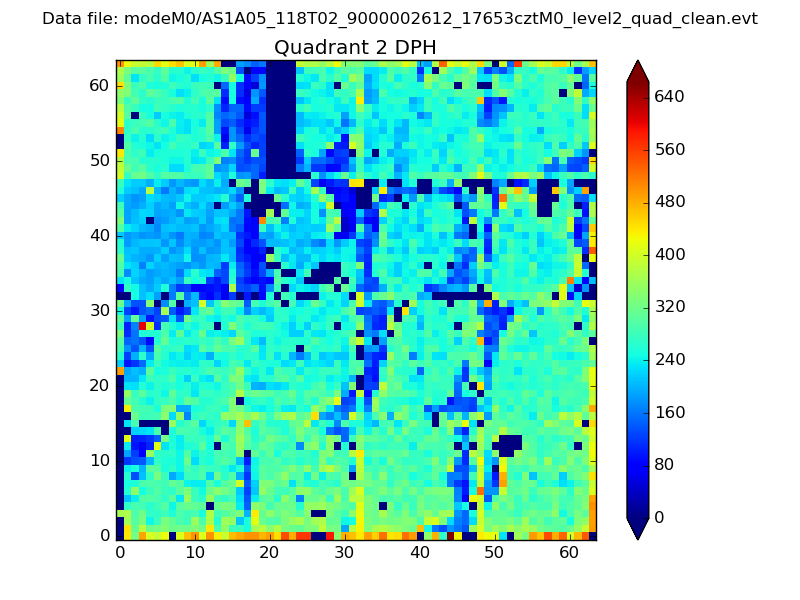 |
Quadrant C |
| Plot type | Count rate plots | Images |
|---|---|---|
| Comparison with Poisson distribution Blue bars denote a histogram of data divided into 1 sec bins. Red curve is a Poisson curve with rate = median count rate of data. |
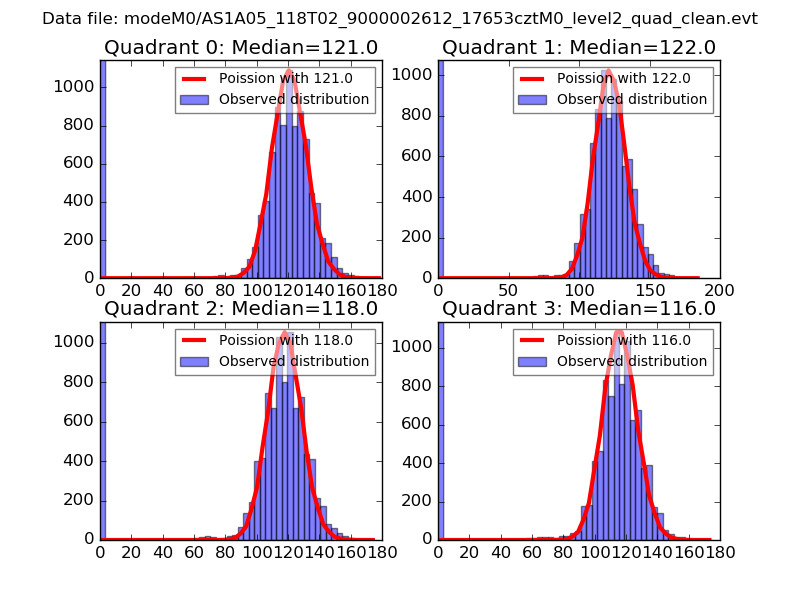 |
 |
| Quadrant-wise count rates Data is divided into 100 sec bins |
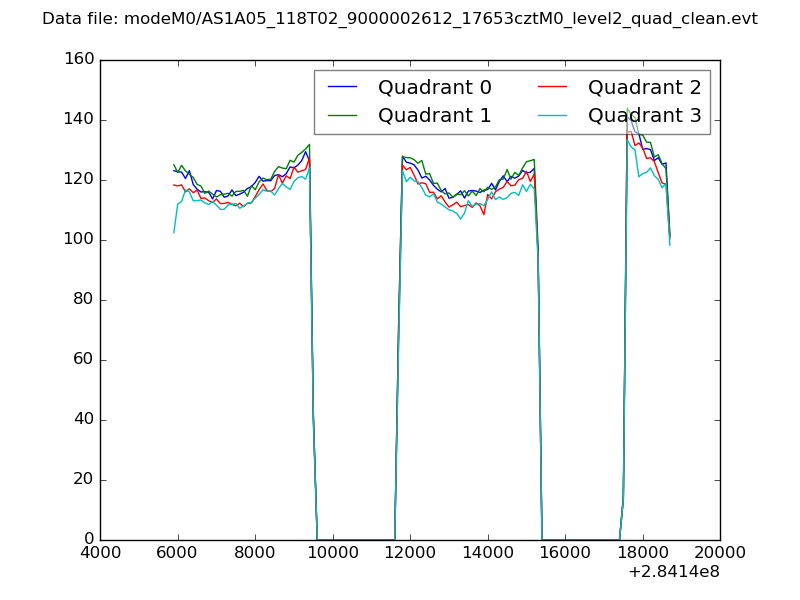 |
|
| Module-wise count rates for Quadrant A Data is divided into 100 sec bins |
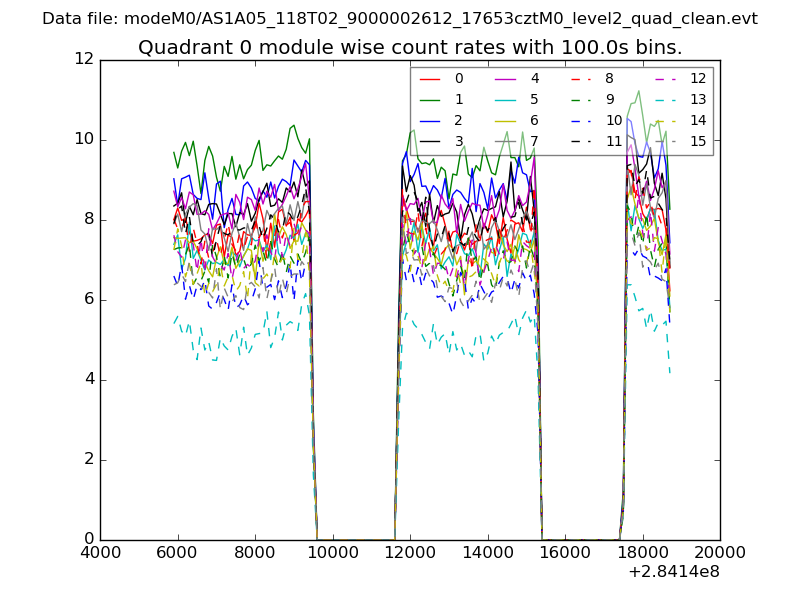 |
 |
| Module-wise count rates for Quadrant B Data is divided into 100 sec bins |
 |
 |
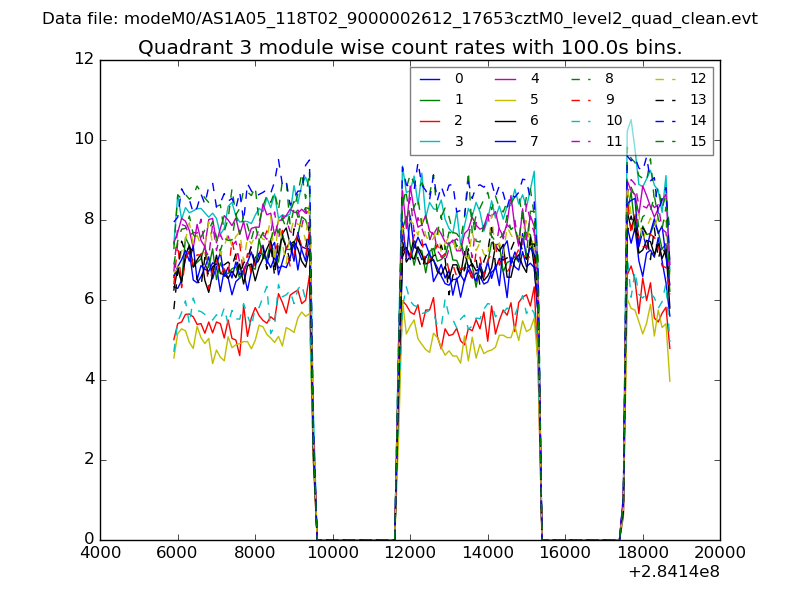
| Module-wise count rates for Quadrant C Data is divided into 100 sec bins |
 |
 |
| Module-wise count rates for Quadrant D Data is divided into 100 sec bins |
 |
 |
| Parameter | Plot |
|---|---|
| CZT HV Monitor | 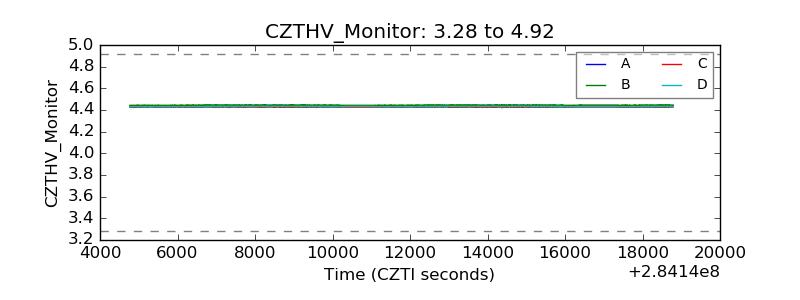 |
| D_VDD | 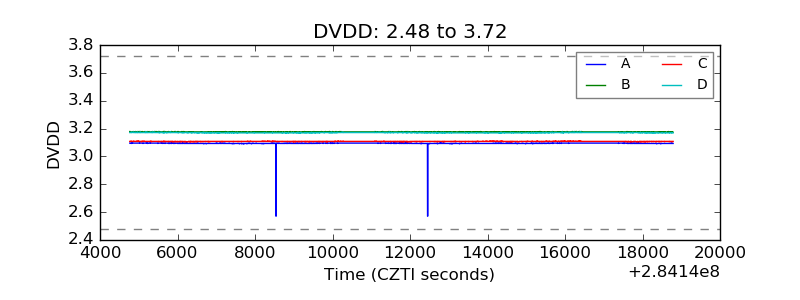 |
| Temperature 1 |  |
| Veto HV Monitor | 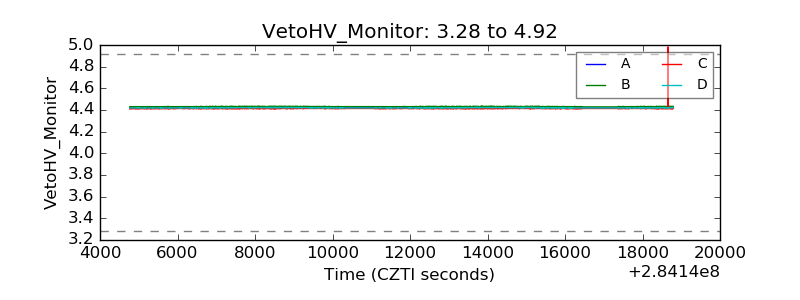 |
| Veto LLD | 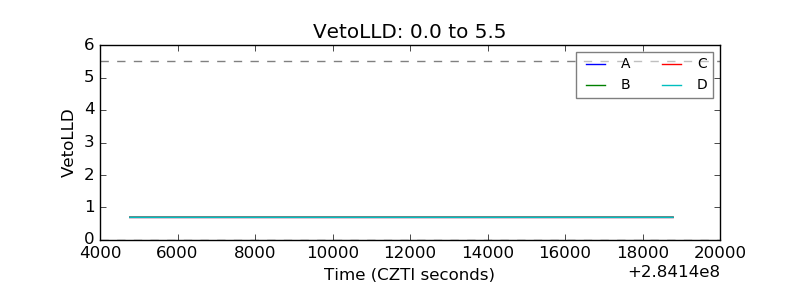 |
| Alpha Counter |  |
| _CPM_Rate | 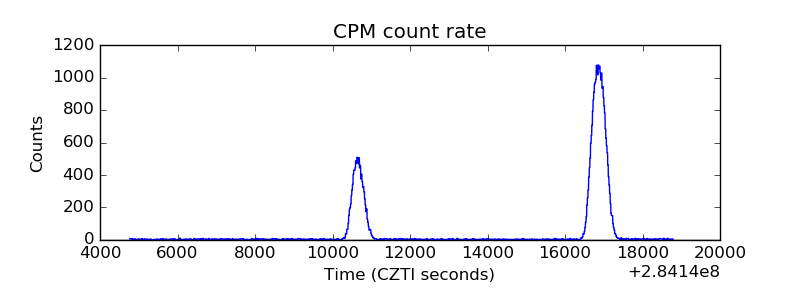 |
| CZT Counter | 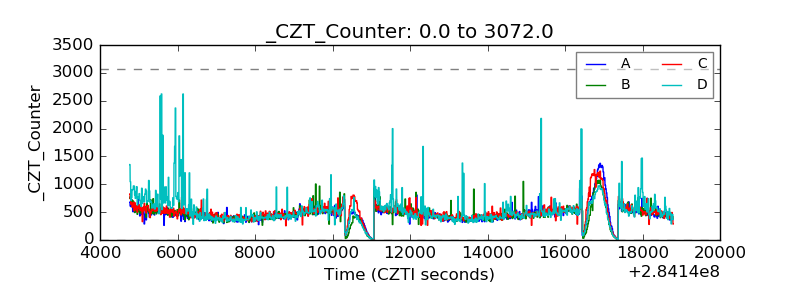 |
| +2.5 Volts monitor |  |
| +5 Volts monitor |  |
| _ROLL_ROT | 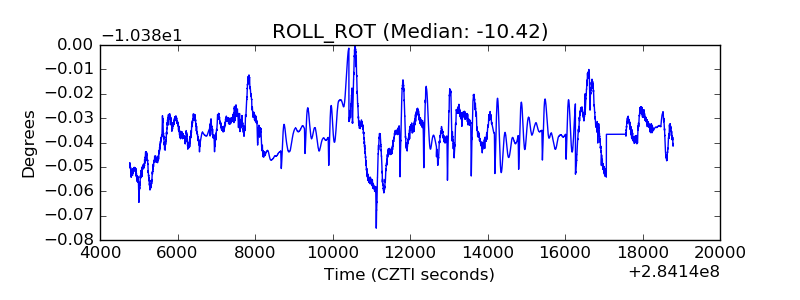 |
| _Roll_DEC | 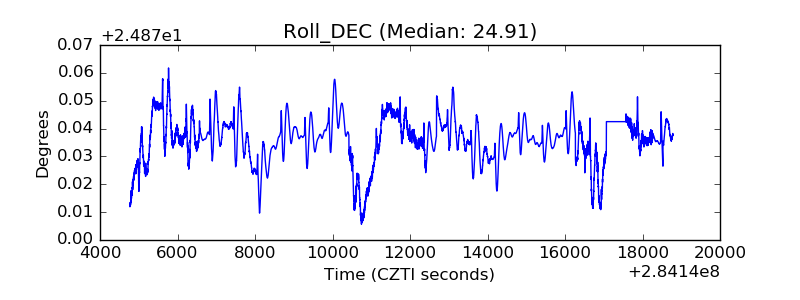 |
| _Roll_RA | 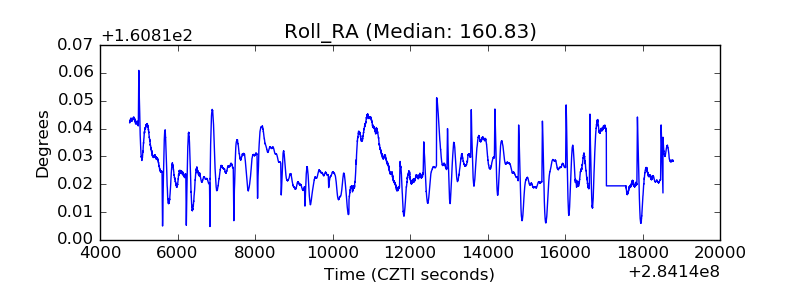 |
| Veto Counter | 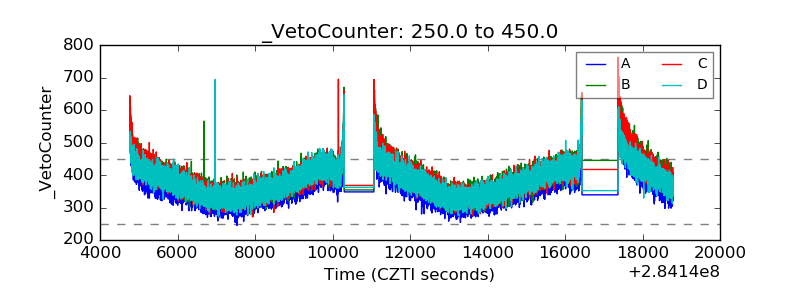 |