| Param | Original file | Final file |
|---|---|---|
| Filename | modeM0/AS1A05_118T02_9000002612_17654cztM0_level2.evt | modeM0/AS1A05_118T02_9000002612_17654cztM0_level2_quad_clean.evt |
| Size (bytes) | 459,524,160 | 97,669,440 |
| Size | 438.2 MB | 93.1 MB |
| Events in quadrant A | 3,058,513 | 638,131 |
| Events in quadrant B | 3,225,738 | 647,775 |
| Events in quadrant C | 3,334,617 | 619,792 |
| Events in quadrant D | 3,851,711 | 594,392 |
| Mode SS | |||
|---|---|---|---|
| Quadrant | BADHDUFLAG | Total packets | Discarded packets |
| A | 0 | 132 | 0 |
| B | 0 | 132 | 0 |
| C | 0 | 132 | 0 |
| D | 0 | 132 | 0 |
| Mode M0 | |||
|---|---|---|---|
| Quadrant | BADHDUFLAG | Total packets | Discarded packets |
| A | 0 | 13486 | 2 |
| B | 0 | 13982 | 2 |
| C | 0 | 14093 | 2 |
| D | 0 | 15919 | 2 |
| Mode M9 | |||
|---|---|---|---|
| Quadrant | BADHDUFLAG | Total packets | Discarded packets |
| A | 0 | 14 | 0 |
| B | 0 | 15 | 0 |
| C | 0 | 15 | 0 |
| D | 0 | 15 | 0 |
| Quadrant | Total seconds | Saturated seconds | Saturation percentage |
|---|---|---|---|
| A | 6569 | 24 | 0.365352% |
| B | 6569 | 50 | 0.761151% |
| C | 6569 | 64 | 0.974273% |
| D | 6569 | 180 | 2.740143% |
Noise dominated data is calculated using 1-second bins in cleaned event files. If a bin has >2000 counts, and if more than 50% of those come from <1% of pixels, then it is considered to be noise-dominated and hence unusable.
| Quadrant | # 1 sec bins | Bins with >0 counts | Bins with >2000 counts | High rate bins dominated by noise | Noise dominated (total time) | Noise dominated (detector-on time) | Marked lightcurve |
|---|---|---|---|---|---|---|---|
| A | 7614 | 6570 | 0 | 0 | 0.00% | 0.00% | 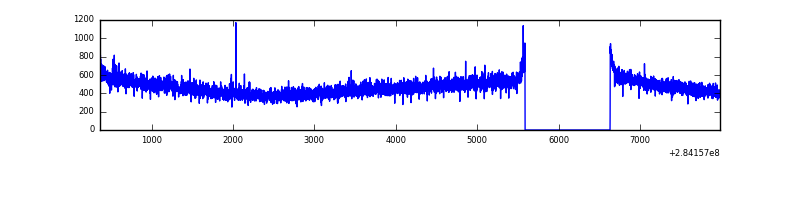 |
| B | 7614 | 6570 | 0 | 0 | 0.00% | 0.00% | 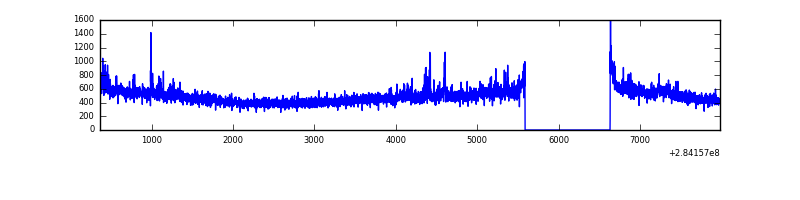 |
| C | 7614 | 6570 | 0 | 0 | 0.00% | 0.00% | 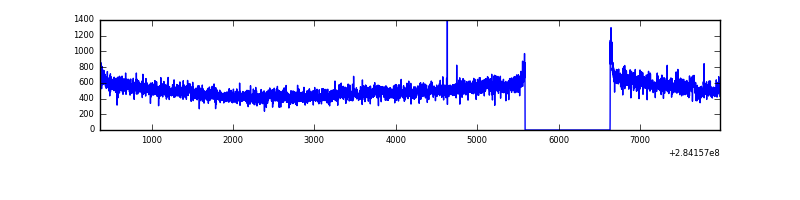 |
| D | 7614 | 6570 | 149 | 149 | 1.96% | 2.27% |  |
Top three noisy pixels from each quadrant. If the there are fewer than three noisy pixels in the level2.evt file, extra rows are filled as -1
| Pixel properties | Quadrant properties | ||||||
|---|---|---|---|---|---|---|---|
| Quadrant | DetID | PixID | Counts | Sigma | Mean | Median | Sigma |
| A | 14 | 237 | 16009 | 94.49 | 791 | 774 | 161.2 |
| A | 0 | 226 | 6877 | 37.85 | 791 | 774 | 161.2 |
| A | 3 | 137 | 5958 | 32.15 | 791 | 774 | 161.2 |
| B | 0 | 230 | 33336 | 214.13 | 795 | 777 | 152.1 |
| B | 10 | 245 | 22657 | 143.9 | 795 | 777 | 152.1 |
| B | 14 | 1 | 22012 | 139.66 | 795 | 777 | 152.1 |
| C | 3 | 233 | 247826 | 1384.35 | 760 | 765 | 178.5 |
| C | 14 | 238 | 116487 | 648.42 | 760 | 765 | 178.5 |
| C | 5 | 218 | 6139 | 30.11 | 760 | 765 | 178.5 |
| D | 1 | 52 | 829724 | 4504.49 | 755 | 731 | 184.0 |
| D | 13 | 189 | 93018 | 501.46 | 755 | 731 | 184.0 |
| D | 2 | 152 | 59647 | 320.13 | 755 | 731 | 184.0 |
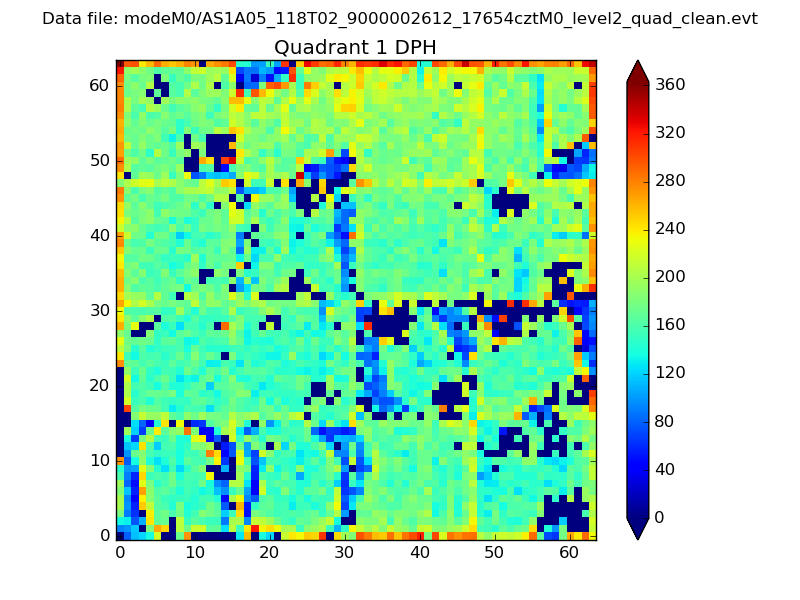
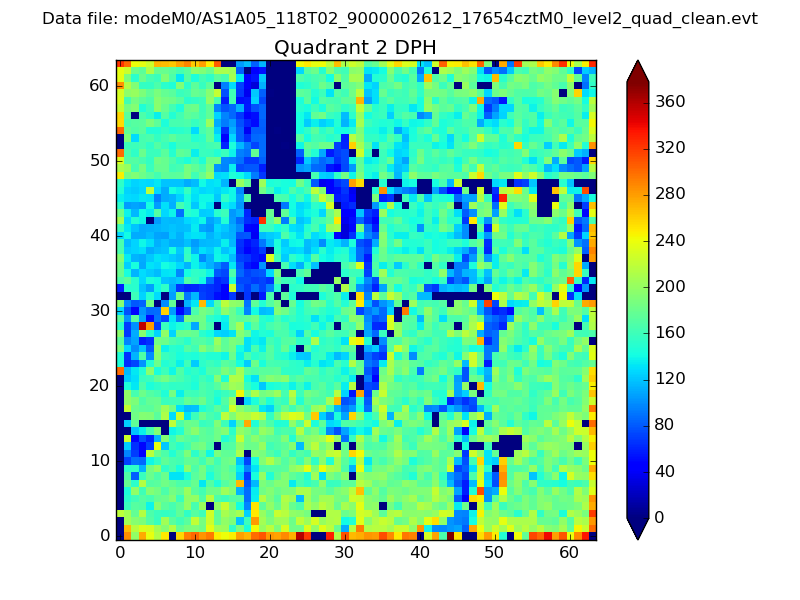
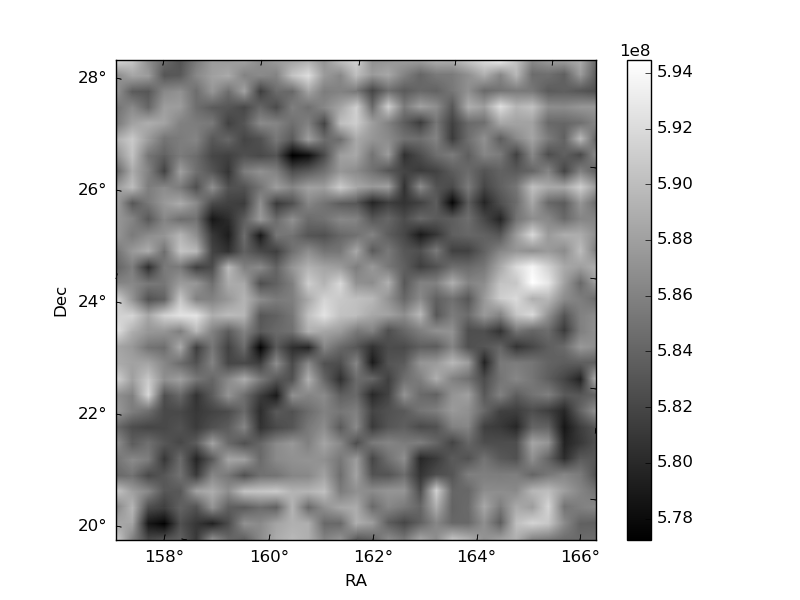
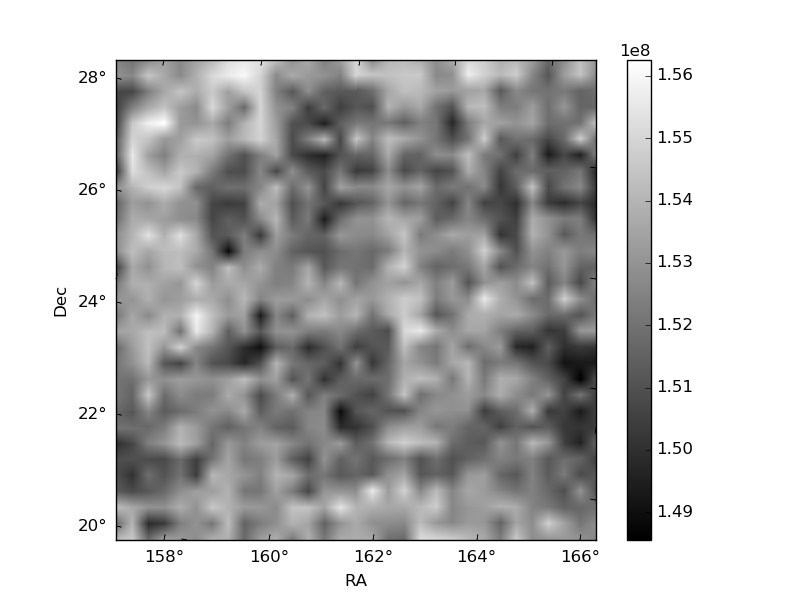
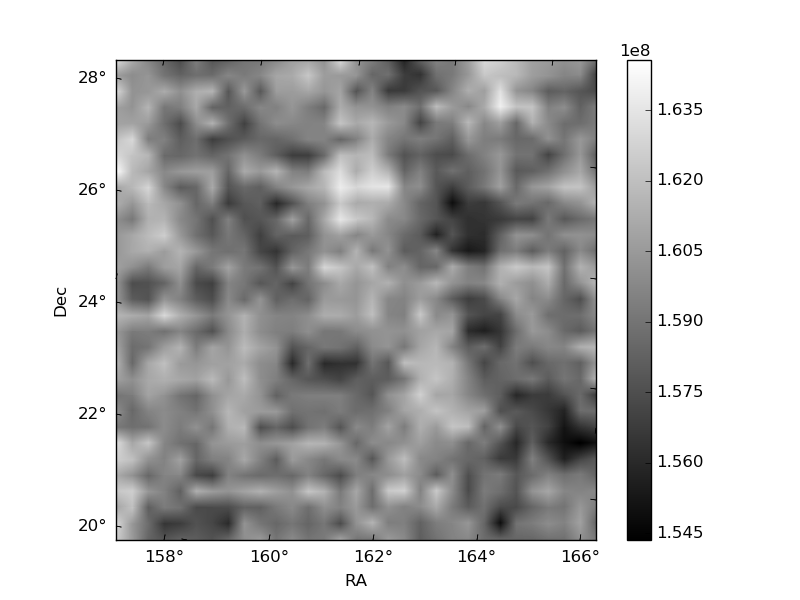
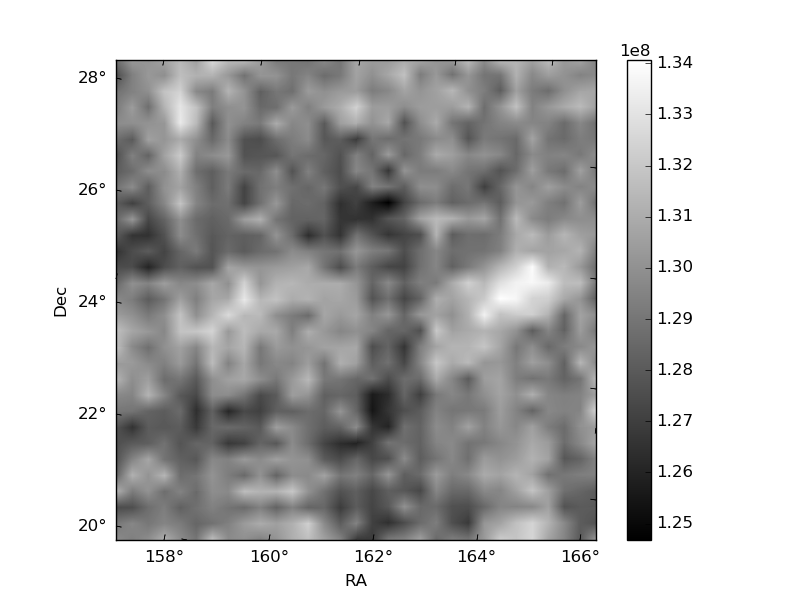
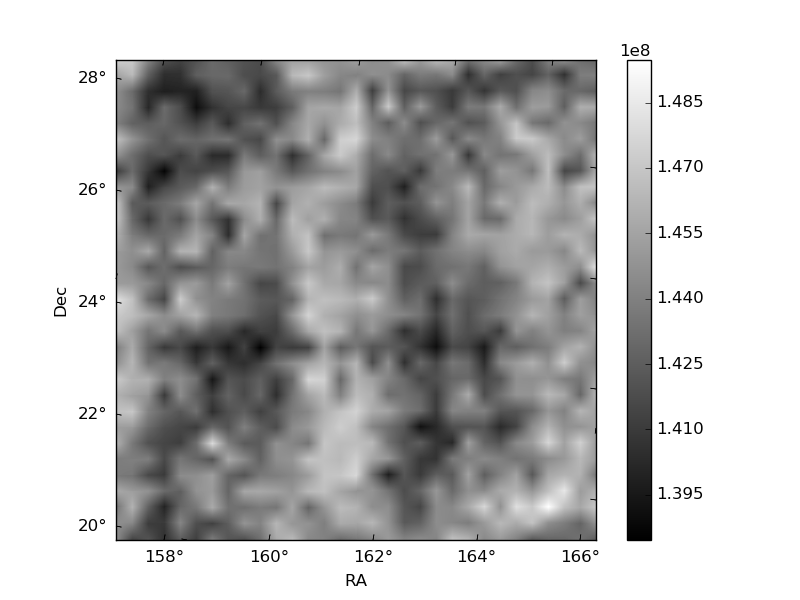
Histogram calculated using DETX and DETY for each event in the final _common_clean file
| Quadrant A | 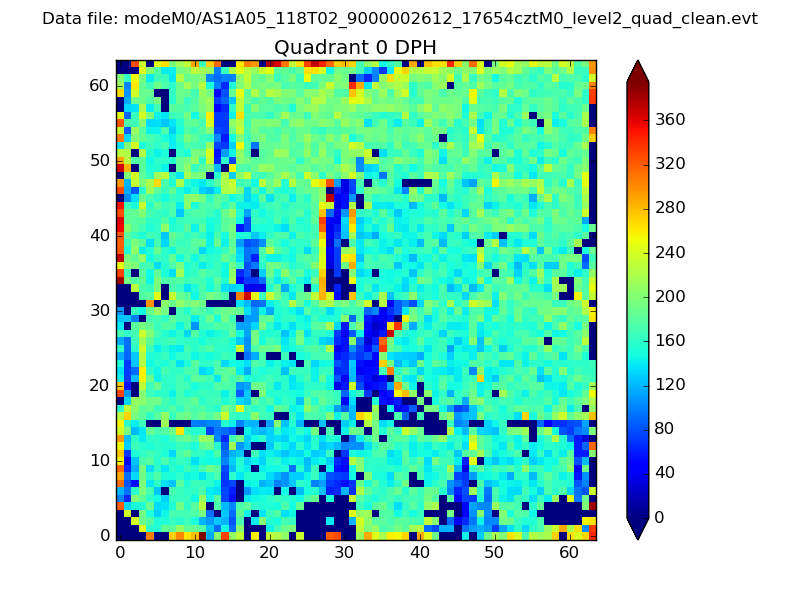 |
 |
Quadrant B |
|---|---|---|---|
| Quadrant D | 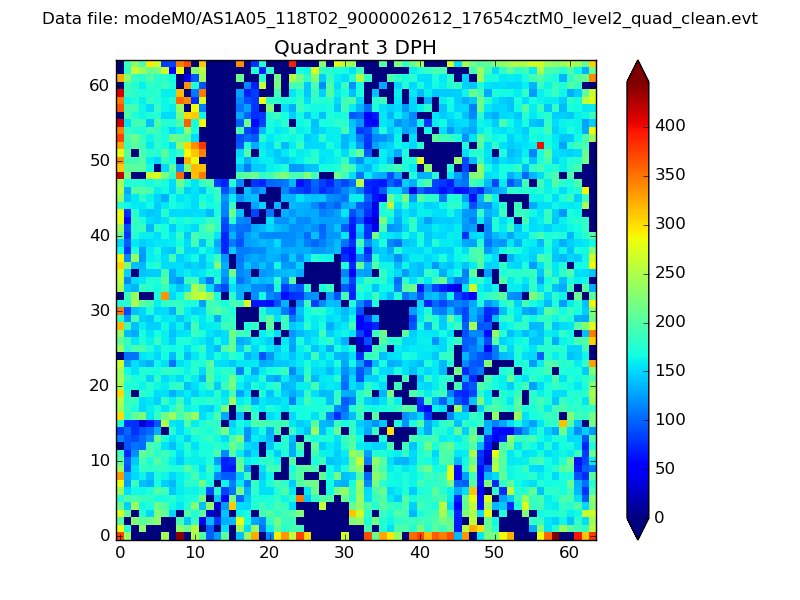 |
 |
Quadrant C |
| Plot type | Count rate plots | Images |
|---|---|---|
| Comparison with Poisson distribution Blue bars denote a histogram of data divided into 1 sec bins. Red curve is a Poisson curve with rate = median count rate of data. |
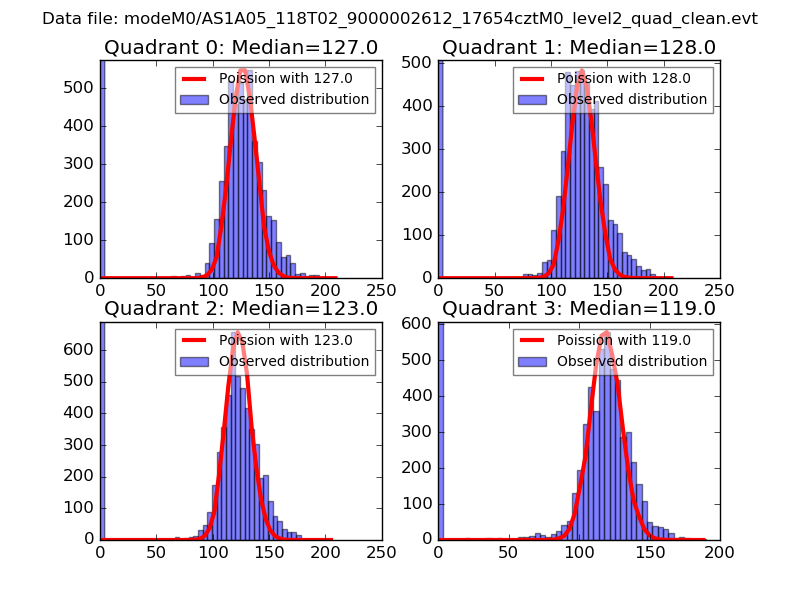 |
 |
| Quadrant-wise count rates Data is divided into 100 sec bins |
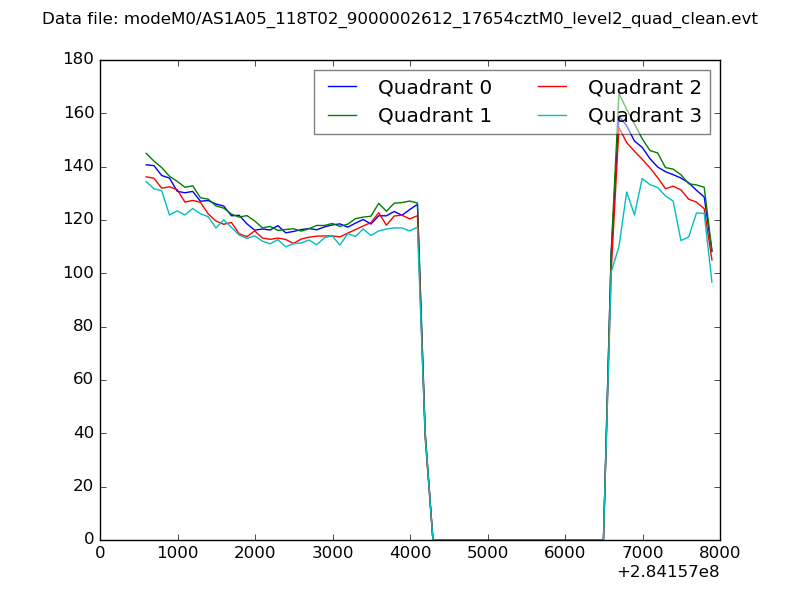 |
|
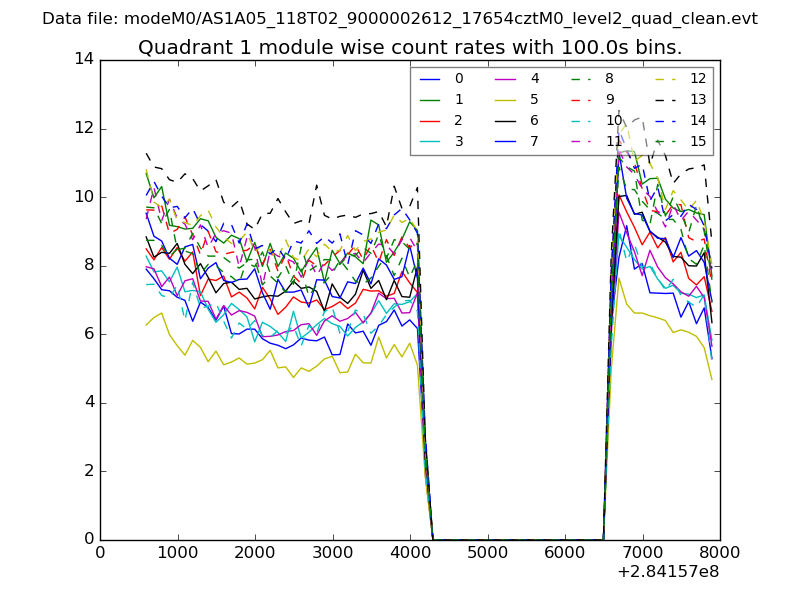
| Module-wise count rates for Quadrant A Data is divided into 100 sec bins |
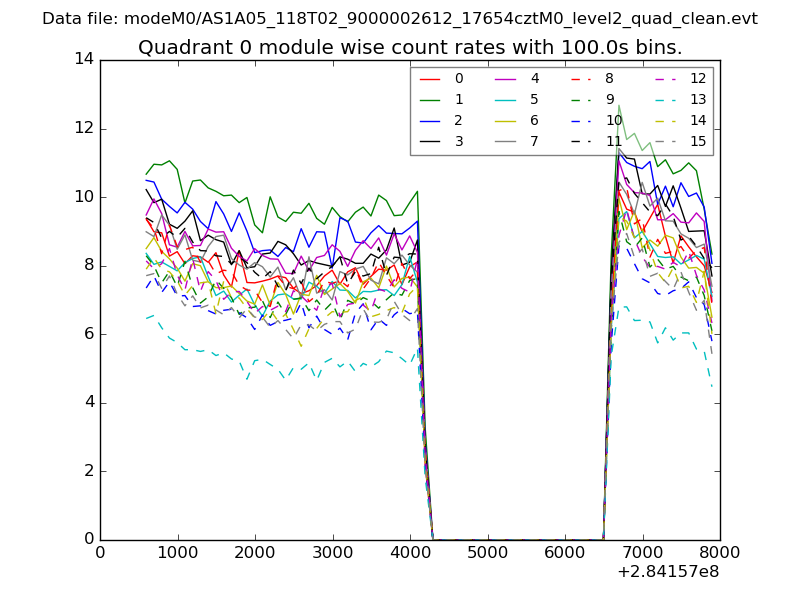 |
 |
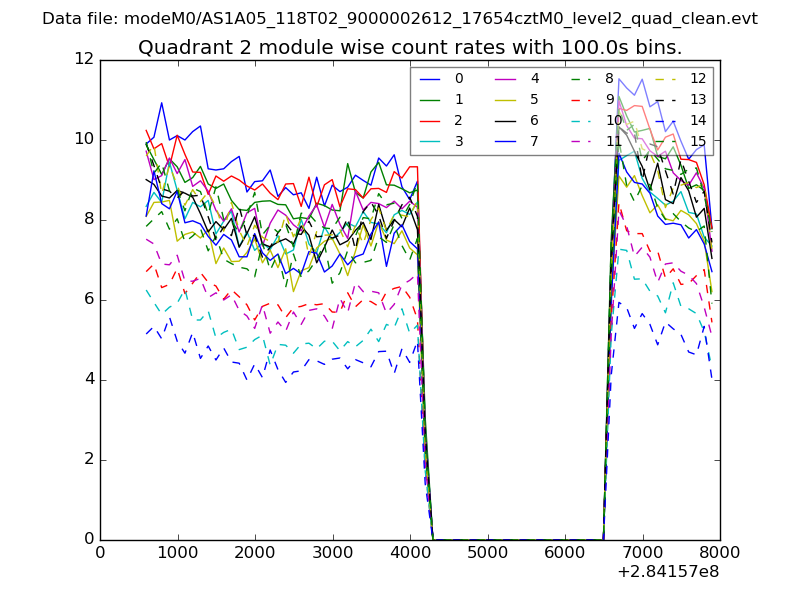
| Module-wise count rates for Quadrant B Data is divided into 100 sec bins |
 |
 |
| Module-wise count rates for Quadrant C Data is divided into 100 sec bins |
 |
 |
| Module-wise count rates for Quadrant D Data is divided into 100 sec bins |
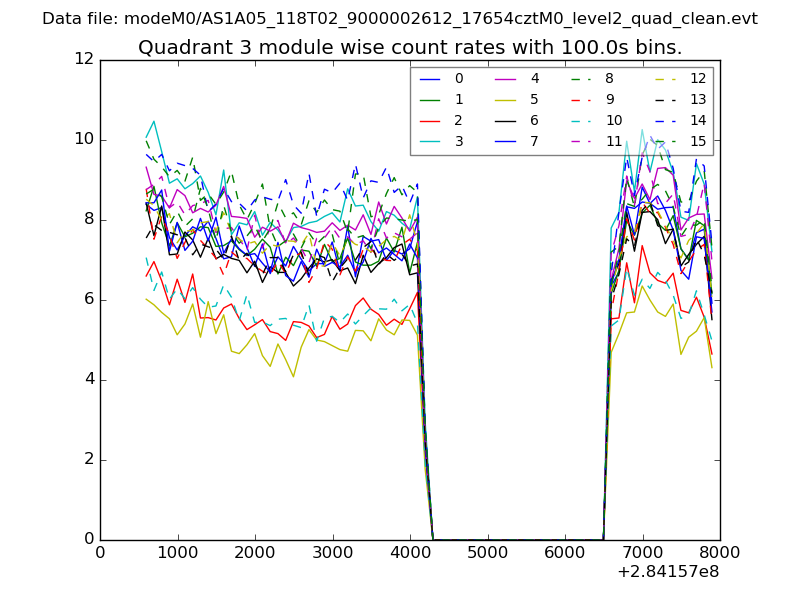 |
 |
| Parameter | Plot |
|---|---|
| CZT HV Monitor | 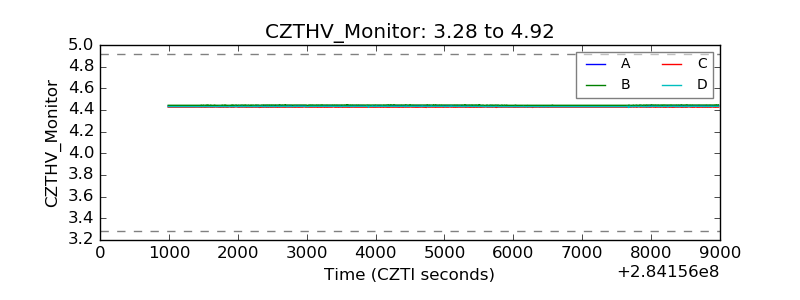 |
| D_VDD | 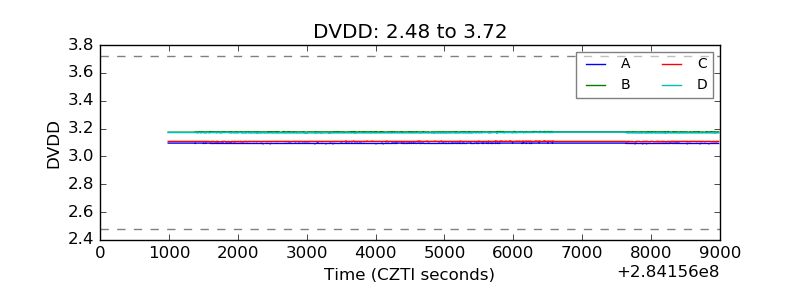 |
| Temperature 1 | 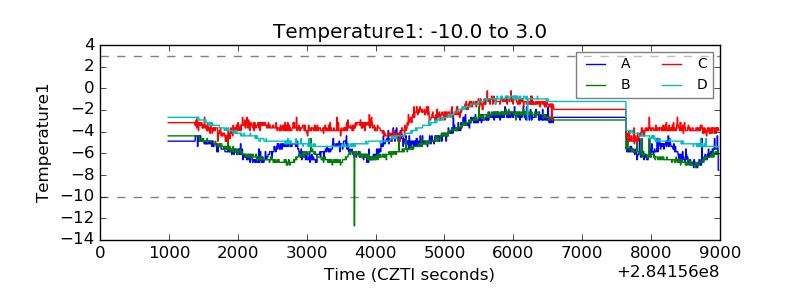 |
| Veto HV Monitor | 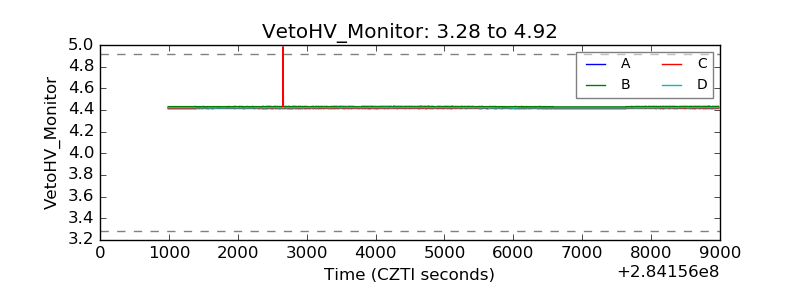 |
| Veto LLD | 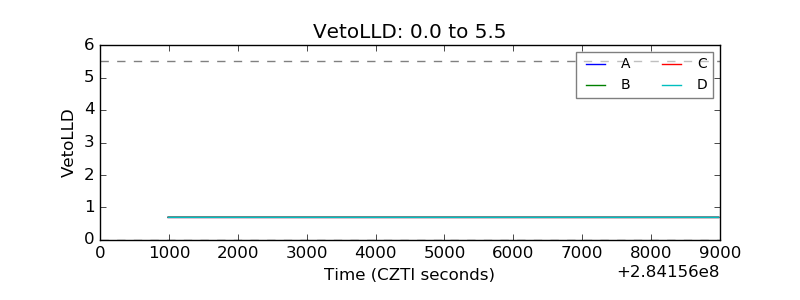 |
| Alpha Counter |  |
| _CPM_Rate | 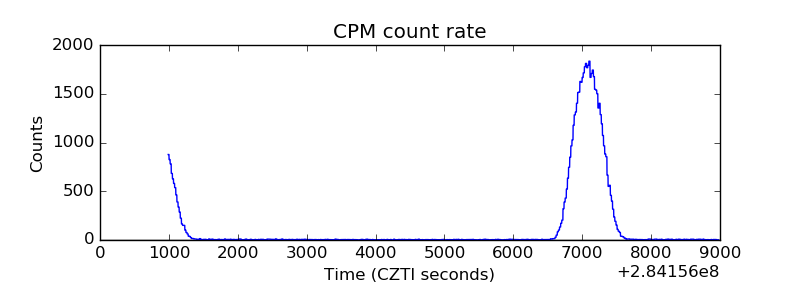 |
| CZT Counter | 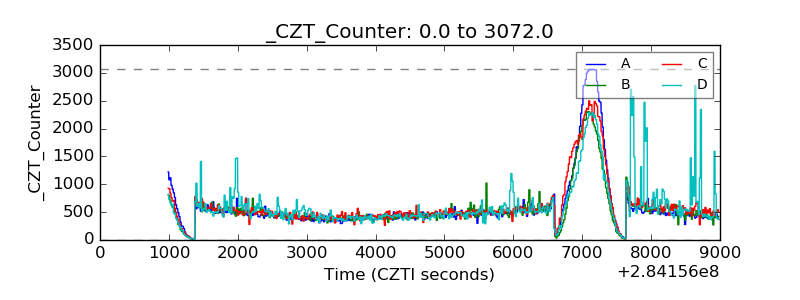 |
| +2.5 Volts monitor | 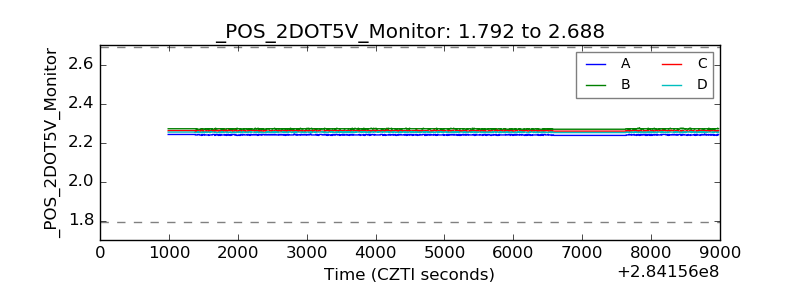 |
| +5 Volts monitor | 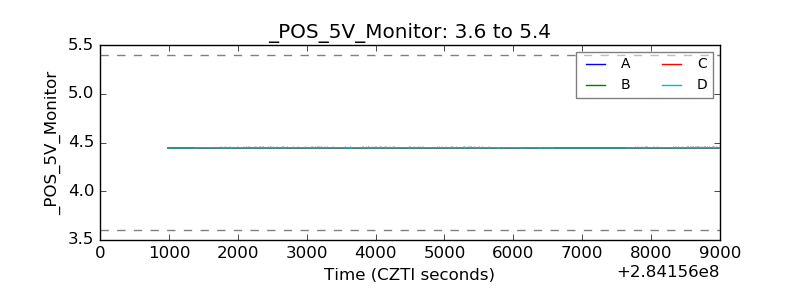 |
| _ROLL_ROT | 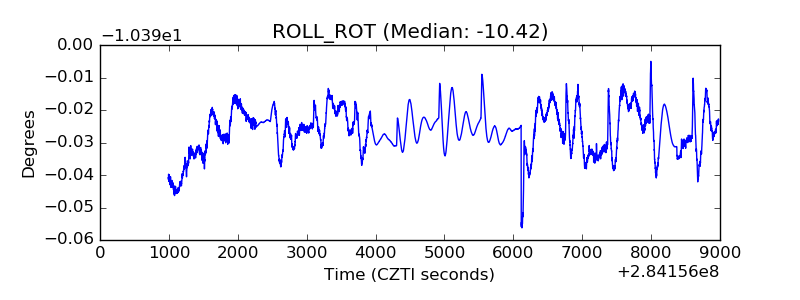 |
| _Roll_DEC | 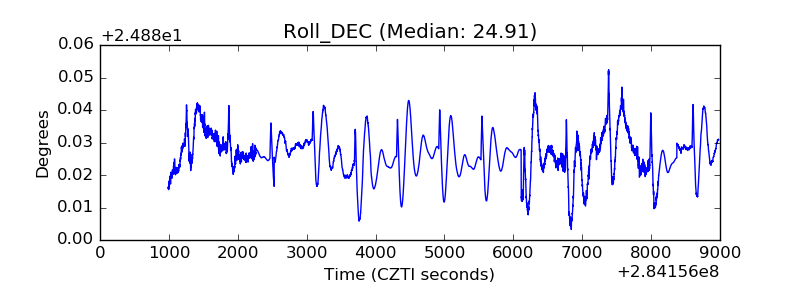 |
| _Roll_RA | 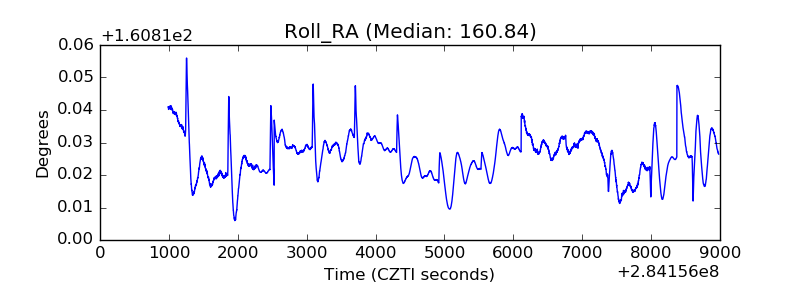 |
| Veto Counter | 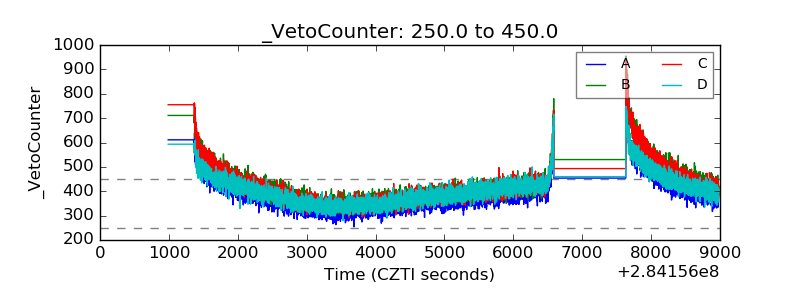 |