| Param | Original file | Final file |
|---|---|---|
| Filename | modeM0/AS1A05_118T02_9000002612_17656cztM0_level2.evt | modeM0/AS1A05_118T02_9000002612_17656cztM0_level2_quad_clean.evt |
| Size (bytes) | 470,082,240 | 103,976,640 |
| Size | 448.3 MB | 99.2 MB |
| Events in quadrant A | 3,198,367 | 683,750 |
| Events in quadrant B | 3,293,227 | 702,972 |
| Events in quadrant C | 3,721,762 | 661,076 |
| Events in quadrant D | 3,568,267 | 634,460 |
| Mode SS | |||
|---|---|---|---|
| Quadrant | BADHDUFLAG | Total packets | Discarded packets |
| A | 0 | 136 | 0 |
| B | 0 | 136 | 0 |
| C | 0 | 136 | 0 |
| D | 0 | 136 | 0 |
| Mode M0 | |||
|---|---|---|---|
| Quadrant | BADHDUFLAG | Total packets | Discarded packets |
| A | 0 | 13937 | 2 |
| B | 0 | 14190 | 2 |
| C | 0 | 15431 | 3 |
| D | 0 | 15311 | 2 |
| Mode M9 | |||
|---|---|---|---|
| Quadrant | BADHDUFLAG | Total packets | Discarded packets |
| A | 0 | 14 | 0 |
| B | 0 | 15 | 0 |
| C | 0 | 15 | 0 |
| D | 0 | 15 | 0 |
| Quadrant | Total seconds | Saturated seconds | Saturation percentage |
|---|---|---|---|
| A | 6696 | 16 | 0.238949% |
| B | 6696 | 47 | 0.701912% |
| C | 6695 | 57 | 0.851382% |
| D | 6695 | 135 | 2.016430% |
Noise dominated data is calculated using 1-second bins in cleaned event files. If a bin has >2000 counts, and if more than 50% of those come from <1% of pixels, then it is considered to be noise-dominated and hence unusable.
| Quadrant | # 1 sec bins | Bins with >0 counts | Bins with >2000 counts | High rate bins dominated by noise | Noise dominated (total time) | Noise dominated (detector-on time) | Marked lightcurve |
|---|---|---|---|---|---|---|---|
| A | 7866 | 6697 | 0 | 0 | 0.00% | 0.00% | 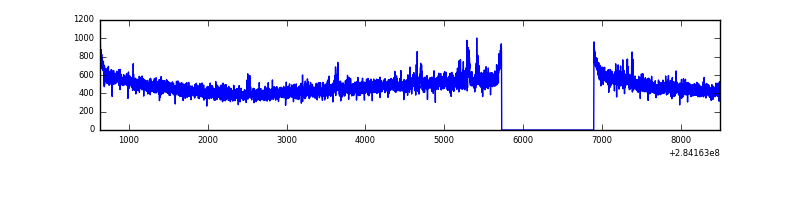 |
| B | 7866 | 6697 | 1 | 1 | 0.01% | 0.01% | 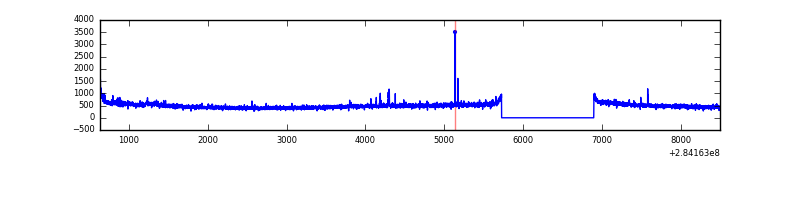 |
| C | 7865 | 6695 | 0 | 0 | 0.00% | 0.00% | 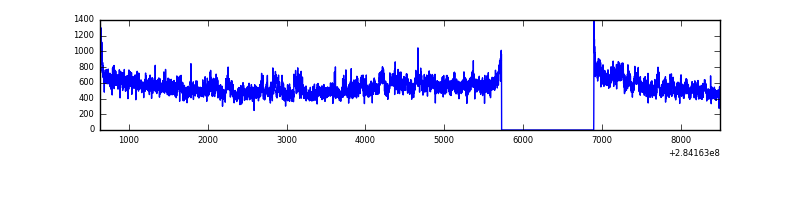 |
| D | 7865 | 6696 | 118 | 118 | 1.50% | 1.76% | 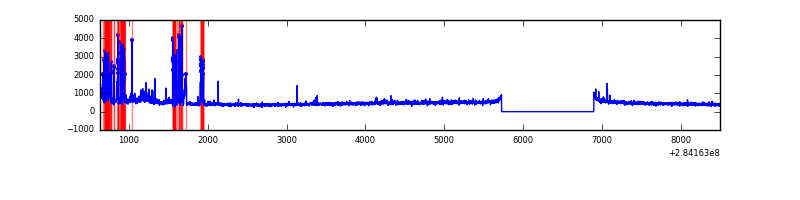 |
Top three noisy pixels from each quadrant. If the there are fewer than three noisy pixels in the level2.evt file, extra rows are filled as -1
| Pixel properties | Quadrant properties | ||||||
|---|---|---|---|---|---|---|---|
| Quadrant | DetID | PixID | Counts | Sigma | Mean | Median | Sigma |
| A | 14 | 237 | 60540 | 360.23 | 816 | 798 | 165.8 |
| A | 0 | 226 | 7027 | 37.56 | 816 | 798 | 165.8 |
| A | 3 | 137 | 5938 | 30.99 | 816 | 798 | 165.8 |
| B | 0 | 230 | 22634 | 139.69 | 823 | 802 | 156.3 |
| B | 12 | 111 | 18725 | 114.68 | 823 | 802 | 156.3 |
| B | 14 | 1 | 16813 | 102.45 | 823 | 802 | 156.3 |
| C | 3 | 233 | 530370 | 2882.79 | 784 | 790 | 183.7 |
| C | 14 | 238 | 122529 | 662.69 | 784 | 790 | 183.7 |
| C | 5 | 218 | 11079 | 56.01 | 784 | 790 | 183.7 |
| D | 1 | 52 | 509443 | 2703.44 | 777 | 753 | 188.2 |
| D | 2 | 152 | 75156 | 395.42 | 777 | 753 | 188.2 |
| D | 13 | 189 | 38723 | 201.79 | 777 | 753 | 188.2 |
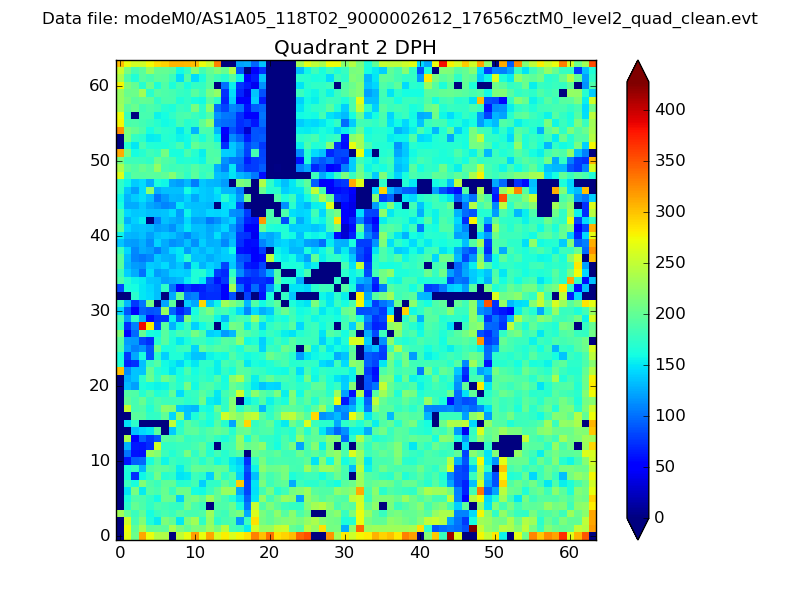
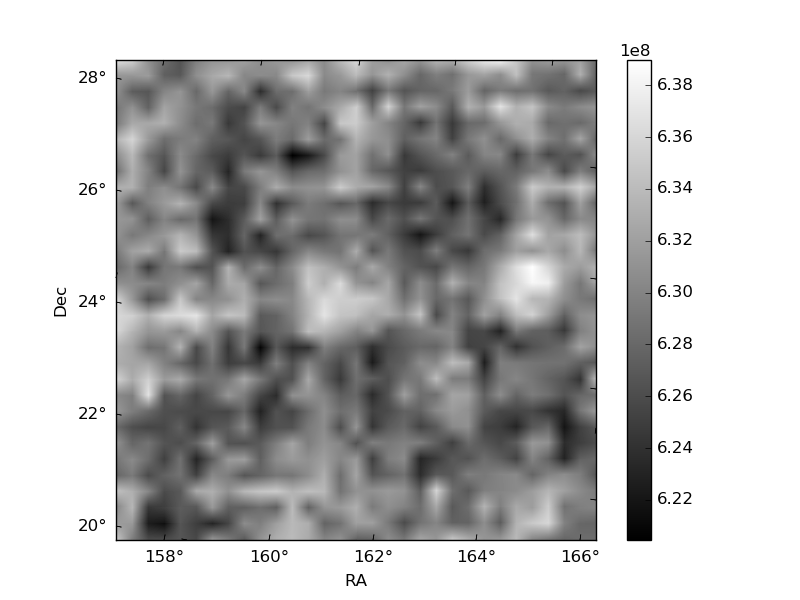
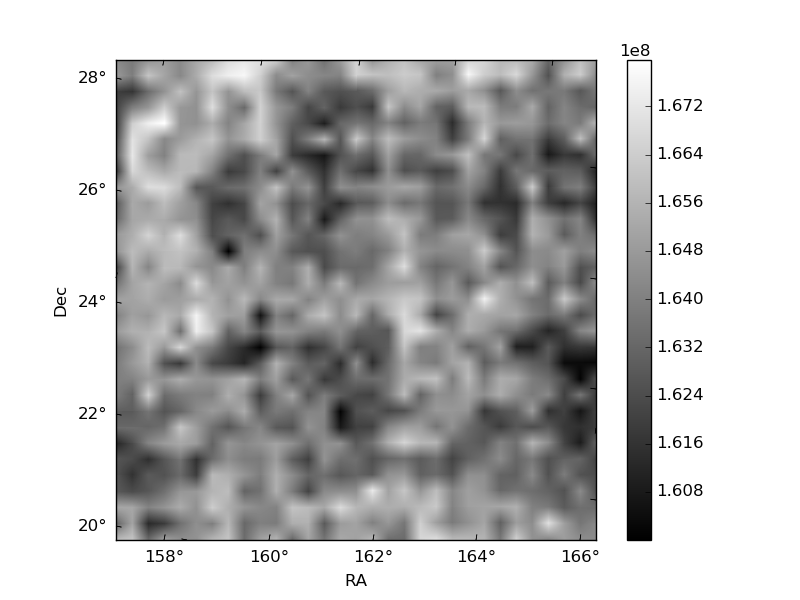
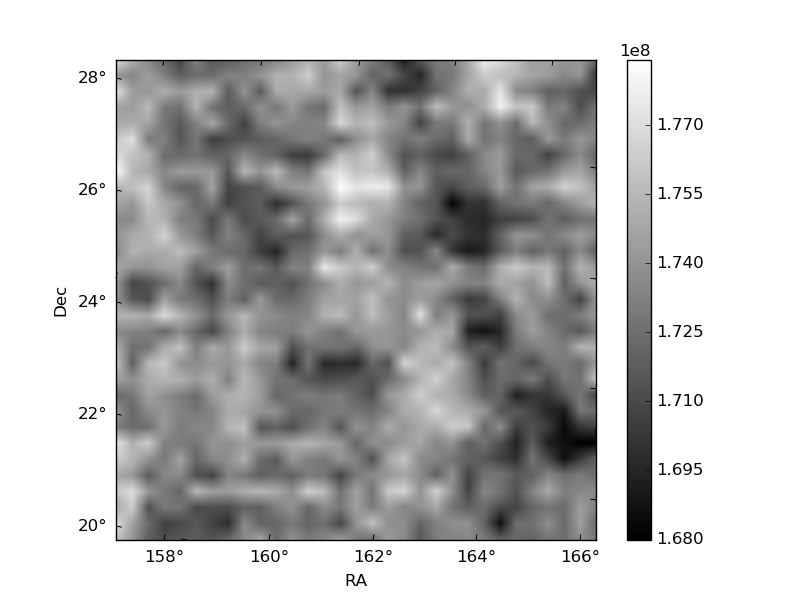
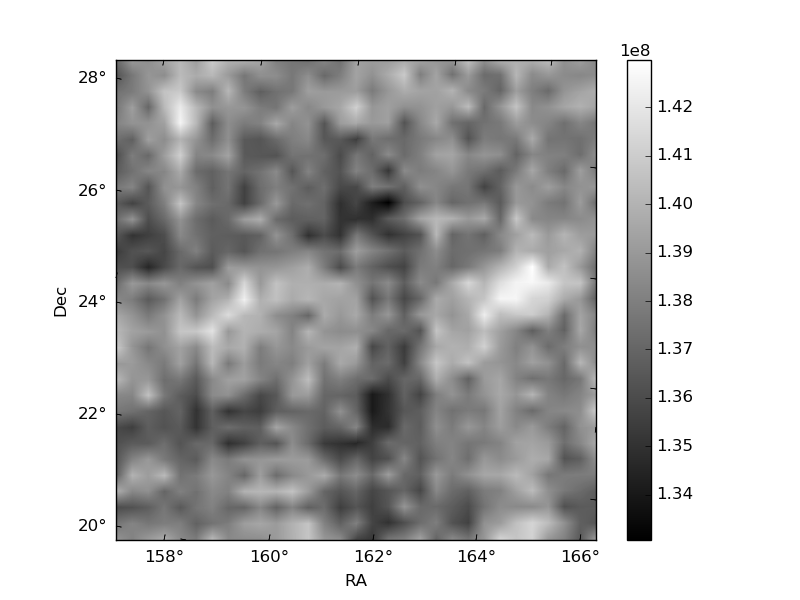
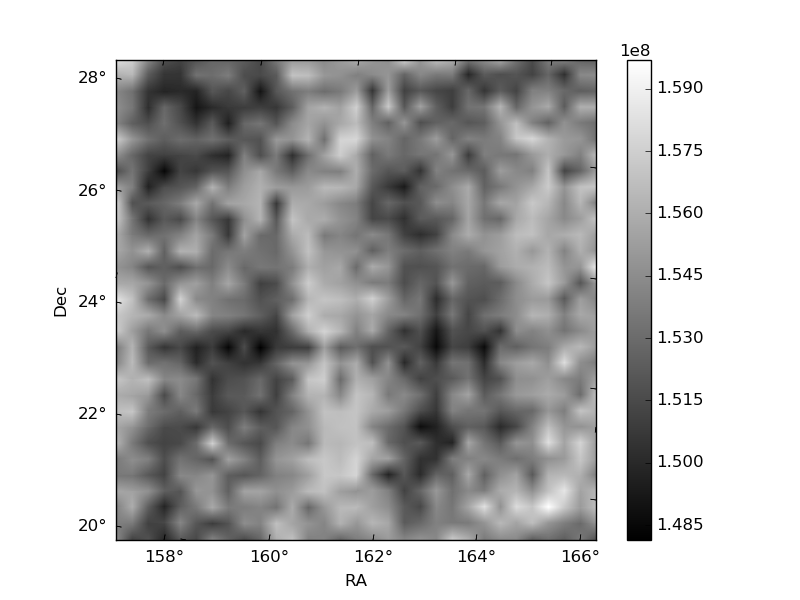
Histogram calculated using DETX and DETY for each event in the final _common_clean file
| Quadrant A | 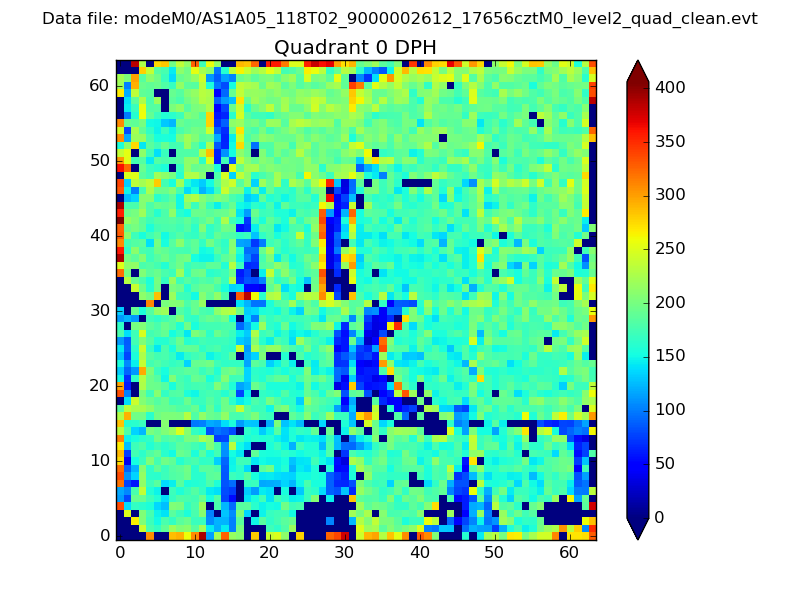 |
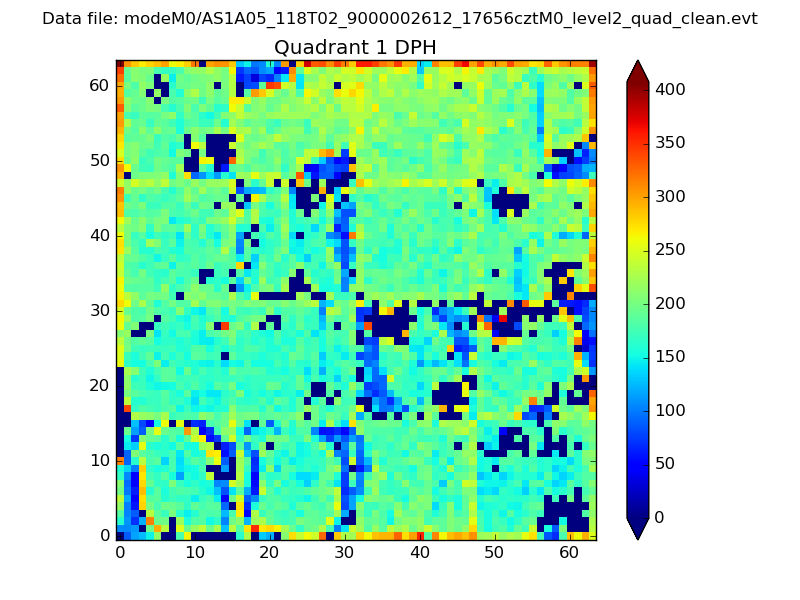 |
Quadrant B |
|---|---|---|---|
| Quadrant D | 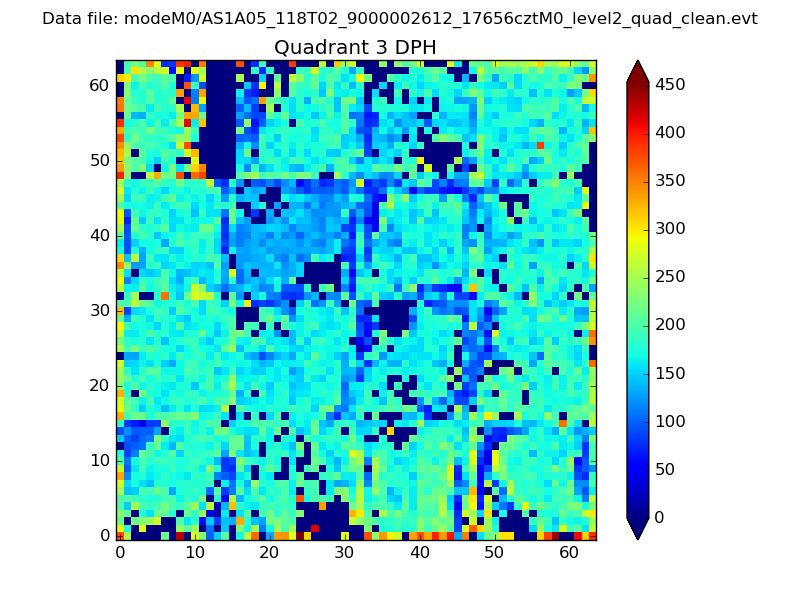 |
 |
Quadrant C |
| Plot type | Count rate plots | Images |
|---|---|---|
| Comparison with Poisson distribution Blue bars denote a histogram of data divided into 1 sec bins. Red curve is a Poisson curve with rate = median count rate of data. |
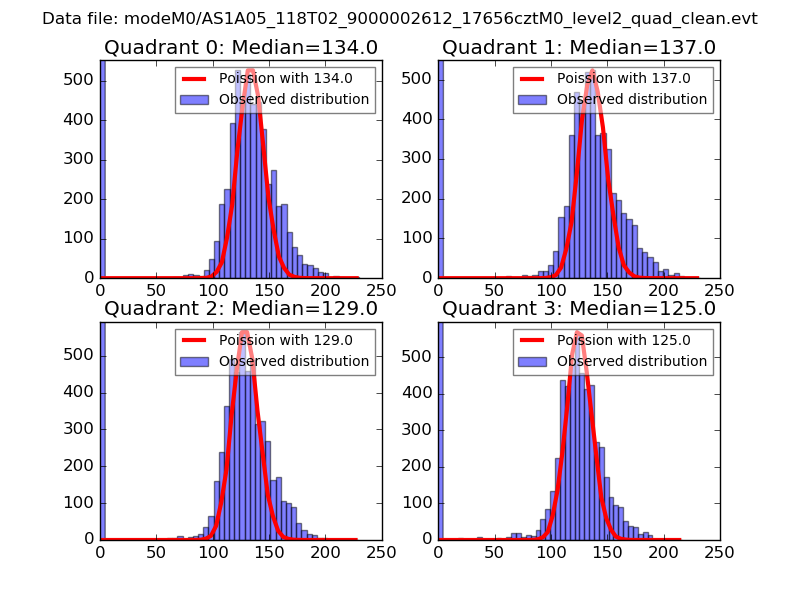 |
 |
| Quadrant-wise count rates Data is divided into 100 sec bins |
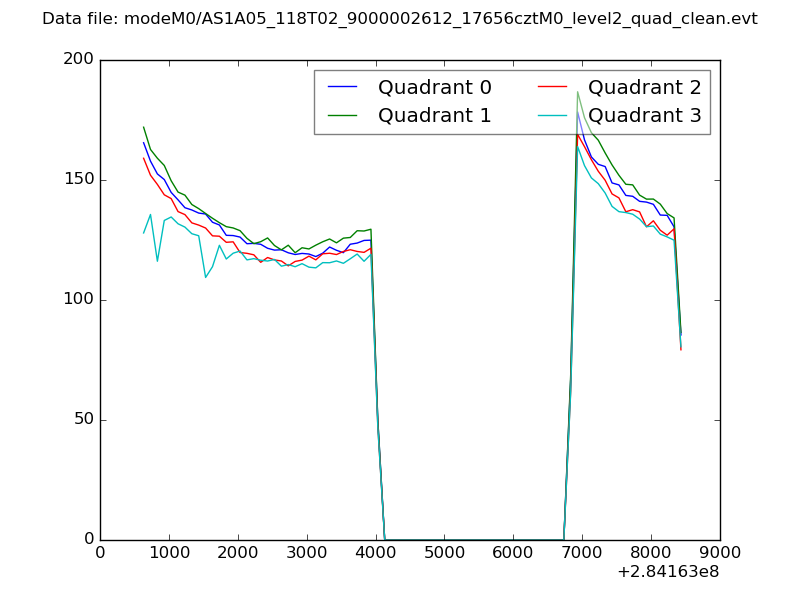 |
|
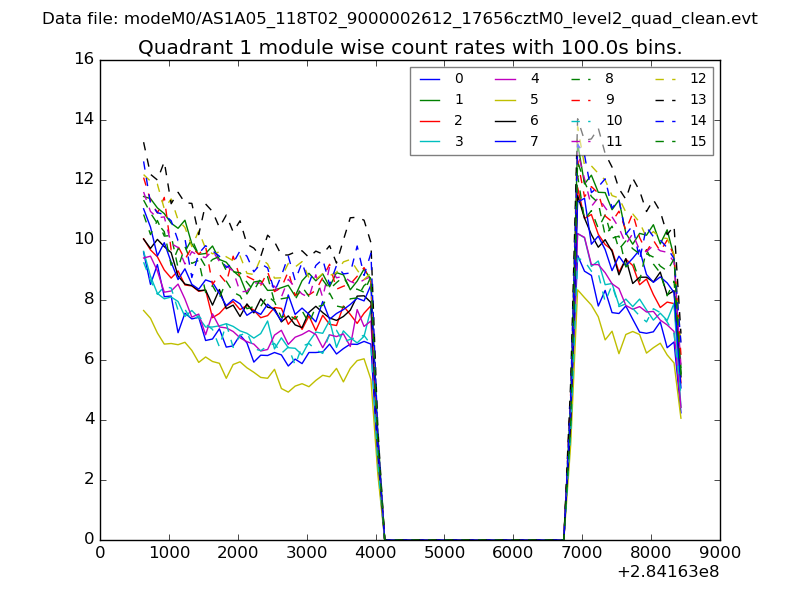
| Module-wise count rates for Quadrant A Data is divided into 100 sec bins |
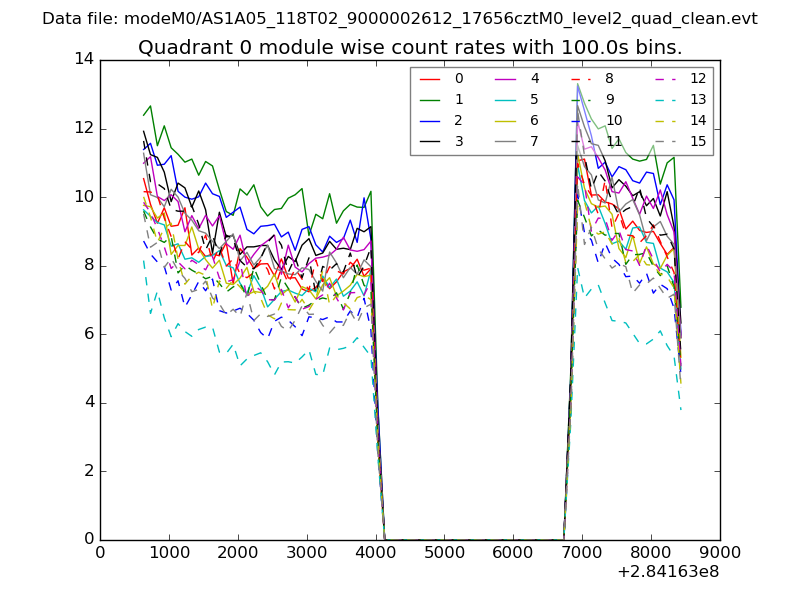 |
 |
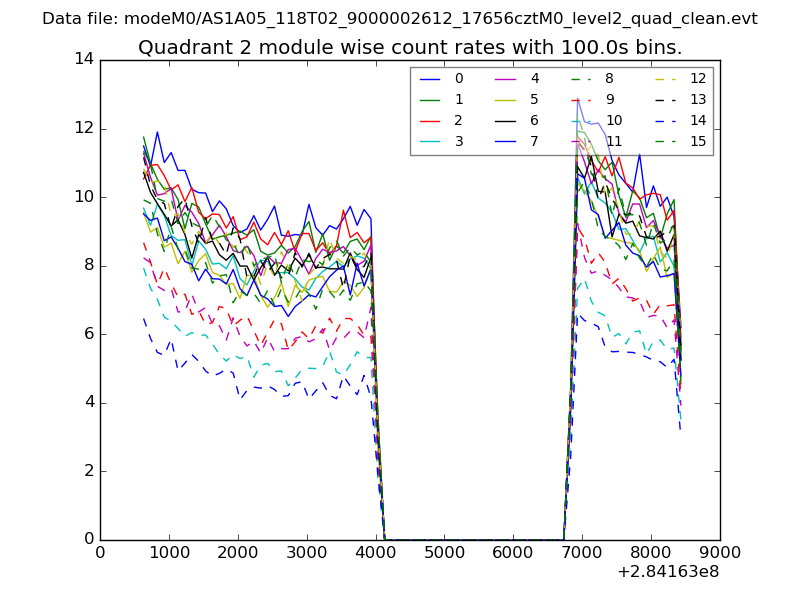
| Module-wise count rates for Quadrant B Data is divided into 100 sec bins |
 |
 |
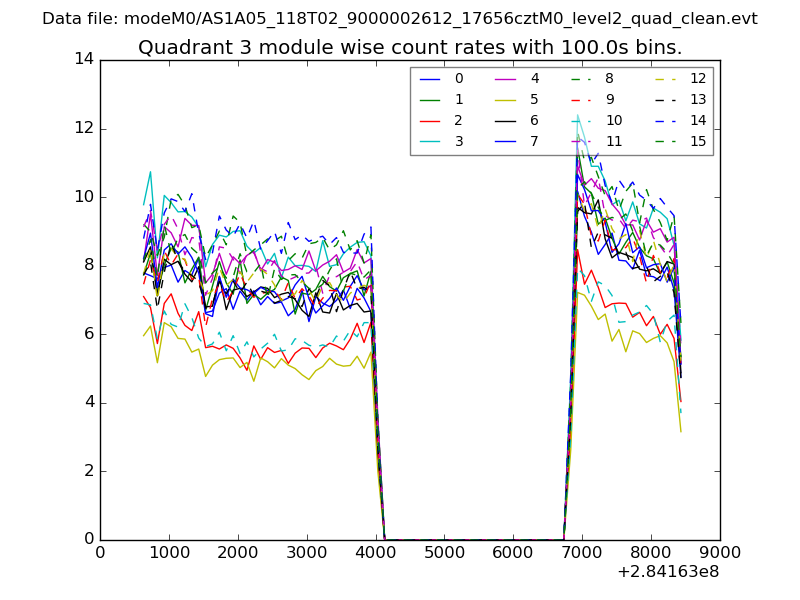
| Module-wise count rates for Quadrant C Data is divided into 100 sec bins |
 |
 |
| Module-wise count rates for Quadrant D Data is divided into 100 sec bins |
 |
 |
| Parameter | Plot |
|---|---|
| CZT HV Monitor | 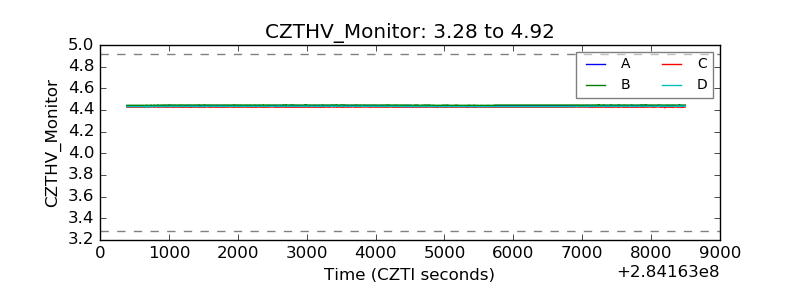 |
| D_VDD | 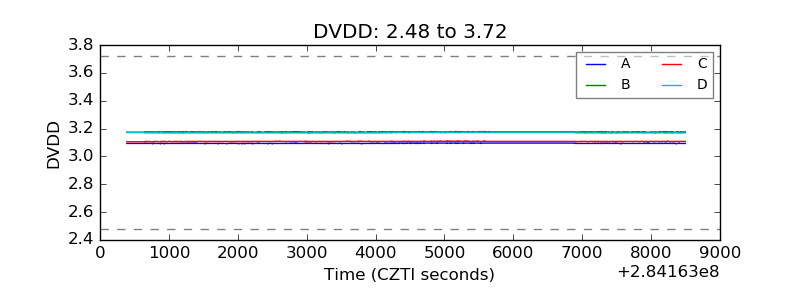 |
| Temperature 1 | 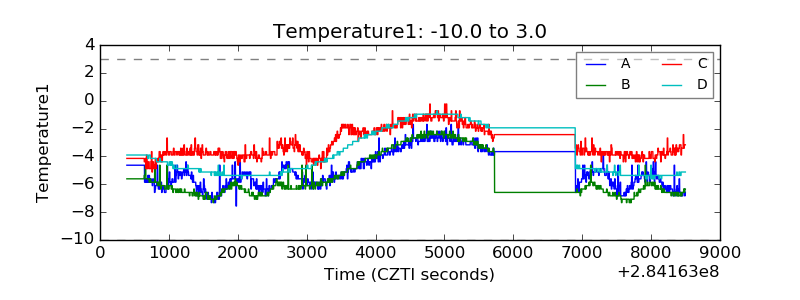 |
| Veto HV Monitor | 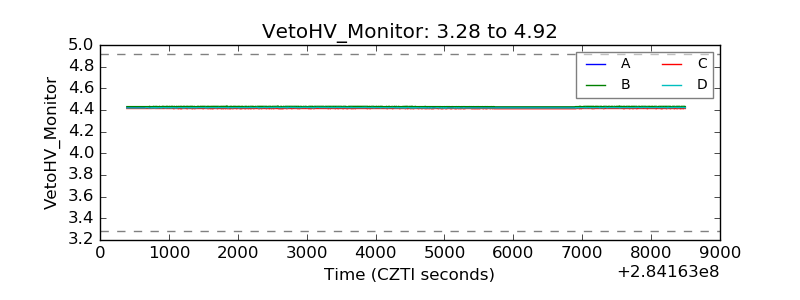 |
| Veto LLD | 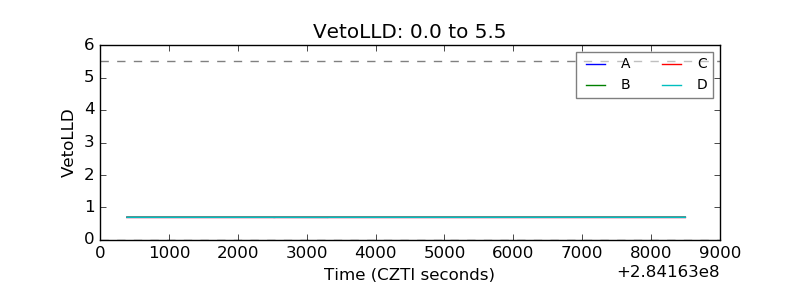 |
| Alpha Counter | 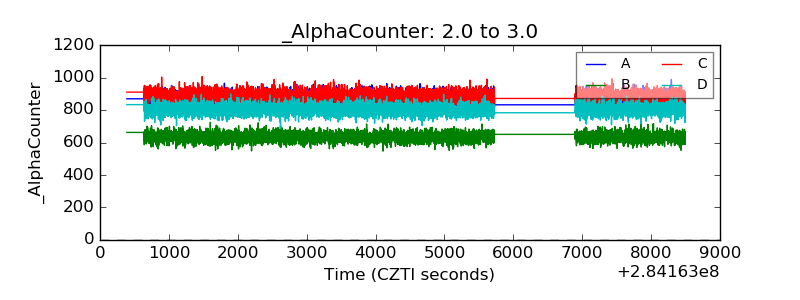 |
| _CPM_Rate | 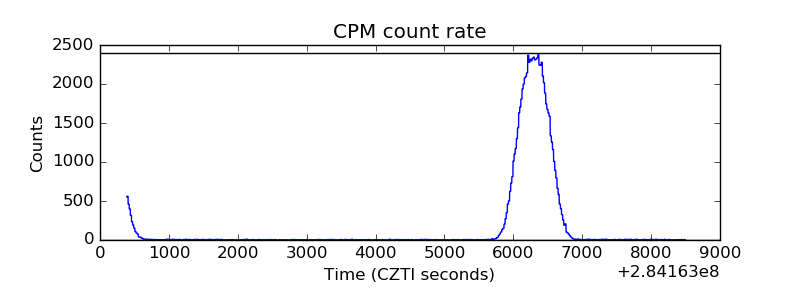 |
| CZT Counter | 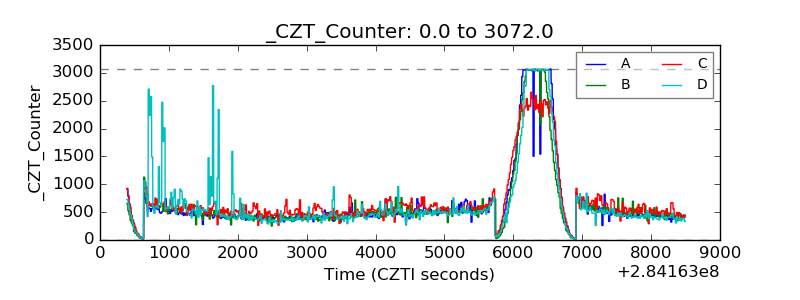 |
| +2.5 Volts monitor | 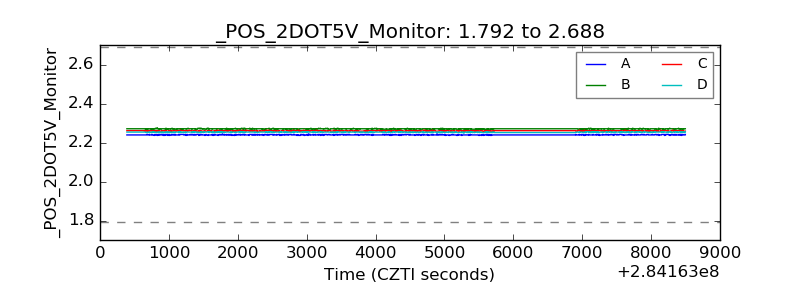 |
| +5 Volts monitor | 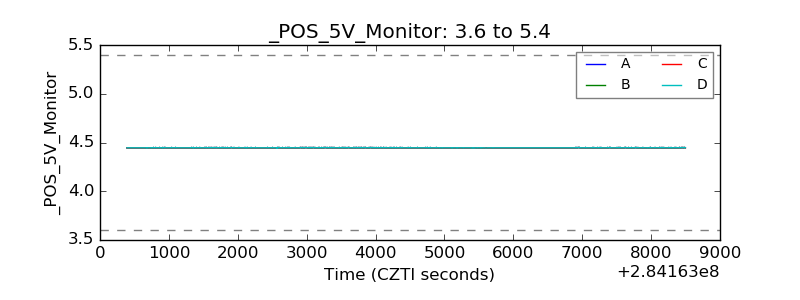 |
| _ROLL_ROT | 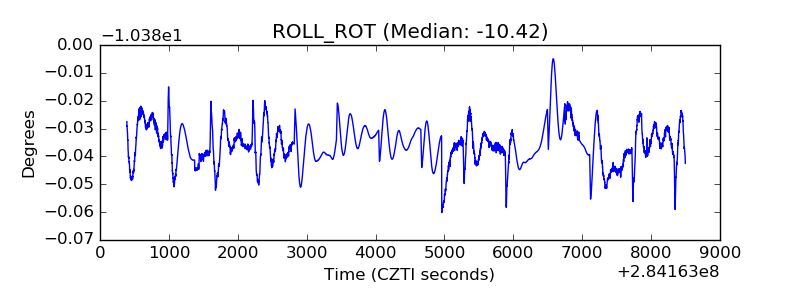 |
| _Roll_DEC | 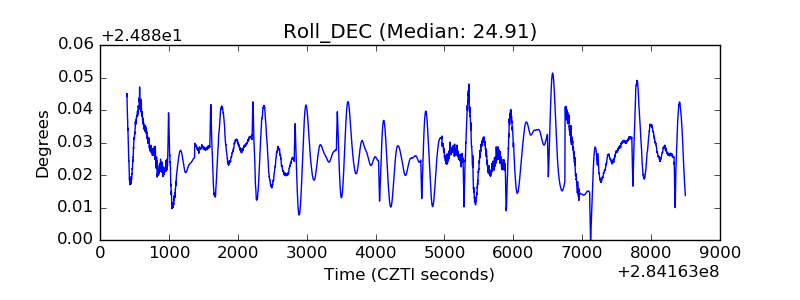 |
| _Roll_RA | 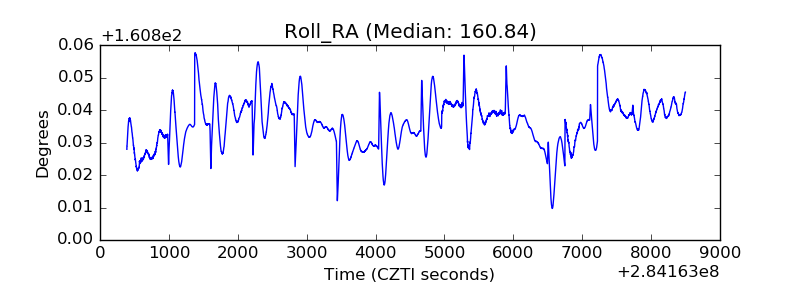 |
| Veto Counter | 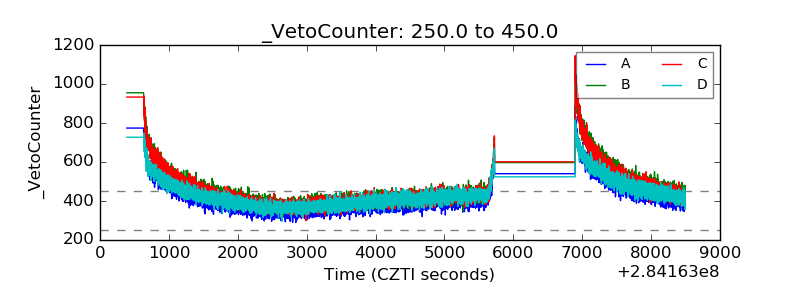 |