| Param | Original file | Final file |
|---|---|---|
| Filename | modeM0/AS1A05_118T02_9000002612_17658cztM0_level2.evt | modeM0/AS1A05_118T02_9000002612_17658cztM0_level2_quad_clean.evt |
| Size (bytes) | 477,970,560 | 97,390,080 |
| Size | 455.8 MB | 92.9 MB |
| Events in quadrant A | 3,202,047 | 637,291 |
| Events in quadrant B | 3,345,581 | 652,824 |
| Events in quadrant C | 3,663,869 | 614,364 |
| Events in quadrant D | 3,824,189 | 593,277 |
| Mode SS | |||
|---|---|---|---|
| Quadrant | BADHDUFLAG | Total packets | Discarded packets |
| A | 0 | 130 | 0 |
| B | 0 | 130 | 0 |
| C | 0 | 130 | 0 |
| D | 0 | 130 | 0 |
| Mode M0 | |||
|---|---|---|---|
| Quadrant | BADHDUFLAG | Total packets | Discarded packets |
| A | 0 | 13414 | 2 |
| B | 0 | 13858 | 2 |
| C | 0 | 14948 | 2 |
| D | 0 | 15622 | 2 |
| Mode M9 | |||
|---|---|---|---|
| Quadrant | BADHDUFLAG | Total packets | Discarded packets |
| A | 0 | 16 | 0 |
| B | 0 | 17 | 0 |
| C | 0 | 17 | 0 |
| D | 0 | 17 | 0 |
| Quadrant | Total seconds | Saturated seconds | Saturation percentage |
|---|---|---|---|
| A | 6481 | 18 | 0.277735% |
| B | 6481 | 41 | 0.632618% |
| C | 6481 | 76 | 1.172659% |
| D | 6481 | 250 | 3.857429% |
Noise dominated data is calculated using 1-second bins in cleaned event files. If a bin has >2000 counts, and if more than 50% of those come from <1% of pixels, then it is considered to be noise-dominated and hence unusable.
| Quadrant | # 1 sec bins | Bins with >0 counts | Bins with >2000 counts | High rate bins dominated by noise | Noise dominated (total time) | Noise dominated (detector-on time) | Marked lightcurve |
|---|---|---|---|---|---|---|---|
| A | 7796 | 6482 | 0 | 0 | 0.00% | 0.00% | 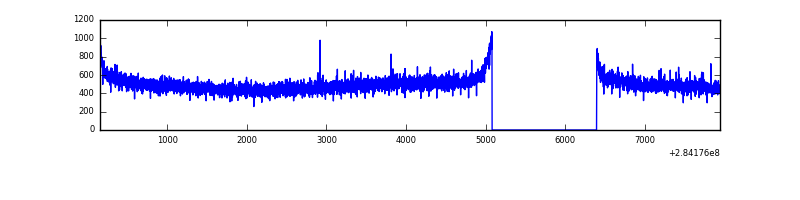 |
| B | 7796 | 6482 | 3 | 3 | 0.04% | 0.05% | 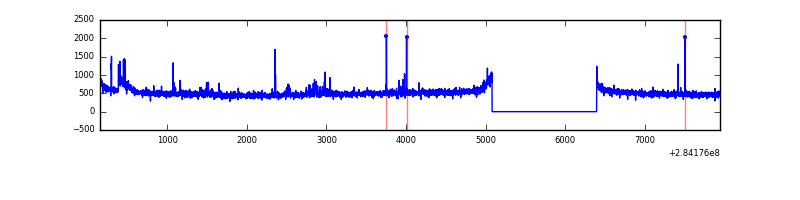 |
| C | 7796 | 6482 | 0 | 0 | 0.00% | 0.00% |  |
| D | 7796 | 6482 | 117 | 117 | 1.50% | 1.80% | 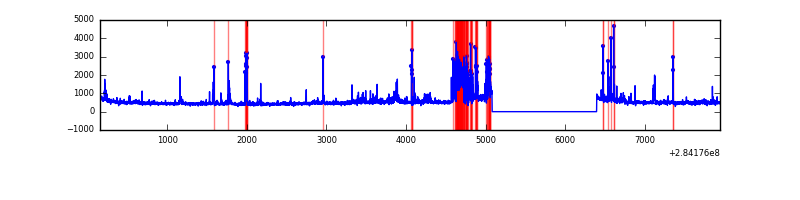 |
Top three noisy pixels from each quadrant. If the there are fewer than three noisy pixels in the level2.evt file, extra rows are filled as -1
| Pixel properties | Quadrant properties | ||||||
|---|---|---|---|---|---|---|---|
| Quadrant | DetID | PixID | Counts | Sigma | Mean | Median | Sigma |
| A | 0 | 226 | 7436 | 39.92 | 832 | 816 | 165.8 |
| A | 12 | 194 | 6008 | 31.31 | 832 | 816 | 165.8 |
| A | 3 | 137 | 5843 | 30.31 | 832 | 816 | 165.8 |
| B | 14 | 1 | 57295 | 361.38 | 830 | 812 | 156.3 |
| B | 10 | 245 | 25691 | 159.18 | 830 | 812 | 156.3 |
| B | 12 | 111 | 18095 | 110.58 | 830 | 812 | 156.3 |
| C | 3 | 233 | 448637 | 2440.28 | 792 | 798 | 183.5 |
| C | 14 | 238 | 125697 | 680.58 | 792 | 798 | 183.5 |
| C | 13 | 61 | 5692 | 26.67 | 792 | 798 | 183.5 |
| D | 1 | 52 | 729594 | 3865.26 | 783 | 760 | 188.6 |
| D | 13 | 189 | 129456 | 682.52 | 783 | 760 | 188.6 |
| D | 2 | 234 | 23559 | 120.91 | 783 | 760 | 188.6 |
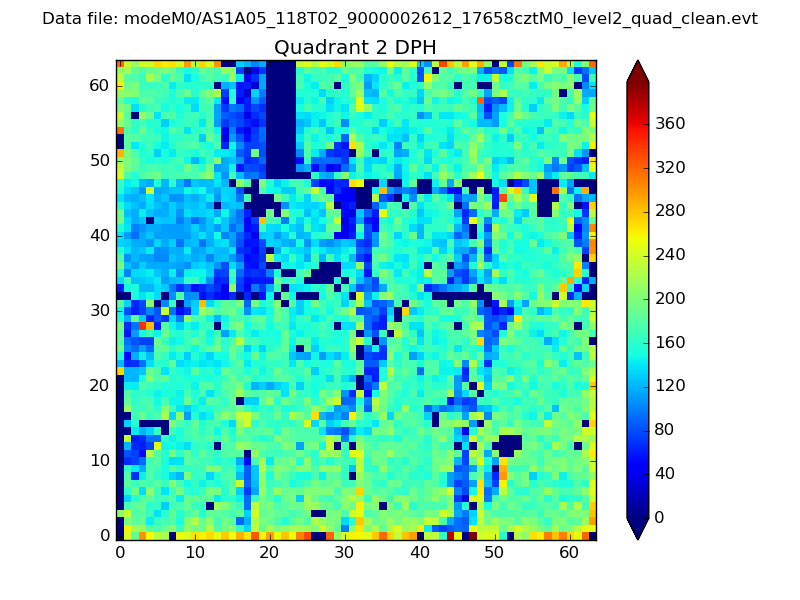
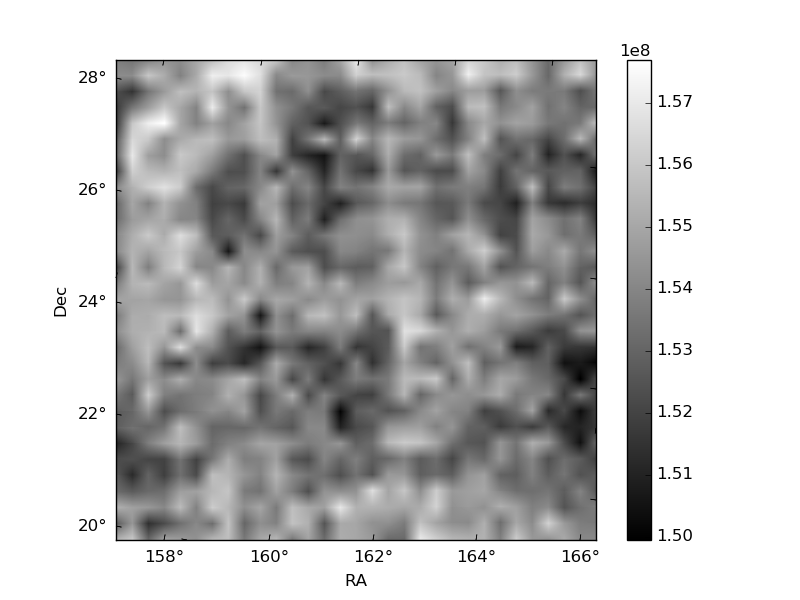
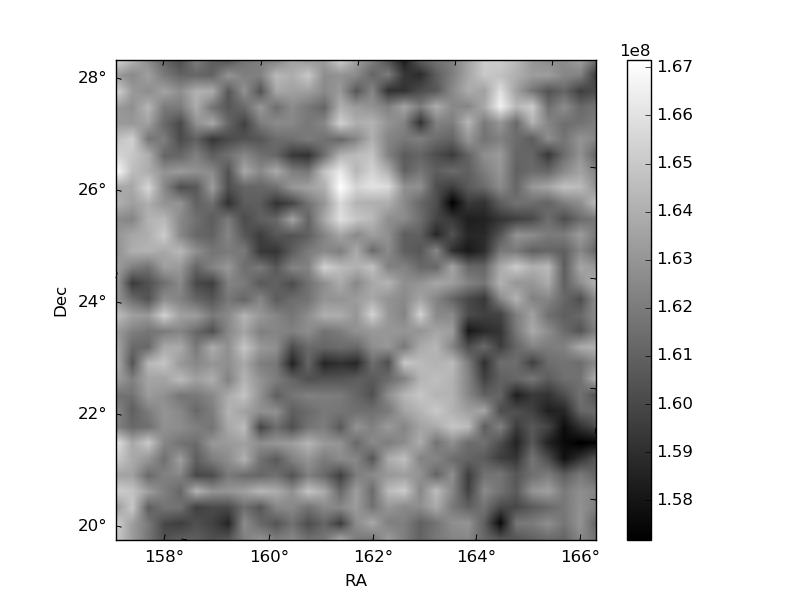
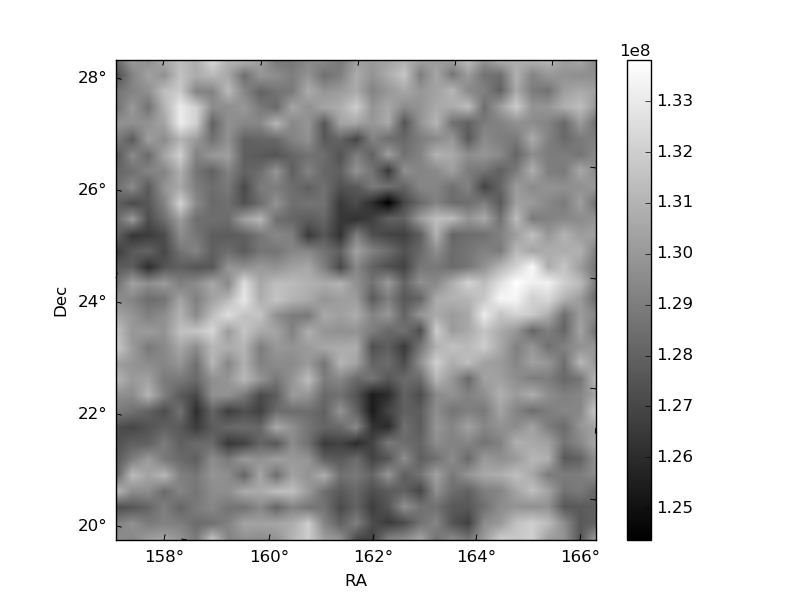
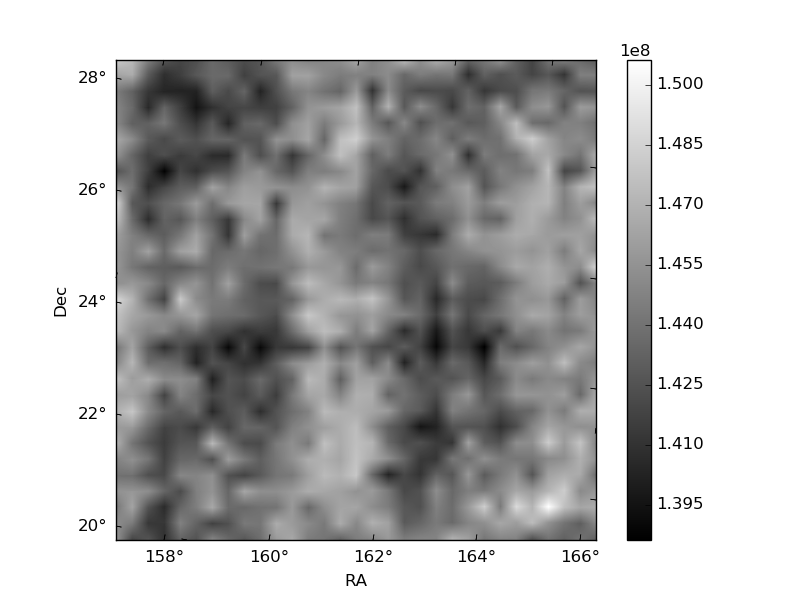
Histogram calculated using DETX and DETY for each event in the final _common_clean file
| Quadrant A | 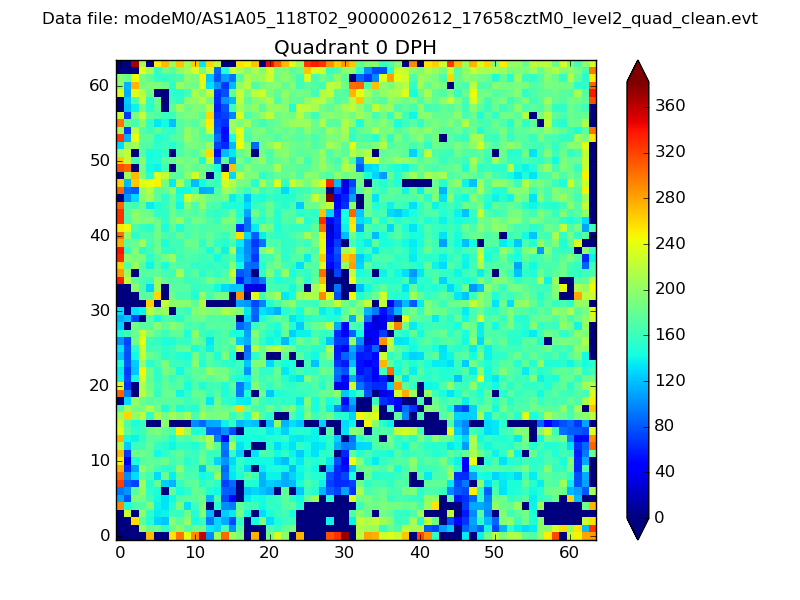 |
 |
Quadrant B |
|---|---|---|---|
| Quadrant D |  |
 |
Quadrant C |
| Plot type | Count rate plots | Images |
|---|---|---|
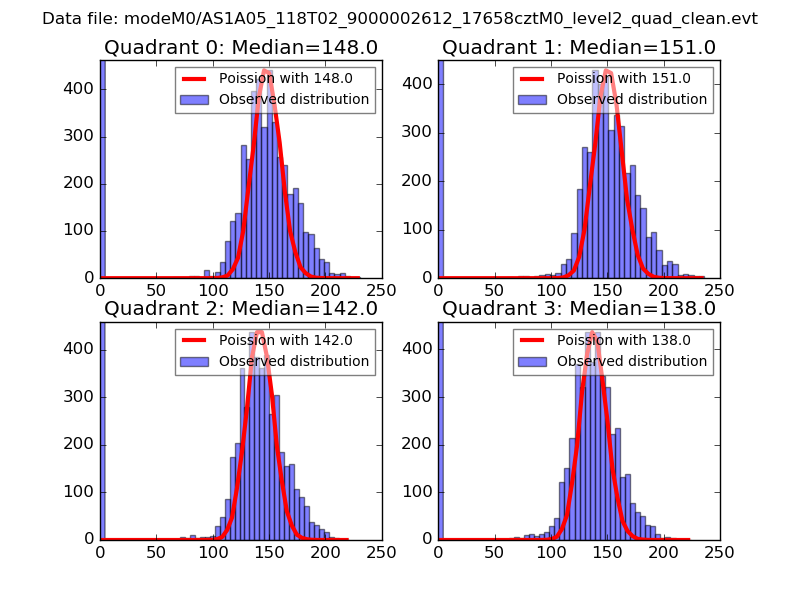
| Comparison with Poisson distribution Blue bars denote a histogram of data divided into 1 sec bins. Red curve is a Poisson curve with rate = median count rate of data. |
 |
 |
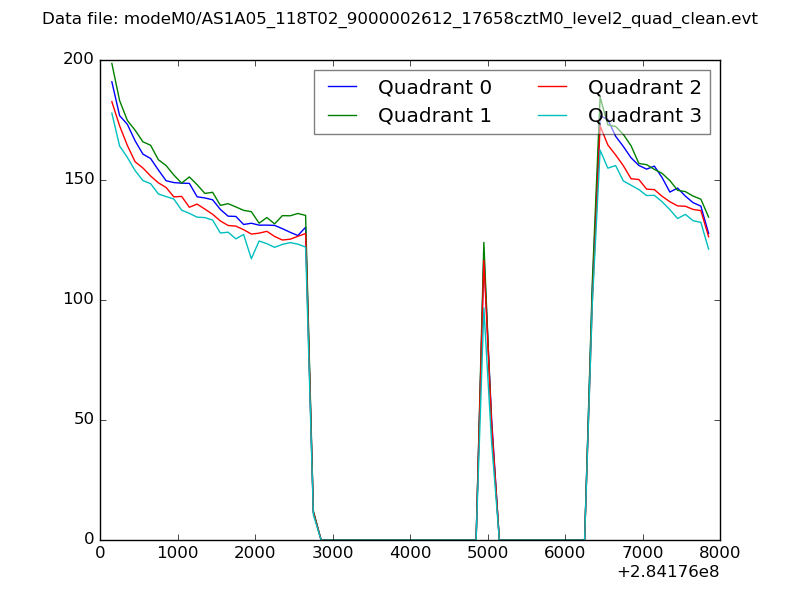
| Quadrant-wise count rates Data is divided into 100 sec bins |
 |
|
| Module-wise count rates for Quadrant A Data is divided into 100 sec bins |
 |
 |
| Module-wise count rates for Quadrant B Data is divided into 100 sec bins |
 |
 |
| Module-wise count rates for Quadrant C Data is divided into 100 sec bins |
 |
 |
| Module-wise count rates for Quadrant D Data is divided into 100 sec bins |
 |
 |
| Parameter | Plot |
|---|---|
| CZT HV Monitor |  |
| D_VDD | 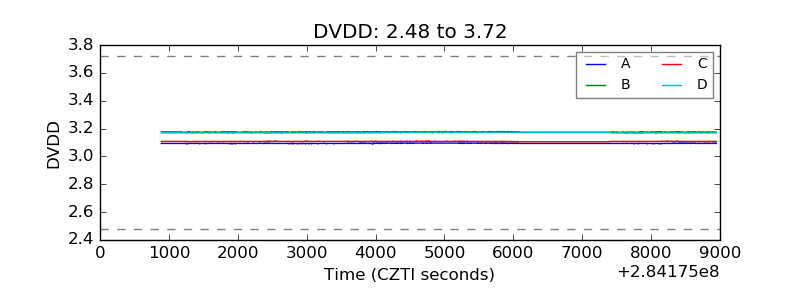 |
| Temperature 1 | 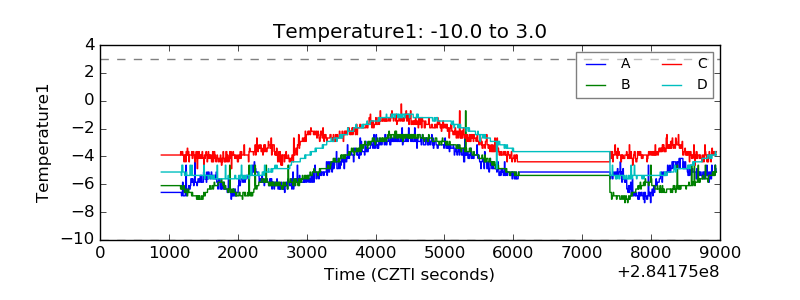 |
| Veto HV Monitor | 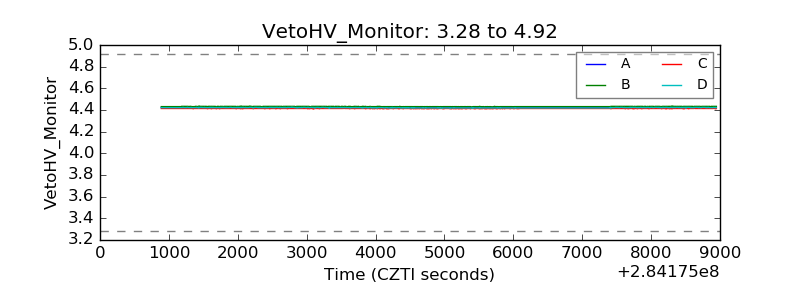 |
| Veto LLD | 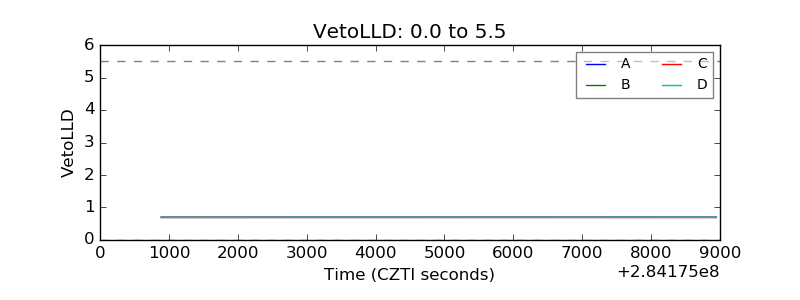 |
| Alpha Counter | 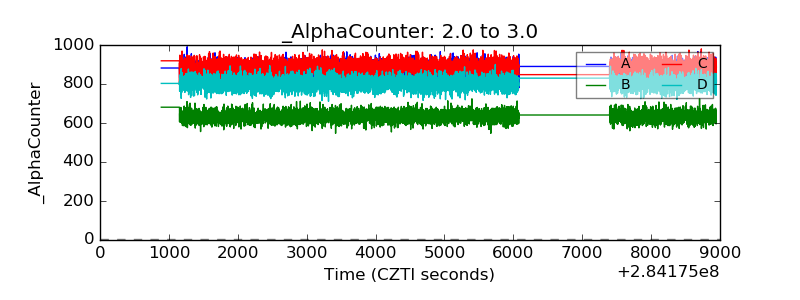 |
| _CPM_Rate | 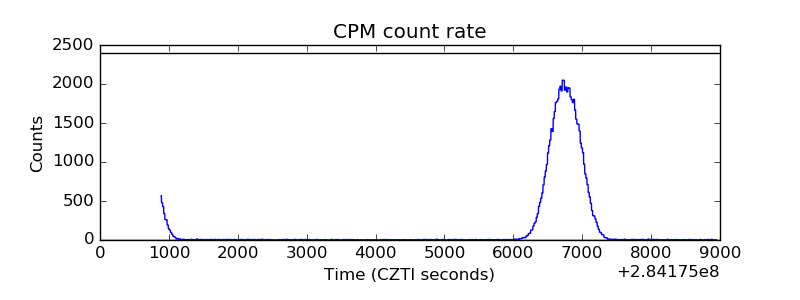 |
| CZT Counter | 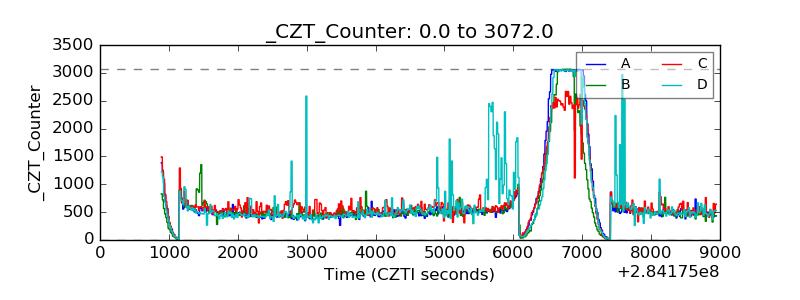 |
| +2.5 Volts monitor |  |
| +5 Volts monitor |  |
| _ROLL_ROT |  |
| _Roll_DEC | 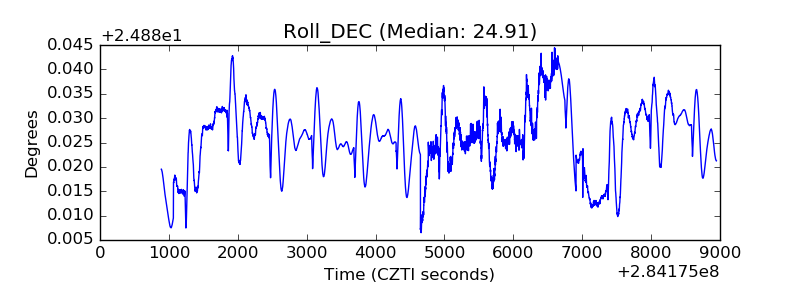 |
| _Roll_RA | 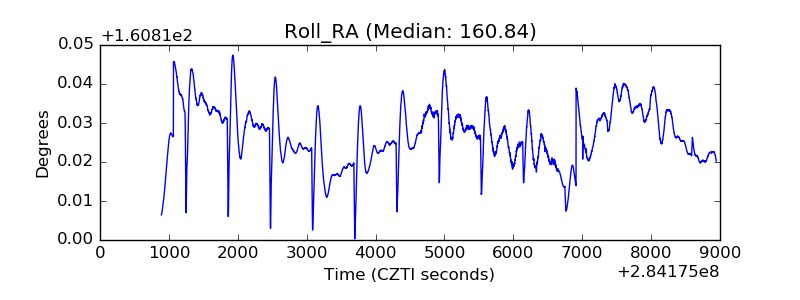 |
| Veto Counter | 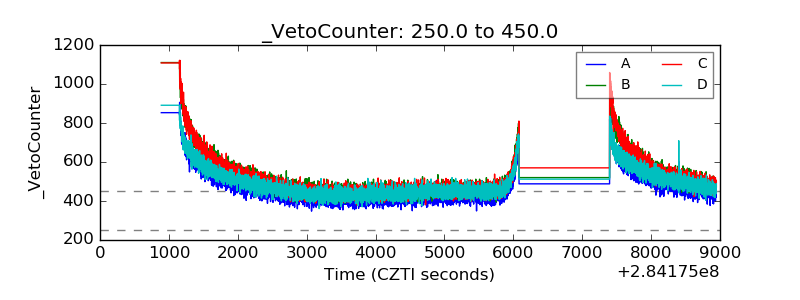 |