| Param | Original file | Final file |
|---|---|---|
| Filename | modeM0/AS1A05_118T02_9000002612_17659cztM0_level2.evt | modeM0/AS1A05_118T02_9000002612_17659cztM0_level2_quad_clean.evt |
| Size (bytes) | 530,752,320 | 94,665,600 |
| Size | 506.2 MB | 90.3 MB |
| Events in quadrant A | 3,192,087 | 623,291 |
| Events in quadrant B | 3,262,457 | 633,428 |
| Events in quadrant C | 3,669,650 | 599,759 |
| Events in quadrant D | 5,515,824 | 564,164 |
| Mode SS | |||
|---|---|---|---|
| Quadrant | BADHDUFLAG | Total packets | Discarded packets |
| A | 0 | 130 | 0 |
| B | 0 | 130 | 0 |
| C | 0 | 130 | 0 |
| D | 0 | 130 | 0 |
| Mode M0 | |||
|---|---|---|---|
| Quadrant | BADHDUFLAG | Total packets | Discarded packets |
| A | 0 | 13239 | 2 |
| B | 0 | 13486 | 2 |
| C | 0 | 14858 | 2 |
| D | 0 | 20592 | 2 |
| Mode M9 | |||
|---|---|---|---|
| Quadrant | BADHDUFLAG | Total packets | Discarded packets |
| A | 0 | 16 | 0 |
| B | 0 | 17 | 0 |
| C | 0 | 17 | 0 |
| D | 0 | 17 | 0 |
| Quadrant | Total seconds | Saturated seconds | Saturation percentage |
|---|---|---|---|
| A | 6394 | 31 | 0.484830% |
| B | 6394 | 48 | 0.750704% |
| C | 6394 | 78 | 1.219894% |
| D | 6394 | 922 | 14.419769% |
Noise dominated data is calculated using 1-second bins in cleaned event files. If a bin has >2000 counts, and if more than 50% of those come from <1% of pixels, then it is considered to be noise-dominated and hence unusable.
| Quadrant | # 1 sec bins | Bins with >0 counts | Bins with >2000 counts | High rate bins dominated by noise | Noise dominated (total time) | Noise dominated (detector-on time) | Marked lightcurve |
|---|---|---|---|---|---|---|---|
| A | 7699 | 6395 | 0 | 0 | 0.00% | 0.00% | 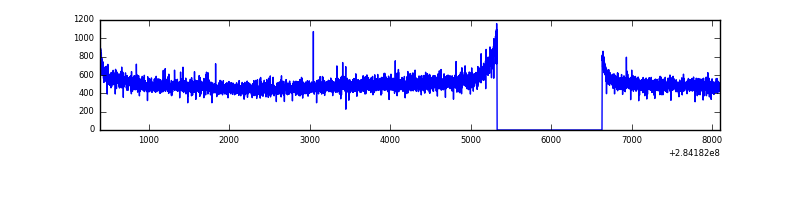 |
| B | 7699 | 6395 | 4 | 4 | 0.05% | 0.06% | 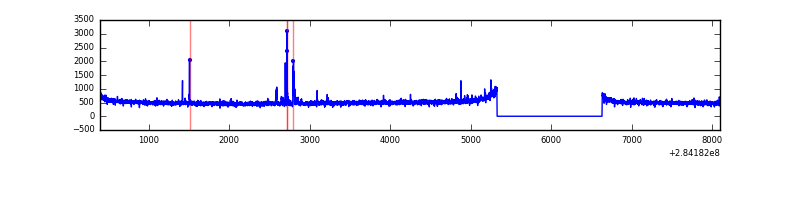 |
| C | 7699 | 6395 | 0 | 0 | 0.00% | 0.00% | 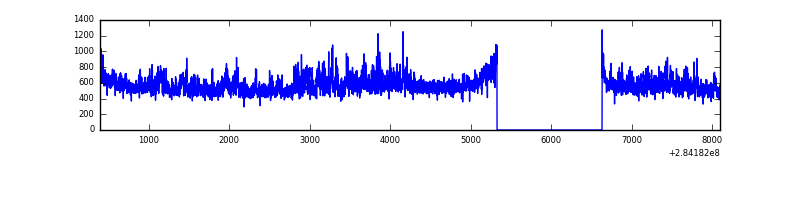 |
| D | 7699 | 6395 | 652 | 652 | 8.47% | 10.20% | 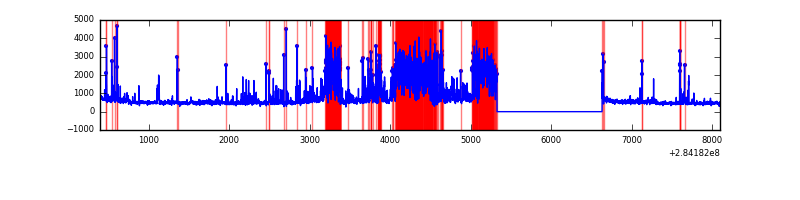 |
Top three noisy pixels from each quadrant. If the there are fewer than three noisy pixels in the level2.evt file, extra rows are filled as -1
| Pixel properties | Quadrant properties | ||||||
|---|---|---|---|---|---|---|---|
| Quadrant | DetID | PixID | Counts | Sigma | Mean | Median | Sigma |
| A | 14 | 237 | 15479 | 88.7 | 827 | 811 | 165.4 |
| A | 0 | 226 | 7404 | 39.87 | 827 | 811 | 165.4 |
| A | 12 | 194 | 6072 | 31.82 | 827 | 811 | 165.4 |
| B | 0 | 230 | 54357 | 345.19 | 818 | 798 | 155.2 |
| B | 12 | 111 | 17728 | 109.11 | 818 | 798 | 155.2 |
| B | 11 | 111 | 15774 | 96.52 | 818 | 798 | 155.2 |
| C | 3 | 233 | 489773 | 2698.05 | 782 | 789 | 181.2 |
| C | 14 | 238 | 123837 | 678.94 | 782 | 789 | 181.2 |
| C | 13 | 61 | 5465 | 25.8 | 782 | 789 | 181.2 |
| D | 1 | 52 | 1918799 | 10844.16 | 732 | 712 | 176.9 |
| D | 7 | 238 | 745775 | 4212.31 | 732 | 712 | 176.9 |
| D | 13 | 189 | 54988 | 306.86 | 732 | 712 | 176.9 |
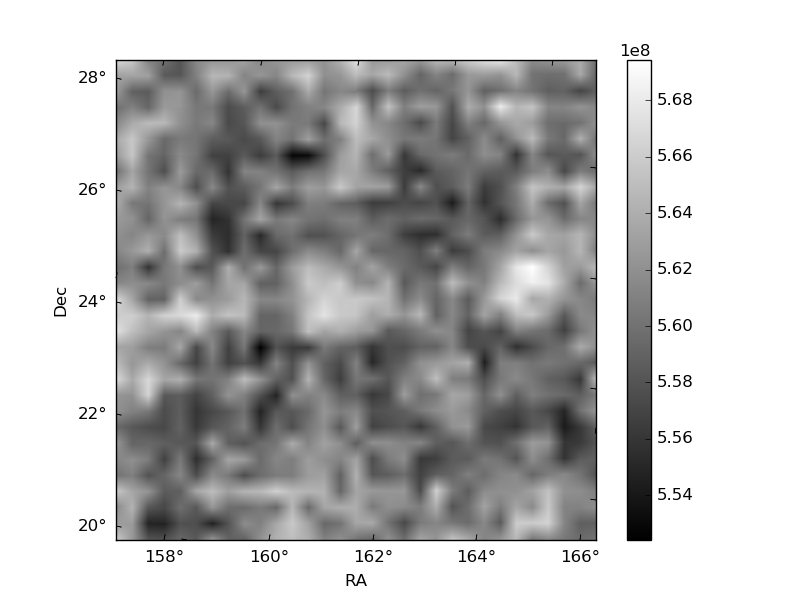
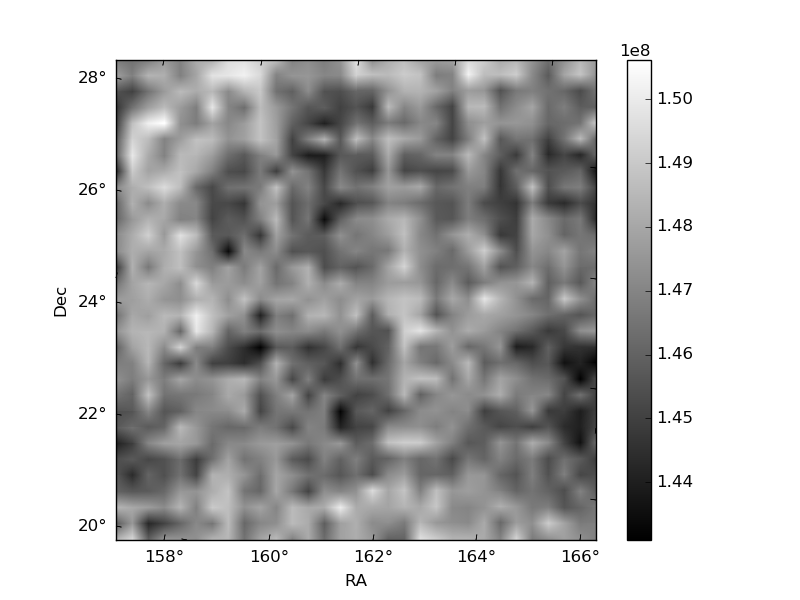
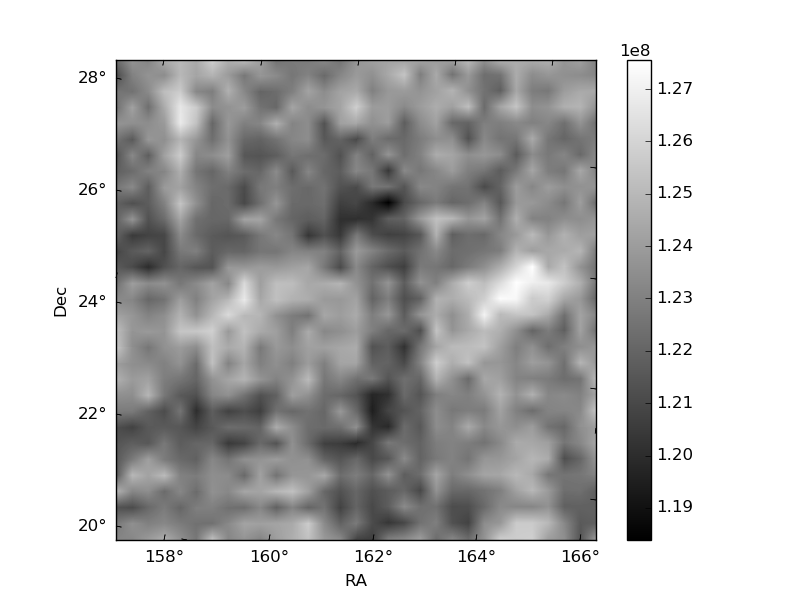
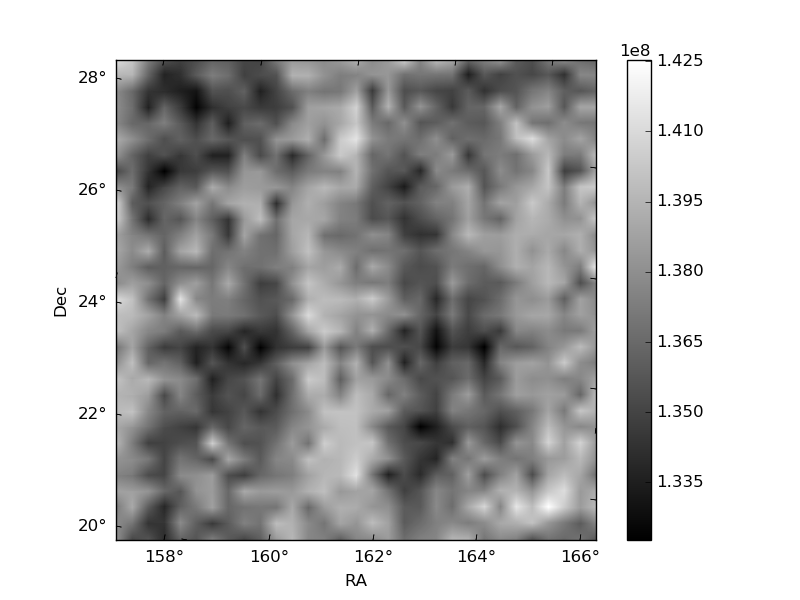
Histogram calculated using DETX and DETY for each event in the final _common_clean file
| Quadrant A | 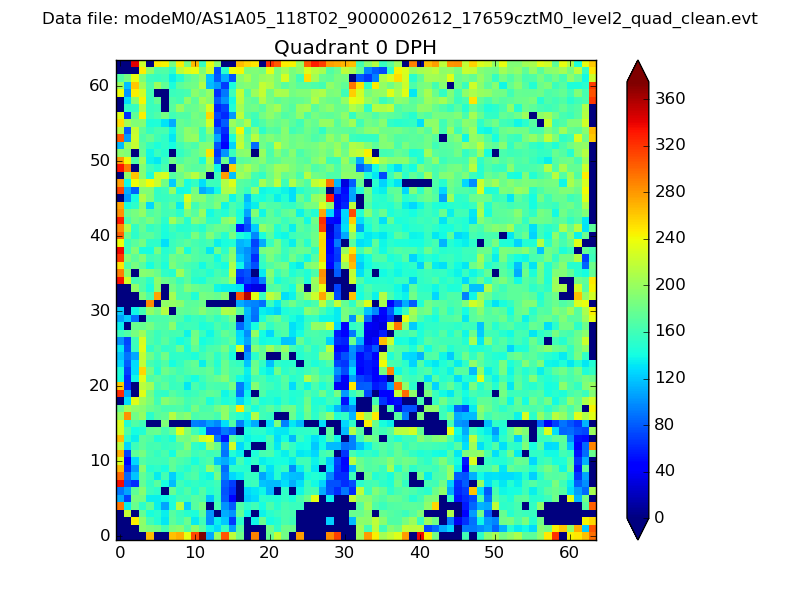 |
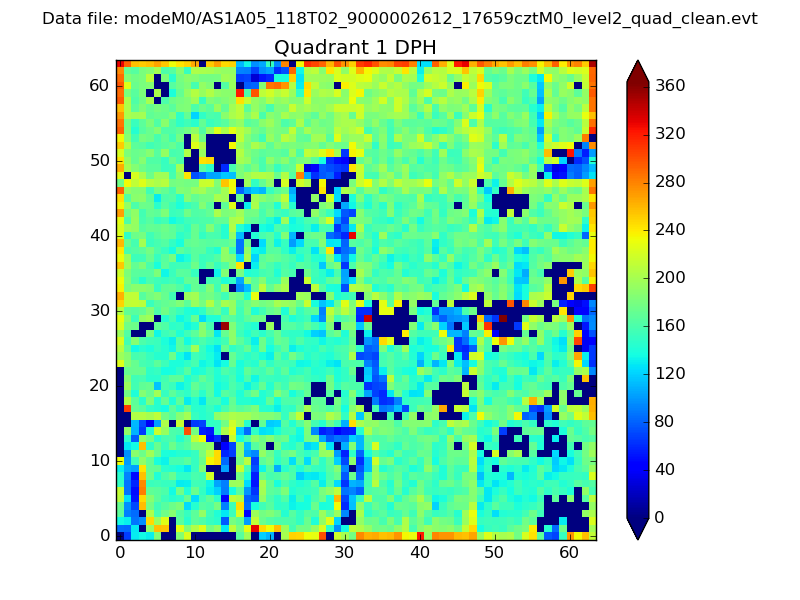 |
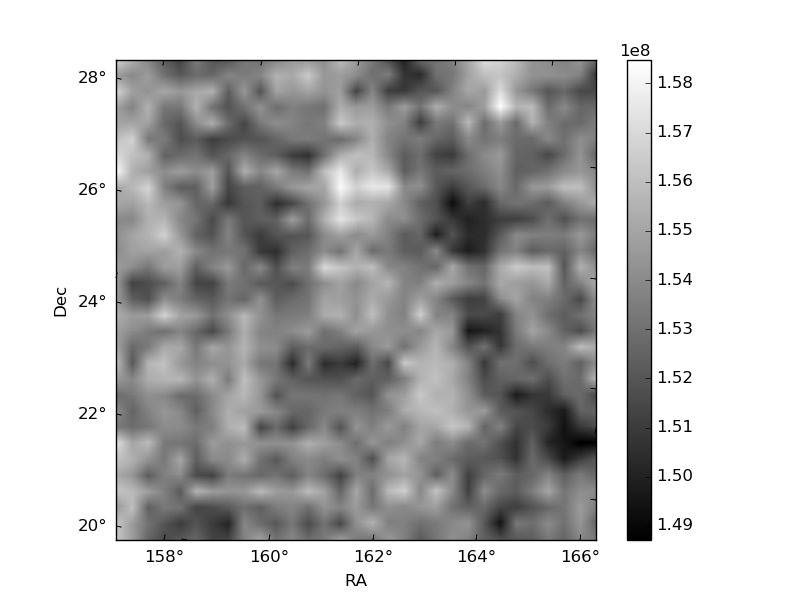
Quadrant B |
|---|---|---|---|
| Quadrant D | 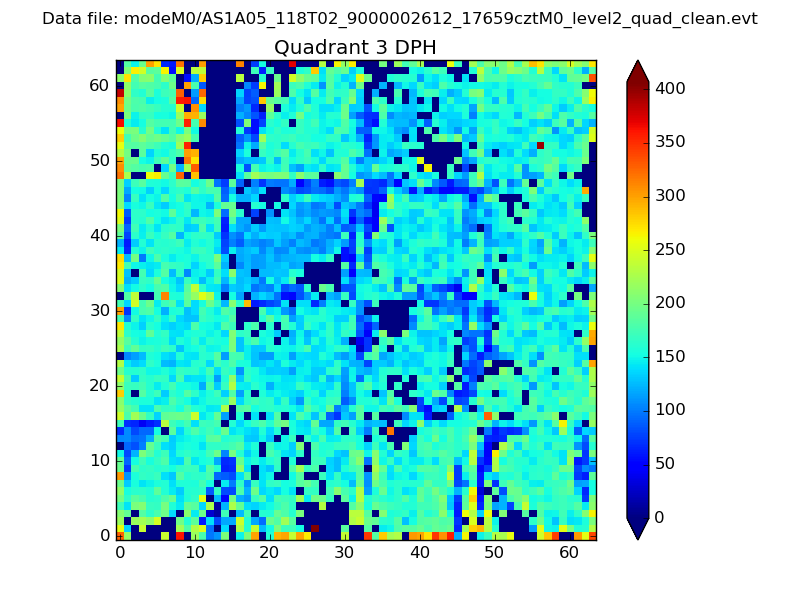 |
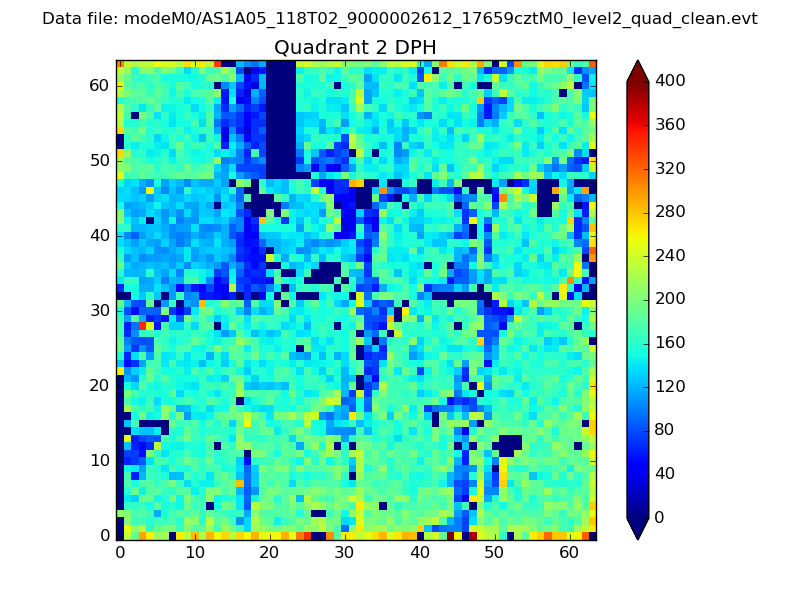 |
Quadrant C |
| Plot type | Count rate plots | Images |
|---|---|---|
| Comparison with Poisson distribution Blue bars denote a histogram of data divided into 1 sec bins. Red curve is a Poisson curve with rate = median count rate of data. |
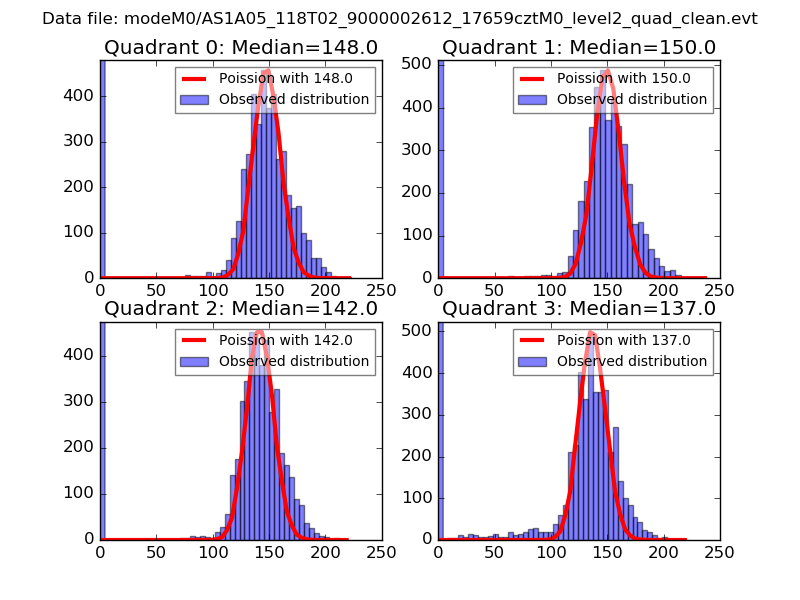 |
 |
| Quadrant-wise count rates Data is divided into 100 sec bins |
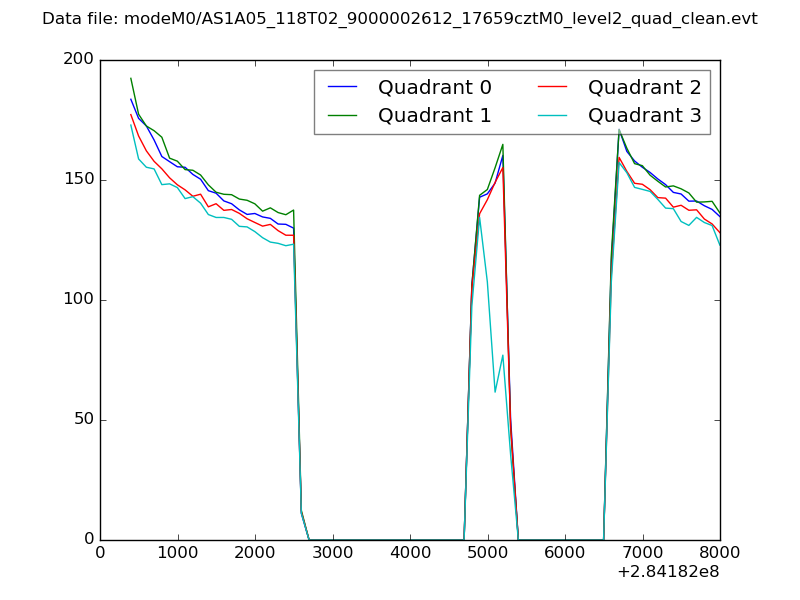 |
|
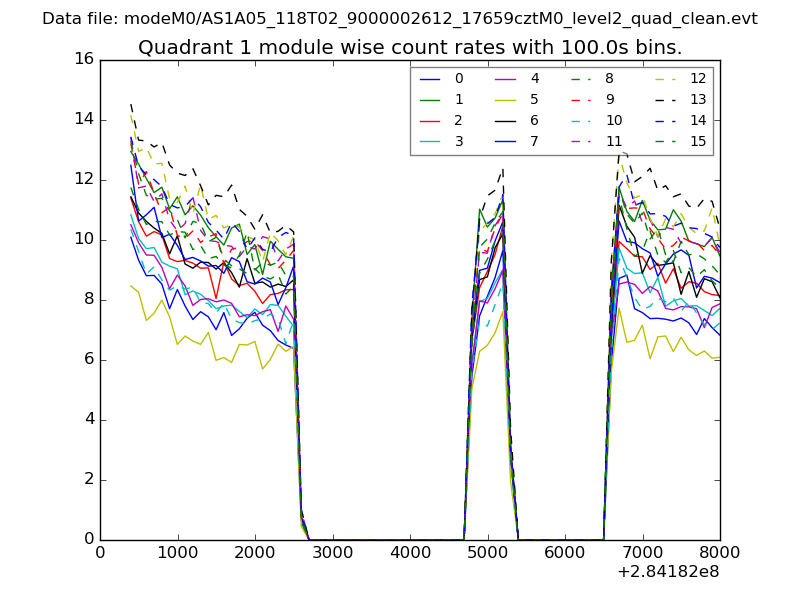
| Module-wise count rates for Quadrant A Data is divided into 100 sec bins |
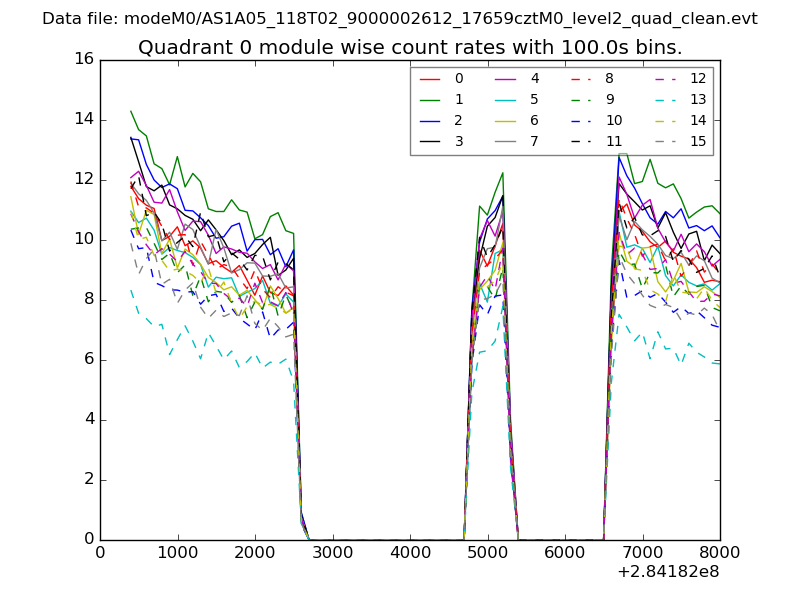 |
 |
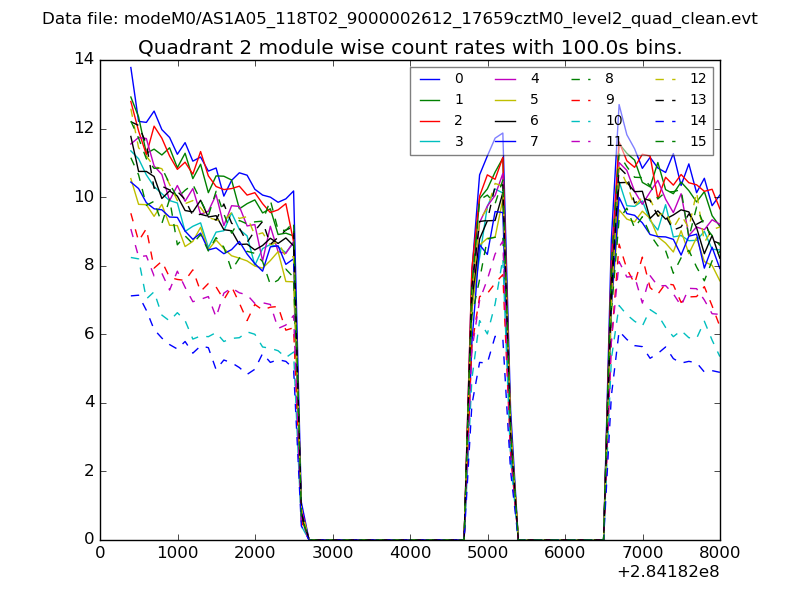
| Module-wise count rates for Quadrant B Data is divided into 100 sec bins |
 |
 |
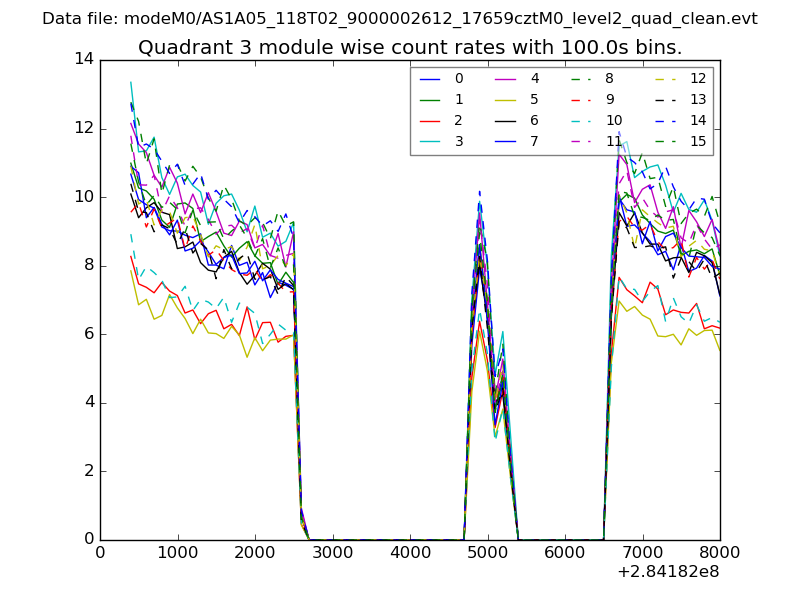
| Module-wise count rates for Quadrant C Data is divided into 100 sec bins |
 |
 |
| Module-wise count rates for Quadrant D Data is divided into 100 sec bins |
 |
 |
| Parameter | Plot |
|---|---|
| CZT HV Monitor | 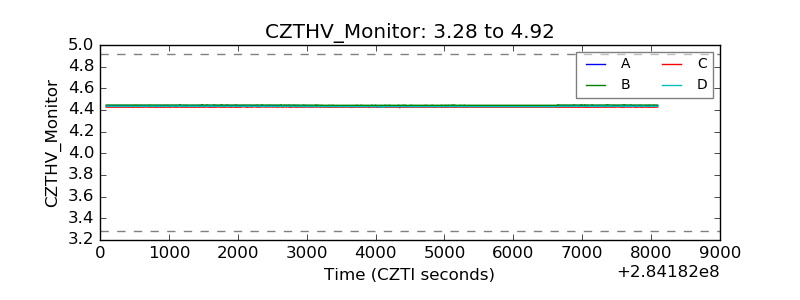 |
| D_VDD | 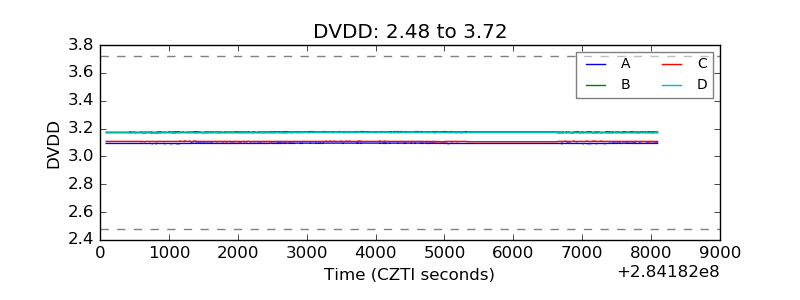 |
| Temperature 1 | 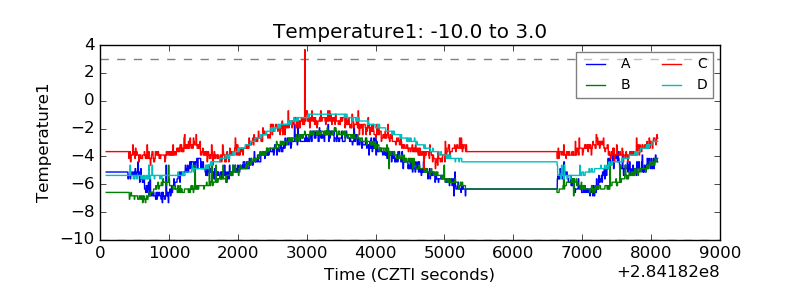 |
| Veto HV Monitor | 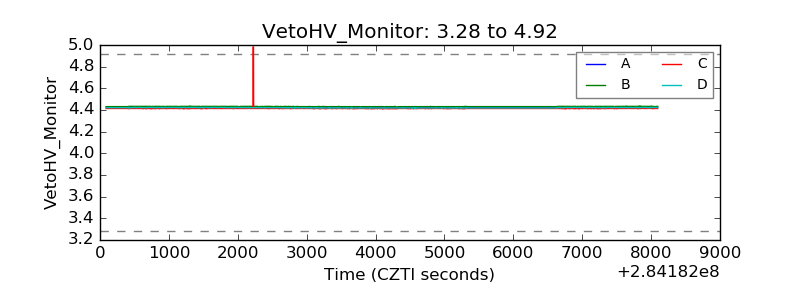 |
| Veto LLD | 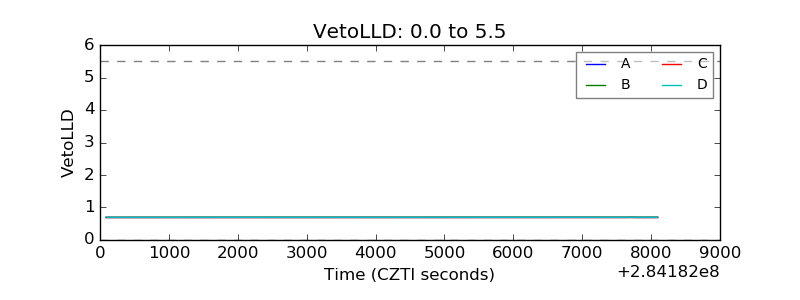 |
| Alpha Counter | 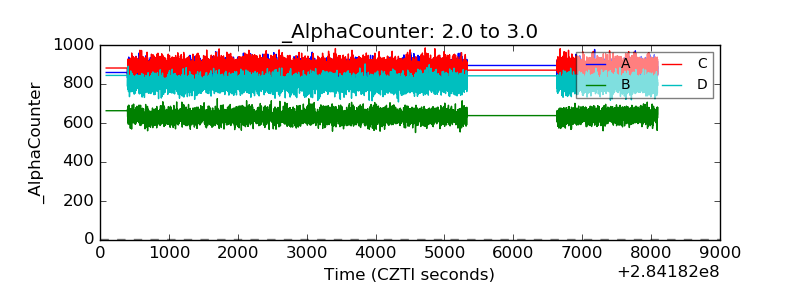 |
| _CPM_Rate | 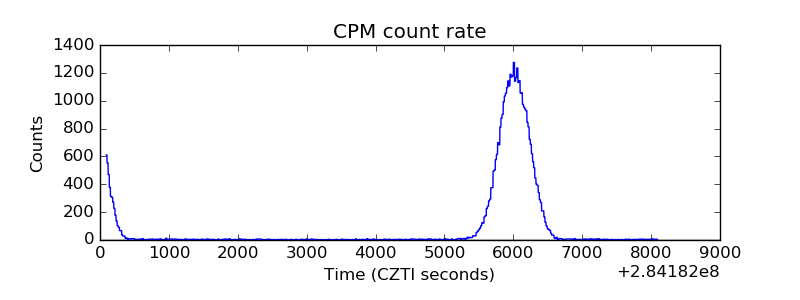 |
| CZT Counter | 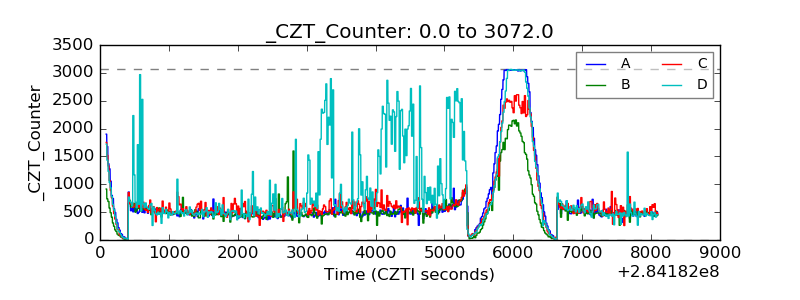 |
| +2.5 Volts monitor |  |
| +5 Volts monitor | 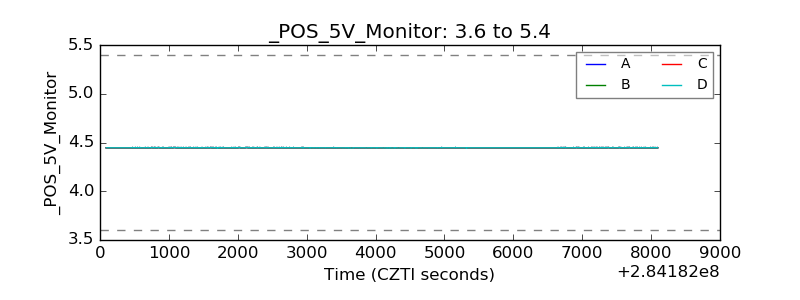 |
| _ROLL_ROT | 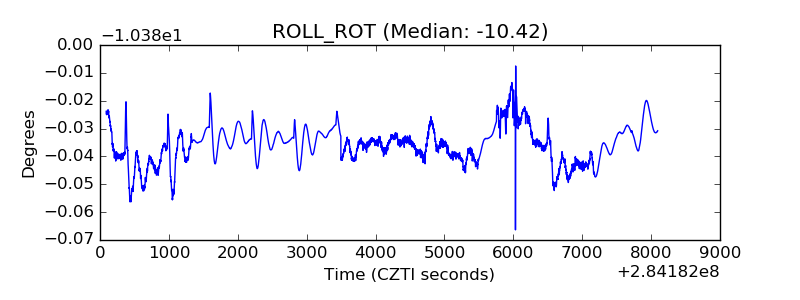 |
| _Roll_DEC | 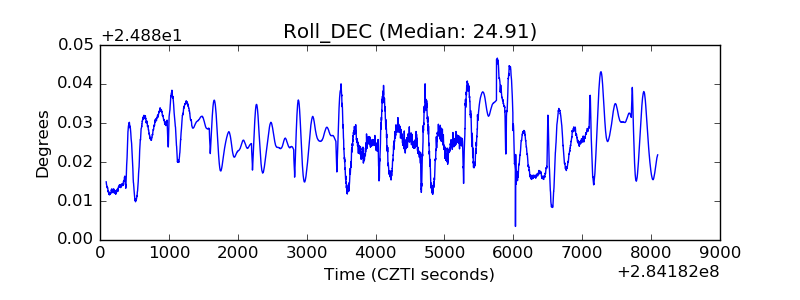 |
| _Roll_RA | 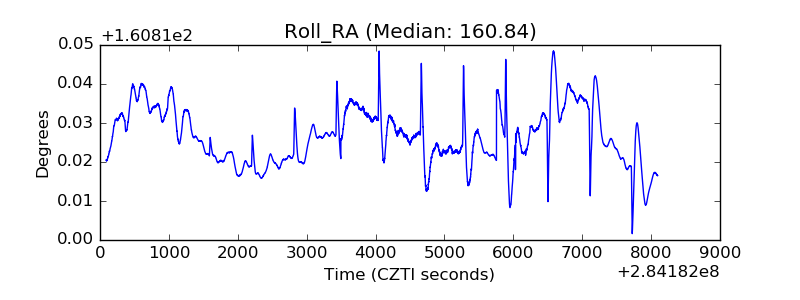 |
| Veto Counter | 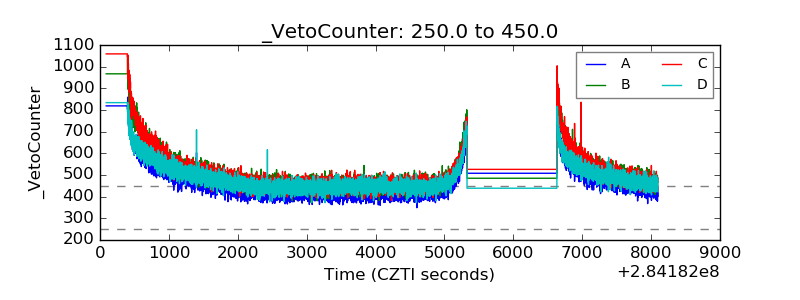 |