| Param | Original file | Final file |
|---|---|---|
| Filename | modeM0/AS1A05_118T02_9000002612_17661cztM0_level2.evt | modeM0/AS1A05_118T02_9000002612_17661cztM0_level2_quad_clean.evt |
| Size (bytes) | 312,122,880 | 51,543,360 |
| Size | 297.7 MB | 49.2 MB |
| Events in quadrant A | 2,142,994 | 315,942 |
| Events in quadrant B | 2,263,302 | 319,749 |
| Events in quadrant C | 2,292,147 | 304,672 |
| Events in quadrant D | 2,444,068 | 300,386 |
| Mode SS | |||
|---|---|---|---|
| Quadrant | BADHDUFLAG | Total packets | Discarded packets |
| A | 0 | 92 | 0 |
| B | 0 | 92 | 0 |
| C | 0 | 92 | 0 |
| D | 0 | 92 | 0 |
| Mode M0 | |||
|---|---|---|---|
| Quadrant | BADHDUFLAG | Total packets | Discarded packets |
| A | 0 | 9183 | 1 |
| B | 0 | 9474 | 1 |
| C | 0 | 9378 | 1 |
| D | 0 | 10178 | 1 |
| Mode M9 | |||
|---|---|---|---|
| Quadrant | BADHDUFLAG | Total packets | Discarded packets |
| A | 0 | 1 | 0 |
| B | 0 | 2 | 0 |
| C | 0 | 2 | 0 |
| D | 0 | 2 | 0 |
| Quadrant | Total seconds | Saturated seconds | Saturation percentage |
|---|---|---|---|
| A | 4543 | 8 | 0.176095% |
| B | 4543 | 20 | 0.440238% |
| C | 4543 | 25 | 0.550297% |
| D | 4543 | 33 | 0.726392% |
Noise dominated data is calculated using 1-second bins in cleaned event files. If a bin has >2000 counts, and if more than 50% of those come from <1% of pixels, then it is considered to be noise-dominated and hence unusable.
| Quadrant | # 1 sec bins | Bins with >0 counts | Bins with >2000 counts | High rate bins dominated by noise | Noise dominated (total time) | Noise dominated (detector-on time) | Marked lightcurve |
|---|---|---|---|---|---|---|---|
| A | 4543 | 4543 | 0 | 0 | 0.00% | 0.00% | 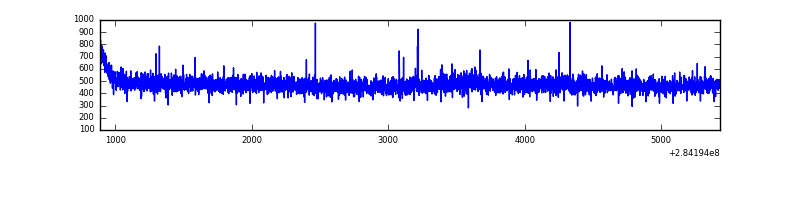 |
| B | 4543 | 4543 | 10 | 10 | 0.22% | 0.22% | 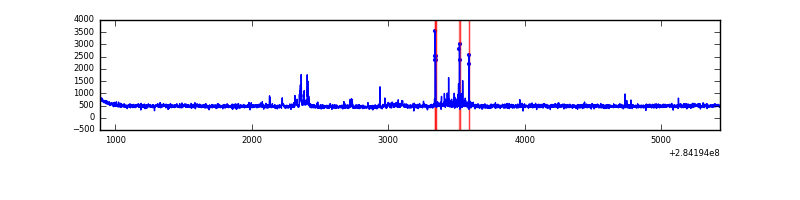 |
| C | 4543 | 4543 | 0 | 0 | 0.00% | 0.00% | 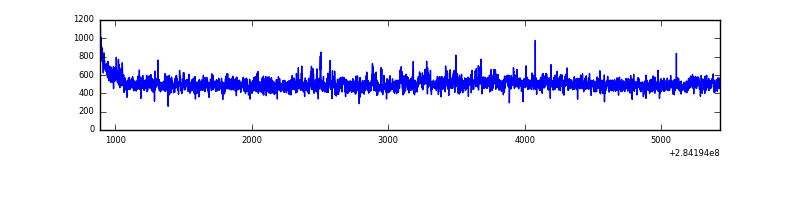 |
| D | 4543 | 4543 | 22 | 22 | 0.48% | 0.48% | 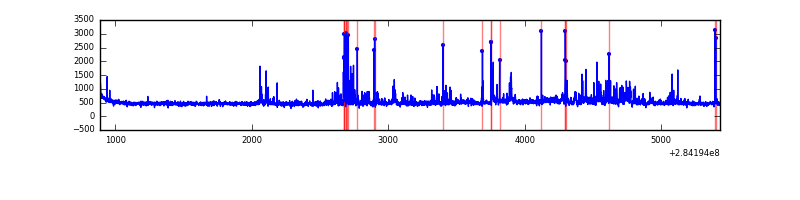 |
Top three noisy pixels from each quadrant. If the there are fewer than three noisy pixels in the level2.evt file, extra rows are filled as -1
| Pixel properties | Quadrant properties | ||||||
|---|---|---|---|---|---|---|---|
| Quadrant | DetID | PixID | Counts | Sigma | Mean | Median | Sigma |
| A | 14 | 237 | 17285 | 148.53 | 553 | 543 | 112.7 |
| A | 0 | 226 | 4937 | 38.98 | 553 | 543 | 112.7 |
| A | 12 | 194 | 4121 | 31.74 | 553 | 543 | 112.7 |
| B | 7 | 220 | 56741 | 537.8 | 545 | 532 | 104.5 |
| B | 0 | 230 | 32198 | 302.98 | 545 | 532 | 104.5 |
| B | 0 | 189 | 13169 | 120.91 | 545 | 532 | 104.5 |
| C | 3 | 233 | 156532 | 1260.46 | 526 | 530 | 123.8 |
| C | 14 | 238 | 81966 | 657.98 | 526 | 530 | 123.8 |
| C | 13 | 61 | 3854 | 26.86 | 526 | 530 | 123.8 |
| D | 1 | 52 | 189452 | 1427.83 | 536 | 520 | 132.3 |
| D | 13 | 189 | 154951 | 1167.1 | 536 | 520 | 132.3 |
| D | 10 | 70 | 27143 | 201.2 | 536 | 520 | 132.3 |
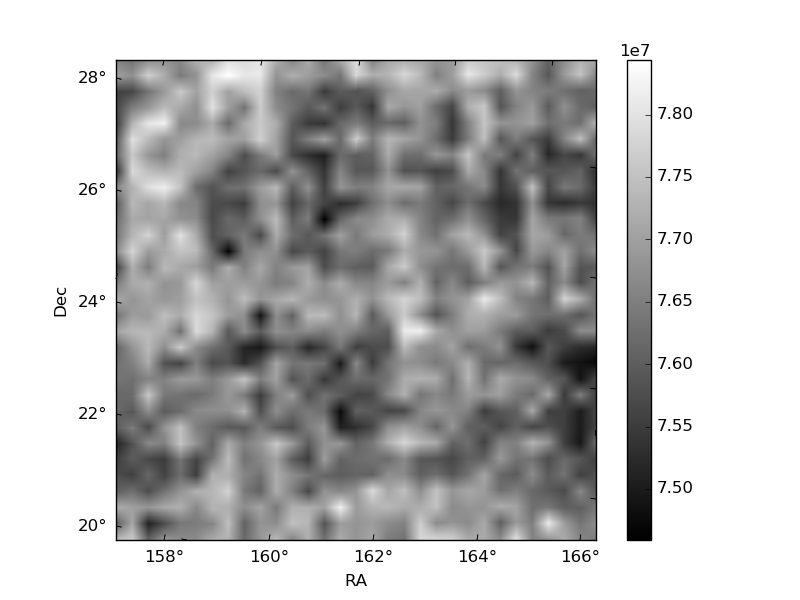
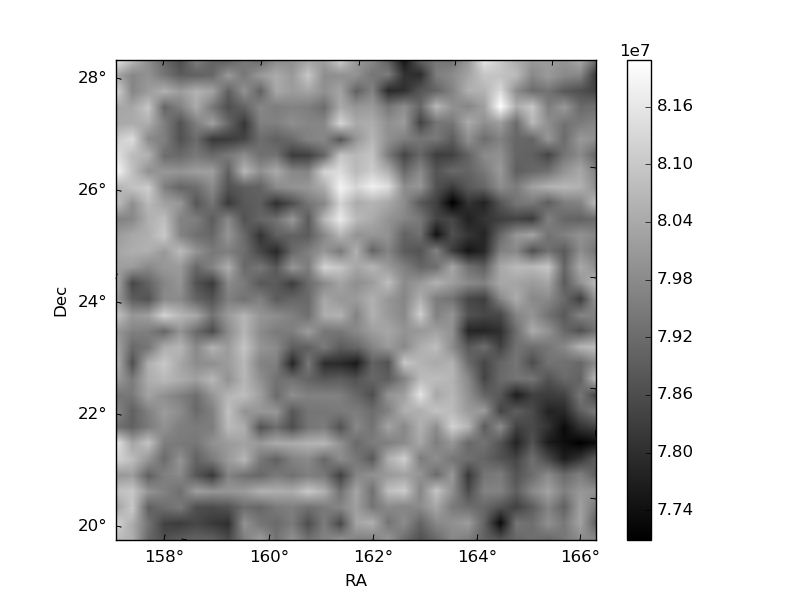
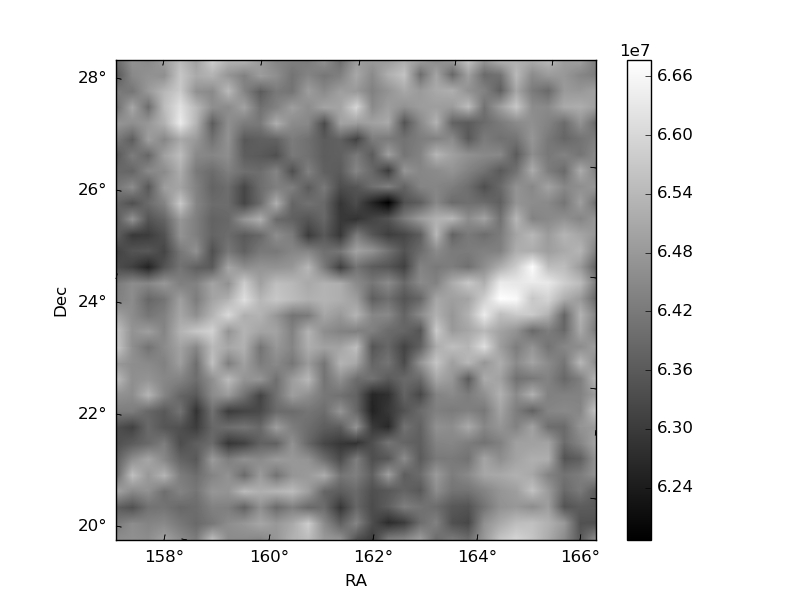
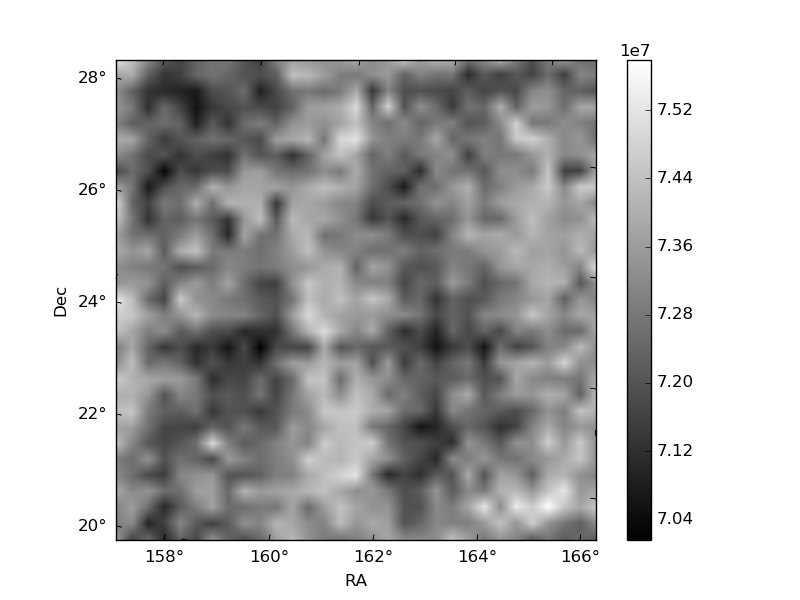
Histogram calculated using DETX and DETY for each event in the final _common_clean file
| Quadrant A | 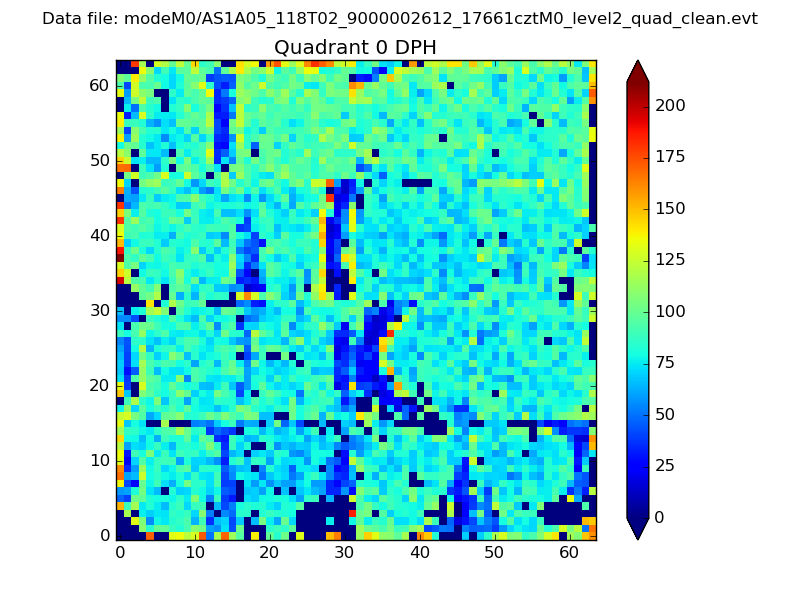 |
 |
Quadrant B |
|---|---|---|---|
| Quadrant D | 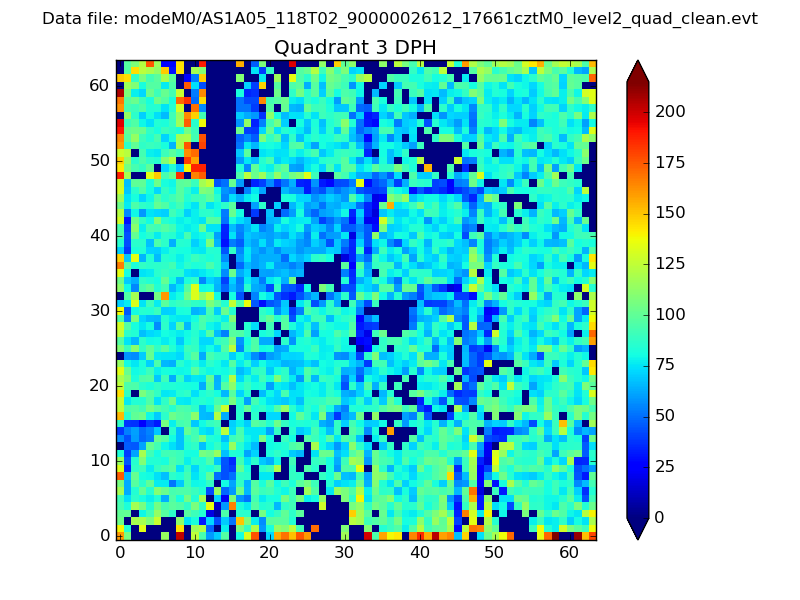 |
 |
Quadrant C |
| Plot type | Count rate plots | Images |
|---|---|---|
| Comparison with Poisson distribution Blue bars denote a histogram of data divided into 1 sec bins. Red curve is a Poisson curve with rate = median count rate of data. |
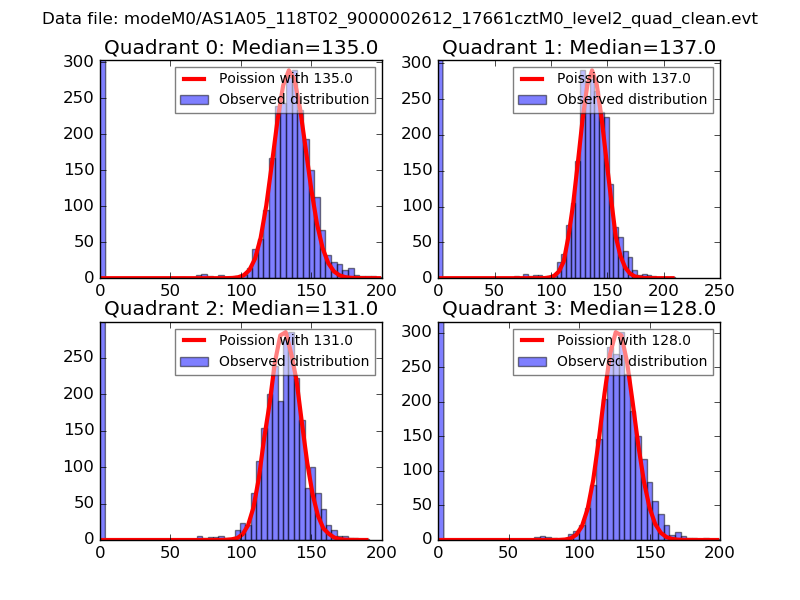 |
 |
| Quadrant-wise count rates Data is divided into 100 sec bins |
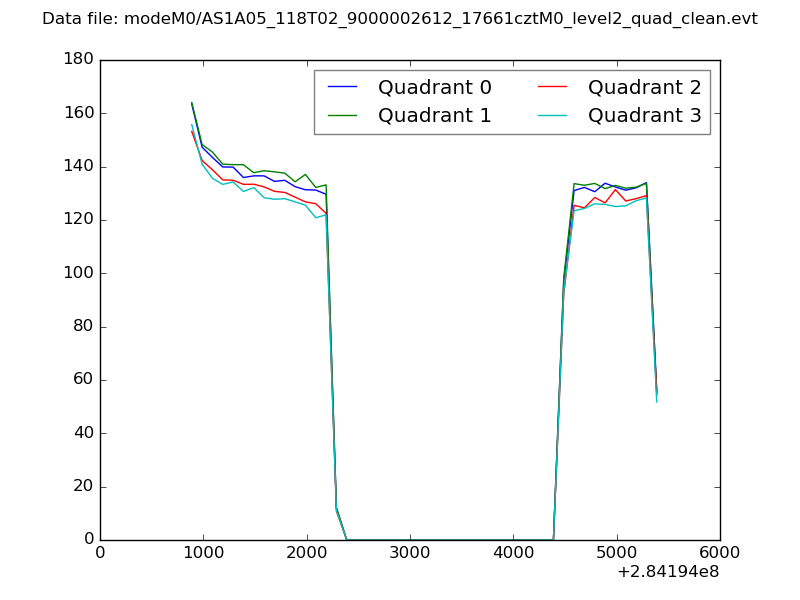 |
|
| Module-wise count rates for Quadrant A Data is divided into 100 sec bins |
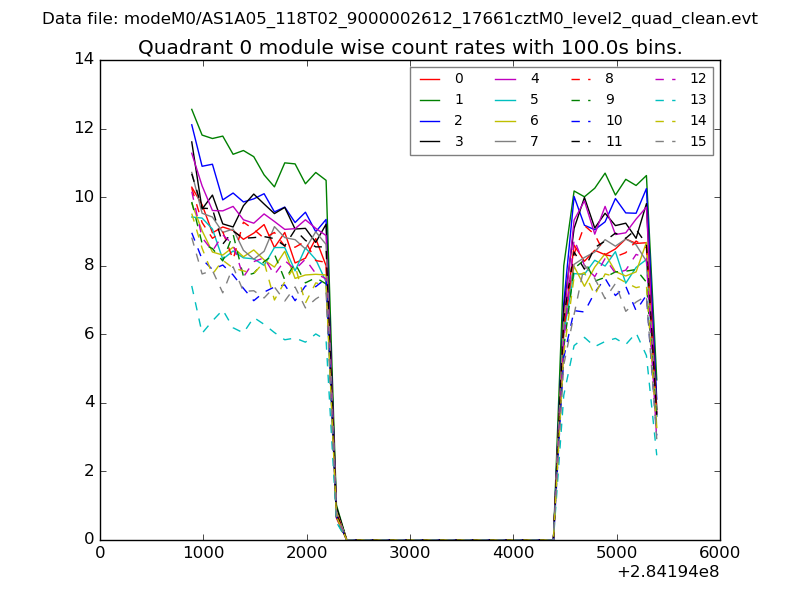 |
 |
| Module-wise count rates for Quadrant B Data is divided into 100 sec bins |
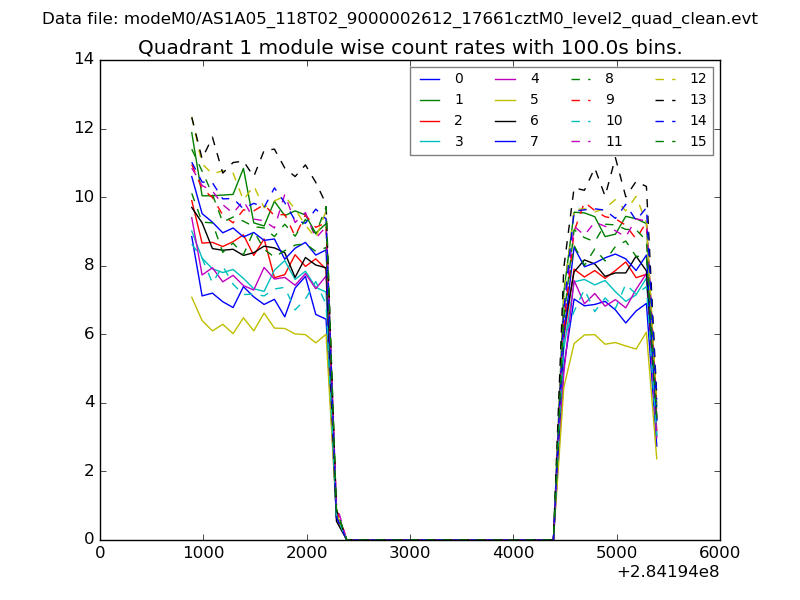 |
 |
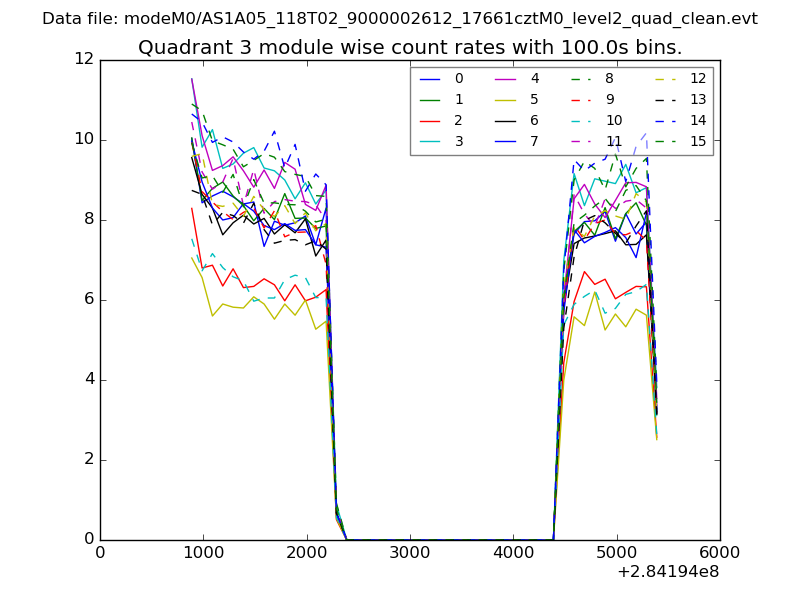
| Module-wise count rates for Quadrant C Data is divided into 100 sec bins |
 |
 |
| Module-wise count rates for Quadrant D Data is divided into 100 sec bins |
 |
 |
| Parameter | Plot |
|---|---|
| CZT HV Monitor | 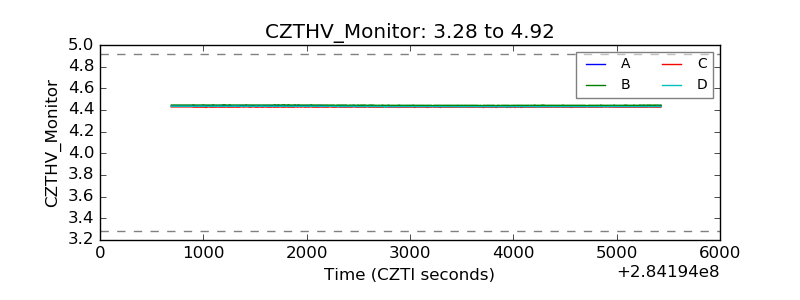 |
| D_VDD | 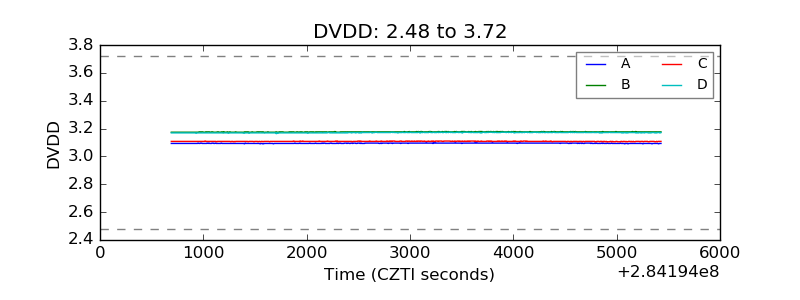 |
| Temperature 1 |  |
| Veto HV Monitor | 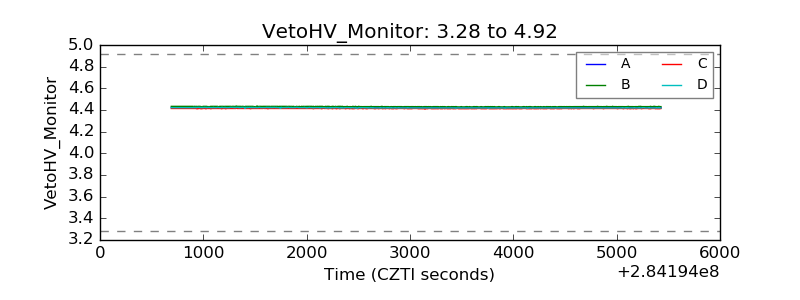 |
| Veto LLD | 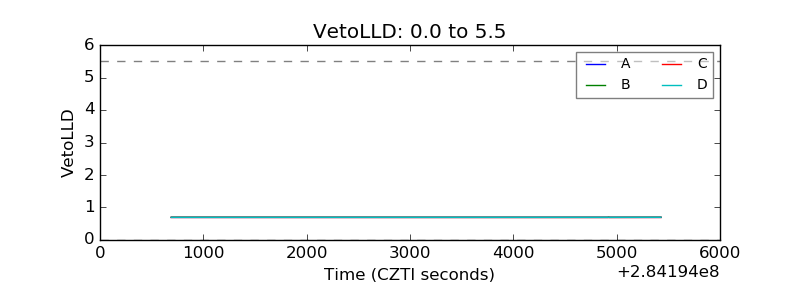 |
| Alpha Counter |  |
| _CPM_Rate | 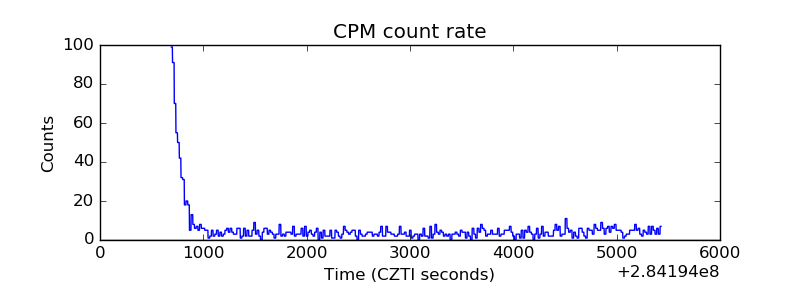 |
| CZT Counter |  |
| +2.5 Volts monitor | 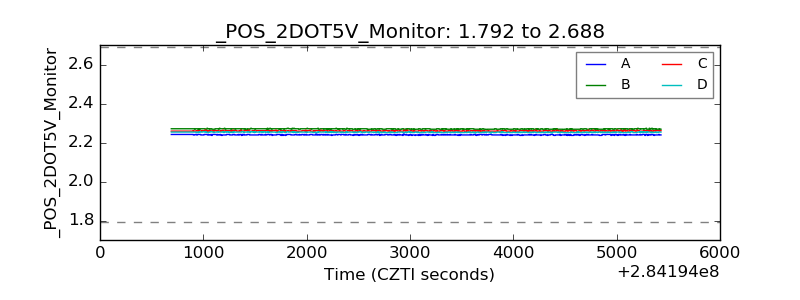 |
| +5 Volts monitor |  |
| _ROLL_ROT | 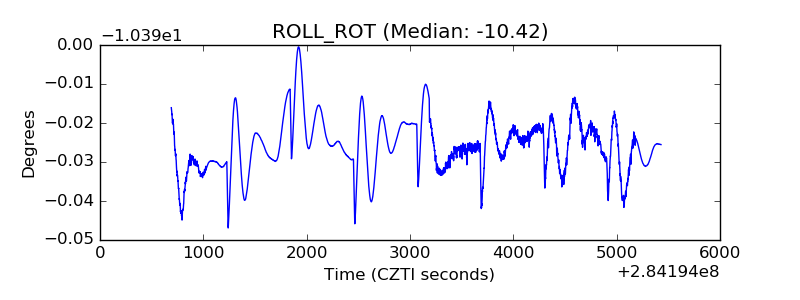 |
| _Roll_DEC | 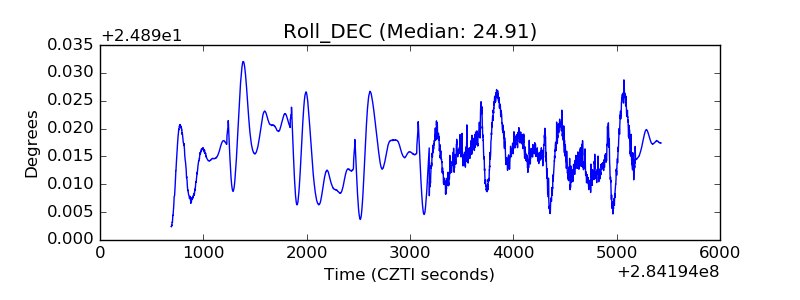 |
| _Roll_RA |  |
| Veto Counter | 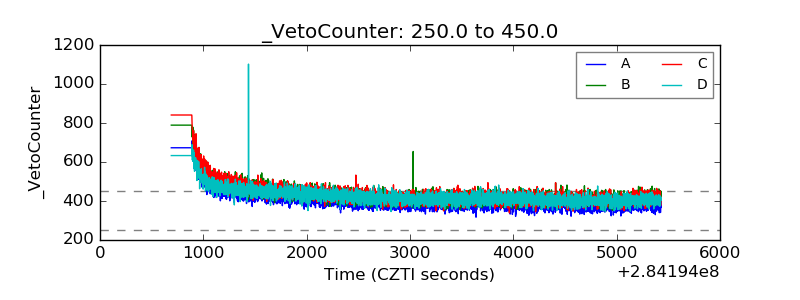 |