| Param | Original file | Final file |
|---|---|---|
| Filename | modeM0/AS1A05_208T01_9000002614_17661cztM0_level2.evt | modeM0/AS1A05_208T01_9000002614_17661cztM0_level2_quad_clean.evt |
| Size (bytes) | 112,049,280 | 28,992,960 |
| Size | 106.9 MB | 27.6 MB |
| Events in quadrant A | 765,061 | 192,745 |
| Events in quadrant B | 759,424 | 198,470 |
| Events in quadrant C | 900,438 | 189,112 |
| Events in quadrant D | 864,687 | 187,018 |
| Mode M9 | |||
|---|---|---|---|
| Quadrant | BADHDUFLAG | Total packets | Discarded packets |
| A | 0 | 9 | 0 |
| B | 0 | 9 | 0 |
| C | 0 | 9 | 0 |
| D | 0 | 9 | 0 |
| Mode M0 | |||
|---|---|---|---|
| Quadrant | BADHDUFLAG | Total packets | Discarded packets |
| A | 0 | 3234 | 1 |
| B | 0 | 3210 | 1 |
| C | 0 | 3606 | 1 |
| D | 0 | 3565 | 1 |
| Mode SS | |||
|---|---|---|---|
| Quadrant | BADHDUFLAG | Total packets | Discarded packets |
| A | 0 | 30 | 0 |
| B | 0 | 30 | 0 |
| C | 0 | 30 | 0 |
| D | 0 | 30 | 0 |
| Quadrant | Total seconds | Saturated seconds | Saturation percentage |
|---|---|---|---|
| A | 1493 | 63 | 4.219692% |
| B | 1493 | 60 | 4.018754% |
| C | 1493 | 78 | 5.224380% |
| D | 1493 | 61 | 4.085733% |
Noise dominated data is calculated using 1-second bins in cleaned event files. If a bin has >2000 counts, and if more than 50% of those come from <1% of pixels, then it is considered to be noise-dominated and hence unusable.
| Quadrant | # 1 sec bins | Bins with >0 counts | Bins with >2000 counts | High rate bins dominated by noise | Noise dominated (total time) | Noise dominated (detector-on time) | Marked lightcurve |
|---|---|---|---|---|---|---|---|
| A | 2383 | 1493 | 0 | 0 | 0.00% | 0.00% | 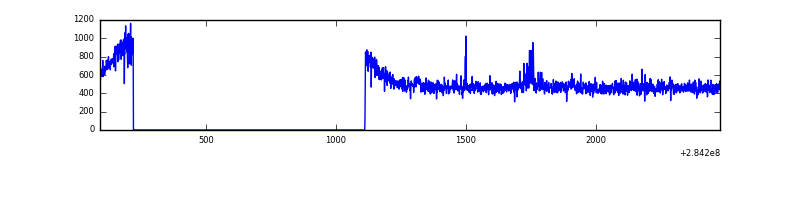 |
| B | 2383 | 1494 | 0 | 0 | 0.00% | 0.00% | 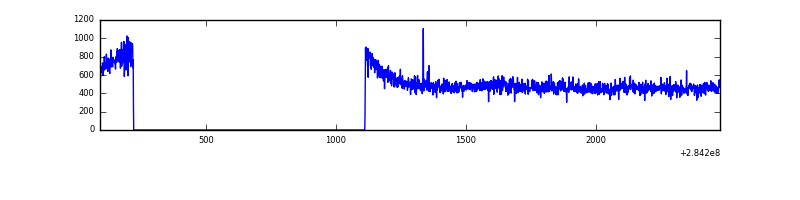 |
| C | 2383 | 1494 | 0 | 0 | 0.00% | 0.00% | 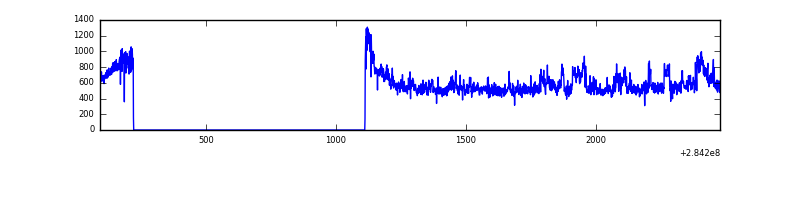 |
| D | 2383 | 1493 | 19 | 19 | 0.80% | 1.27% | 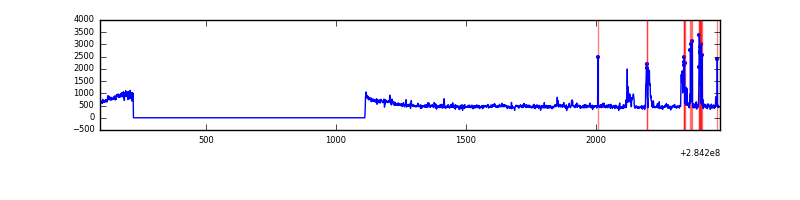 |
Top three noisy pixels from each quadrant. If the there are fewer than three noisy pixels in the level2.evt file, extra rows are filled as -1
| Pixel properties | Quadrant properties | ||||||
|---|---|---|---|---|---|---|---|
| Quadrant | DetID | PixID | Counts | Sigma | Mean | Median | Sigma |
| A | 14 | 237 | 21155 | 508.27 | 192 | 188 | 41.3 |
| A | 15 | 174 | 3784 | 87.17 | 192 | 188 | 41.3 |
| A | 0 | 226 | 1726 | 37.28 | 192 | 188 | 41.3 |
| B | 0 | 219 | 7765 | 191.73 | 191 | 186 | 39.5 |
| B | 12 | 111 | 4643 | 112.75 | 191 | 186 | 39.5 |
| B | 11 | 111 | 4105 | 99.14 | 191 | 186 | 39.5 |
| C | 3 | 233 | 143716 | 3105.77 | 186 | 187 | 46.2 |
| C | 14 | 238 | 28124 | 604.52 | 186 | 187 | 46.2 |
| C | 13 | 61 | 1281 | 23.67 | 186 | 187 | 46.2 |
| D | 1 | 52 | 135207 | 2827.09 | 189 | 184 | 47.8 |
| D | 13 | 189 | 7328 | 149.58 | 189 | 184 | 47.8 |
| D | 2 | 234 | 4781 | 96.25 | 189 | 184 | 47.8 |
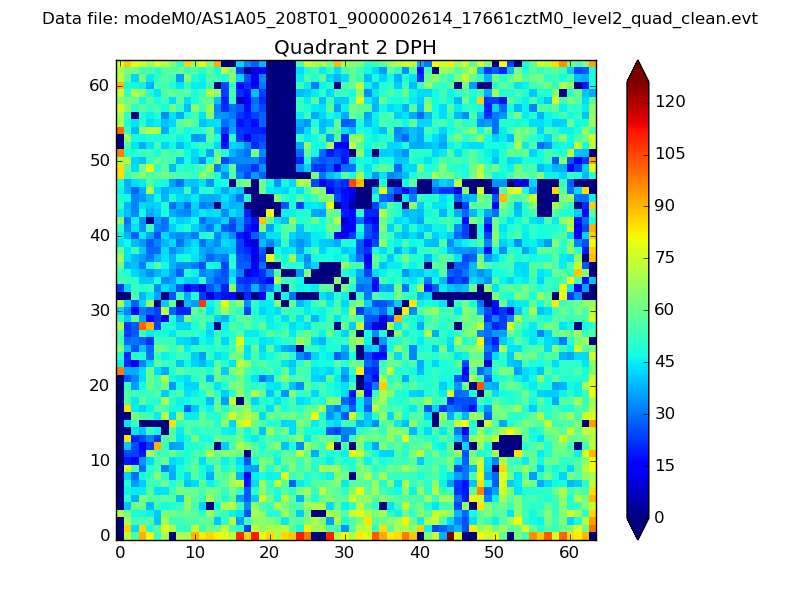
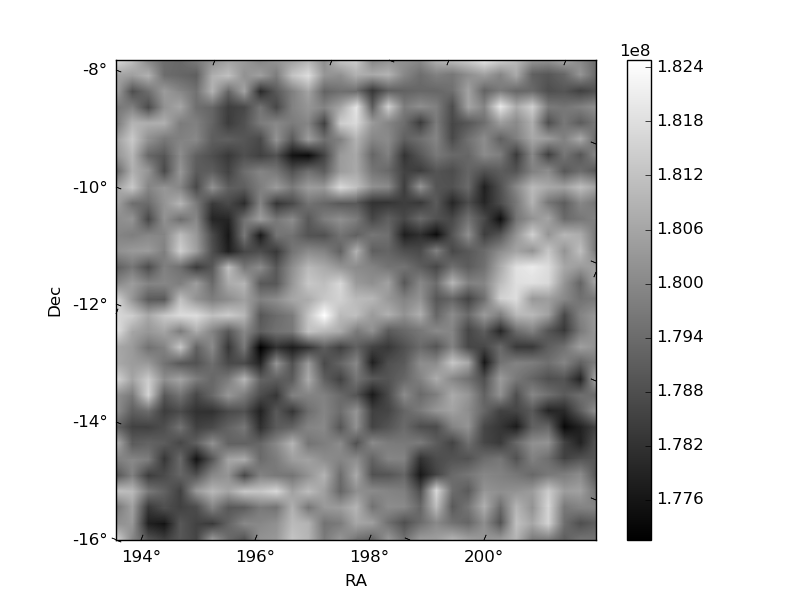
Histogram calculated using DETX and DETY for each event in the final _common_clean file
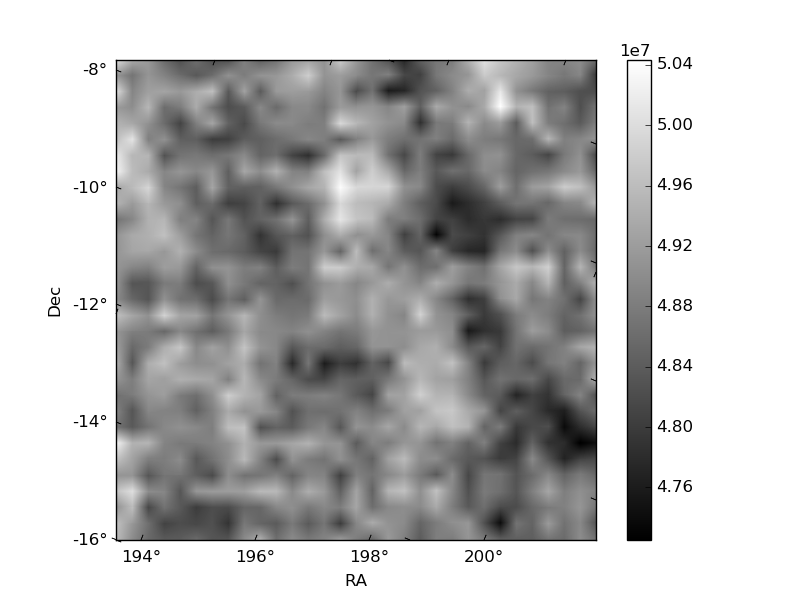
| Quadrant A | 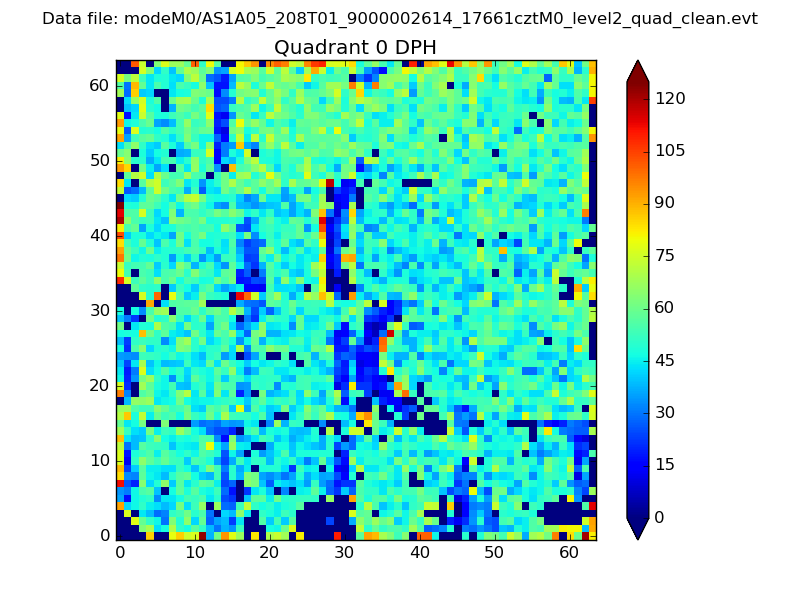 |
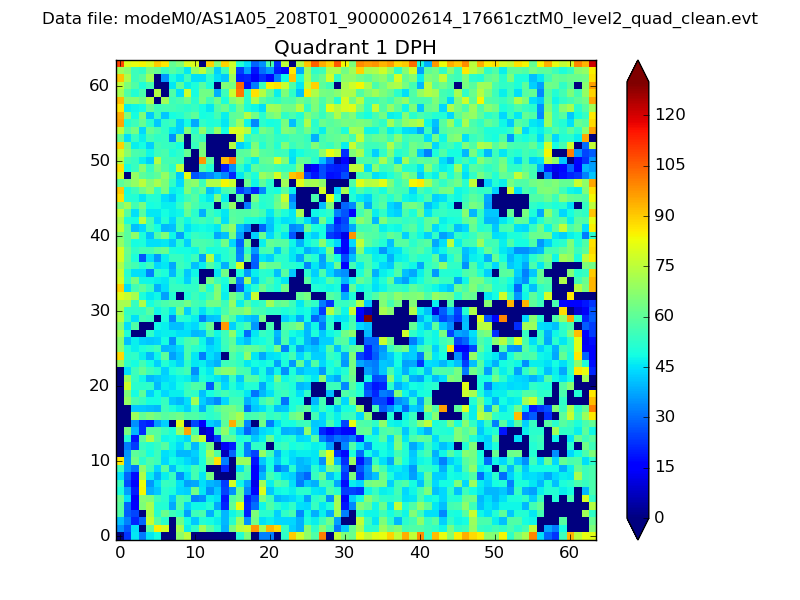 |
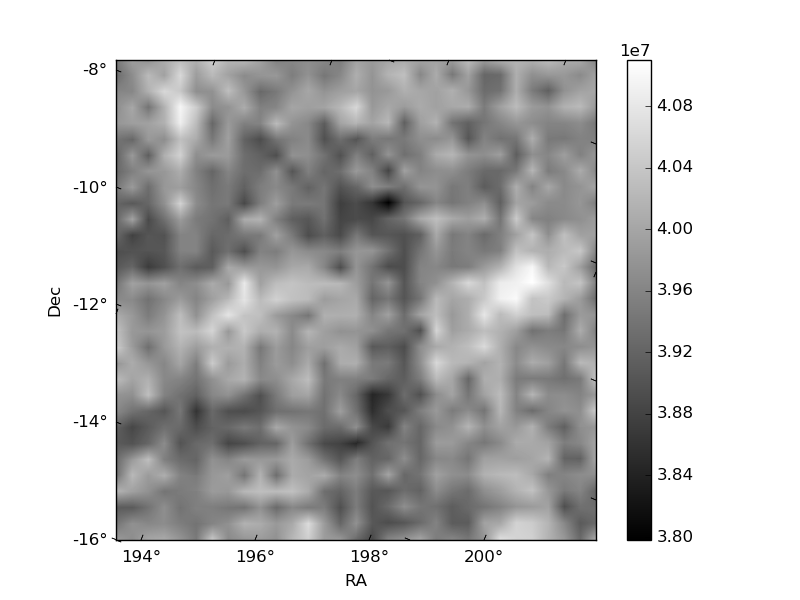
Quadrant B |
|---|---|---|---|
| Quadrant D | 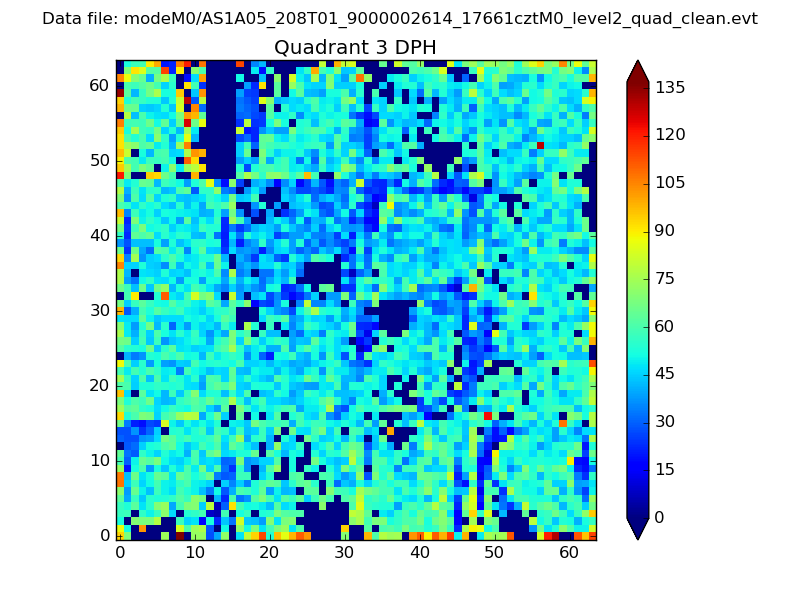 |
 |
Quadrant C |
| Plot type | Count rate plots | Images |
|---|---|---|
| Comparison with Poisson distribution Blue bars denote a histogram of data divided into 1 sec bins. Red curve is a Poisson curve with rate = median count rate of data. |
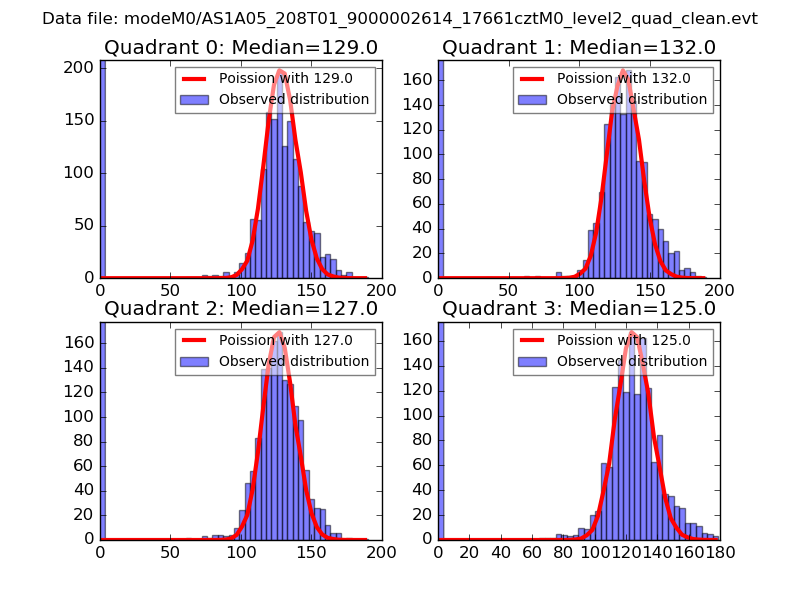 |
 |
| Quadrant-wise count rates Data is divided into 100 sec bins |
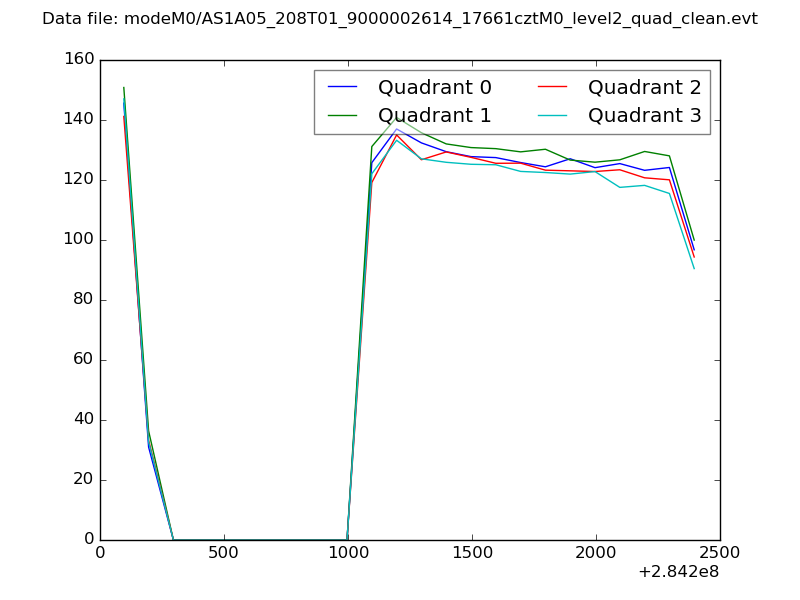 |
|
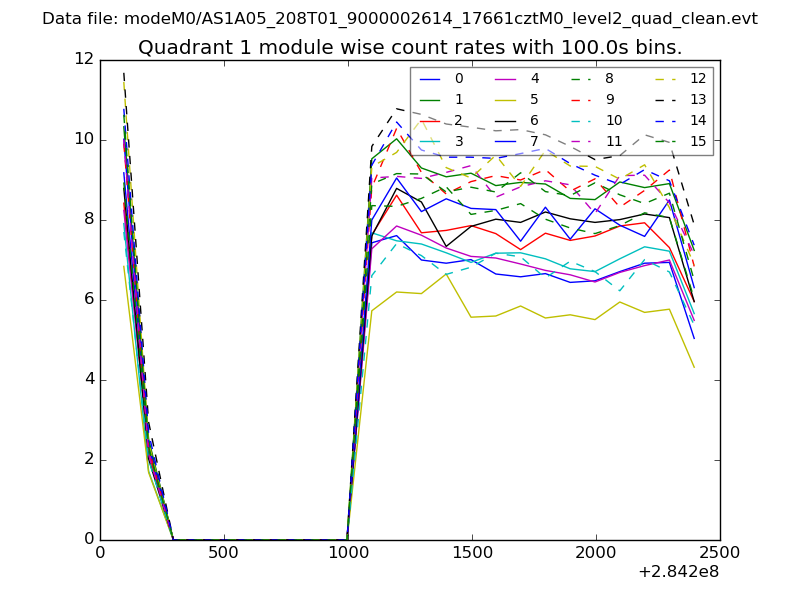
| Module-wise count rates for Quadrant A Data is divided into 100 sec bins |
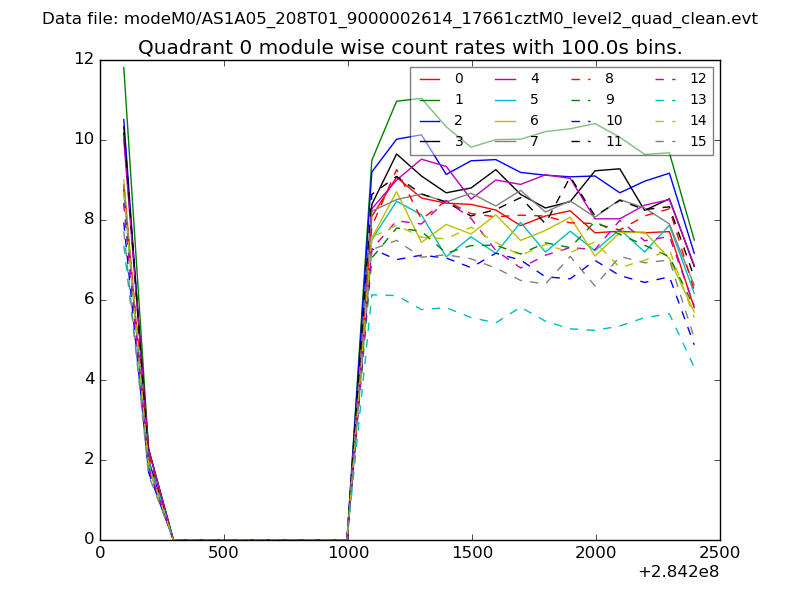 |
 |
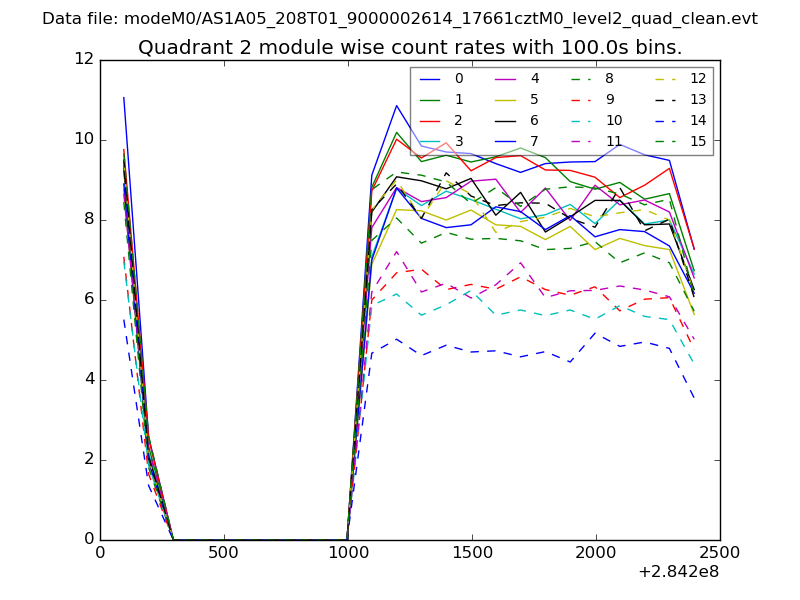
| Module-wise count rates for Quadrant B Data is divided into 100 sec bins |
 |
 |
| Module-wise count rates for Quadrant C Data is divided into 100 sec bins |
 |
 |
| Module-wise count rates for Quadrant D Data is divided into 100 sec bins |
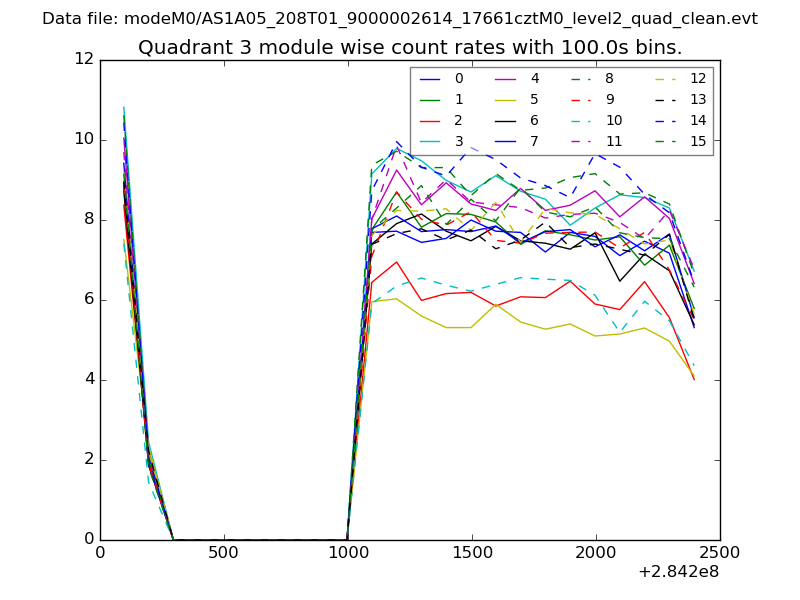 |
 |
| Parameter | Plot |
|---|---|
| CZT HV Monitor | 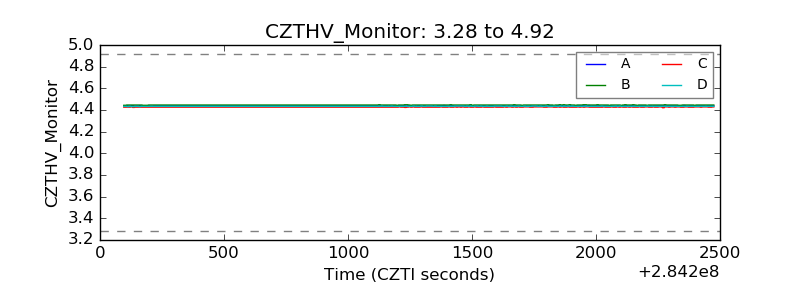 |
| D_VDD | 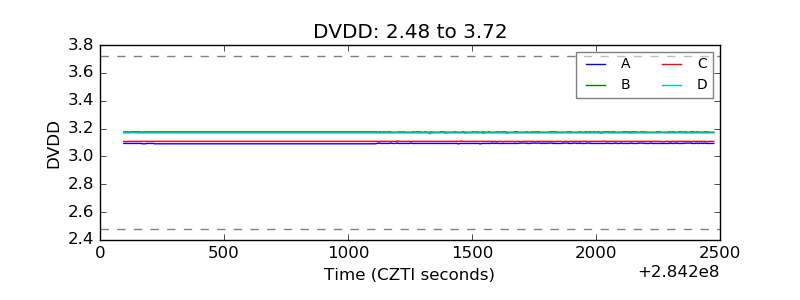 |
| Temperature 1 | 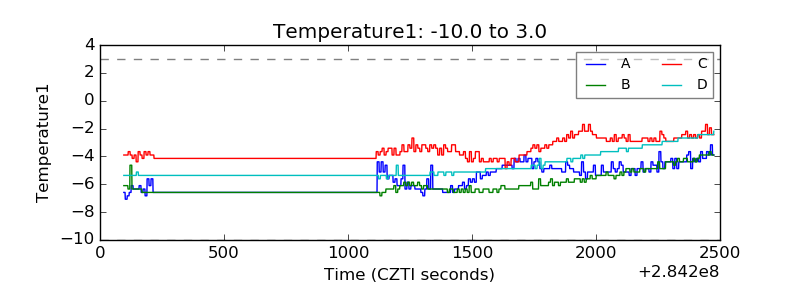 |
| Veto HV Monitor | 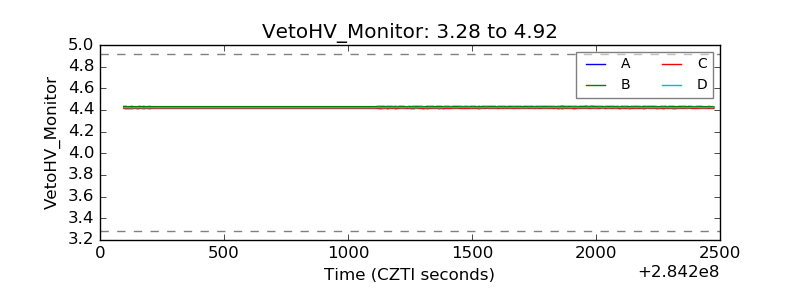 |
| Veto LLD | 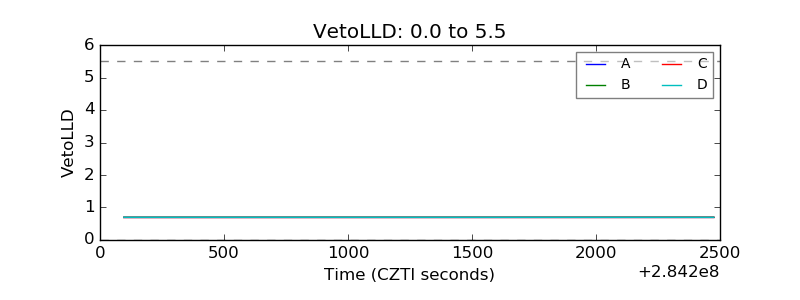 |
| Alpha Counter |  |
| _CPM_Rate | 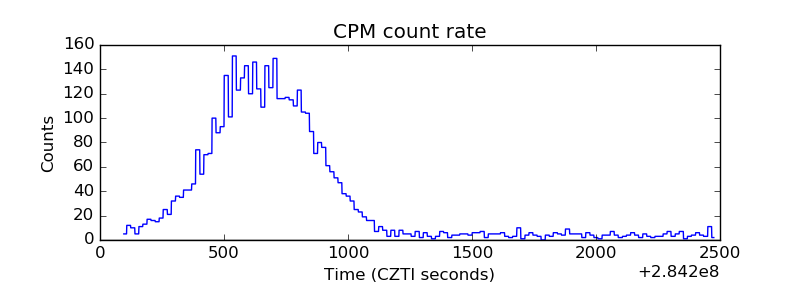 |
| CZT Counter | 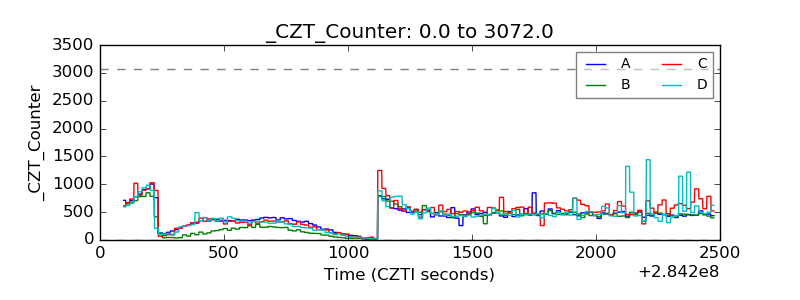 |
| +2.5 Volts monitor |  |
| +5 Volts monitor |  |
| _ROLL_ROT | 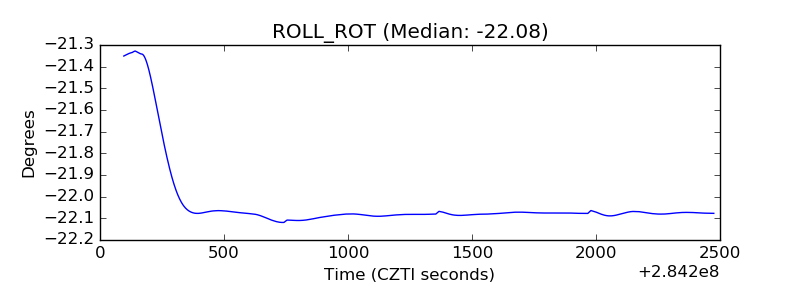 |
| _Roll_DEC |  |
| _Roll_RA | 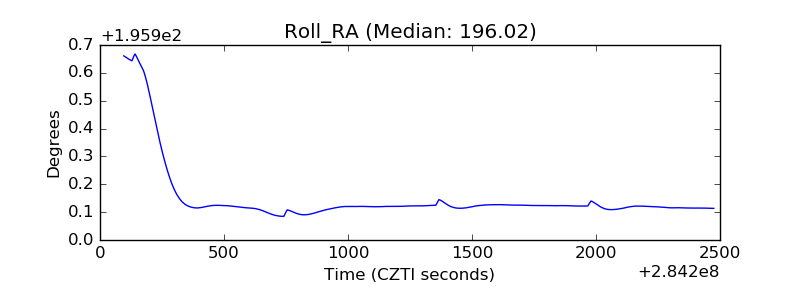 |
| Veto Counter | 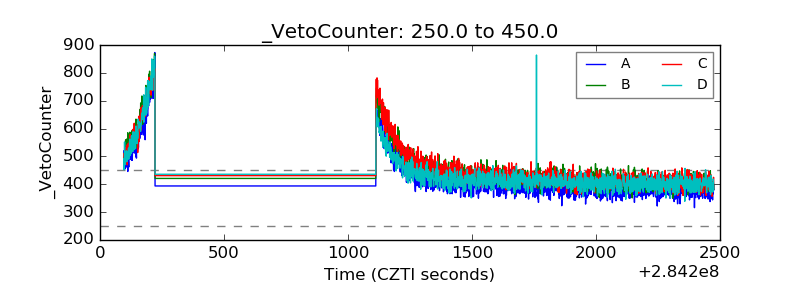 |