| Param | Original file | Final file |
|---|---|---|
| Filename | modeM0/AS1A05_208T01_9000002614_17662cztM0_level2.evt | modeM0/AS1A05_208T01_9000002614_17662cztM0_level2_quad_clean.evt |
| Size (bytes) | 517,919,040 | 87,981,120 |
| Size | 493.9 MB | 83.9 MB |
| Events in quadrant A | 3,464,985 | 553,092 |
| Events in quadrant B | 3,422,473 | 563,802 |
| Events in quadrant C | 4,108,615 | 539,766 |
| Events in quadrant D | 4,227,354 | 533,142 |
| Mode M9 | |||
|---|---|---|---|
| Quadrant | BADHDUFLAG | Total packets | Discarded packets |
| A | 0 | 5 | 0 |
| B | 0 | 5 | 0 |
| C | 0 | 5 | 0 |
| D | 0 | 5 | 0 |
| Mode M0 | |||
|---|---|---|---|
| Quadrant | BADHDUFLAG | Total packets | Discarded packets |
| A | 0 | 14609 | 1 |
| B | 0 | 14428 | 1 |
| C | 0 | 16572 | 1 |
| D | 0 | 16985 | 1 |
| Mode SS | |||
|---|---|---|---|
| Quadrant | BADHDUFLAG | Total packets | Discarded packets |
| A | 0 | 136 | 0 |
| B | 0 | 136 | 0 |
| C | 0 | 136 | 0 |
| D | 0 | 136 | 0 |
| Quadrant | Total seconds | Saturated seconds | Saturation percentage |
|---|---|---|---|
| A | 6811 | 177 | 2.598737% |
| B | 6812 | 172 | 2.524956% |
| C | 6811 | 200 | 2.936426% |
| D | 6811 | 338 | 4.962561% |
Noise dominated data is calculated using 1-second bins in cleaned event files. If a bin has >2000 counts, and if more than 50% of those come from <1% of pixels, then it is considered to be noise-dominated and hence unusable.
| Quadrant | # 1 sec bins | Bins with >0 counts | Bins with >2000 counts | High rate bins dominated by noise | Noise dominated (total time) | Noise dominated (detector-on time) | Marked lightcurve |
|---|---|---|---|---|---|---|---|
| A | 7246 | 6811 | 1 | 1 | 0.01% | 0.01% | 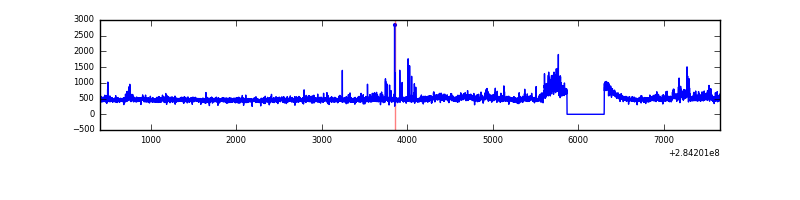 |
| B | 7247 | 6813 | 9 | 9 | 0.12% | 0.13% | 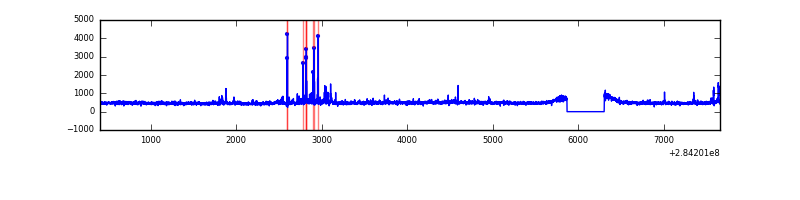 |
| C | 7246 | 6811 | 0 | 0 | 0.00% | 0.00% | 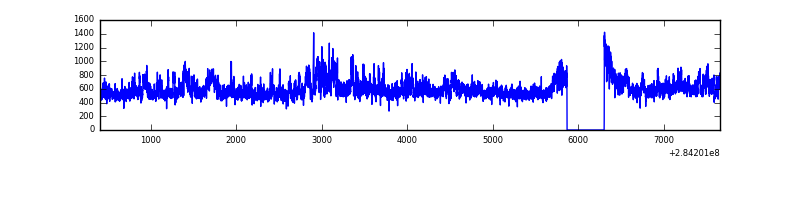 |
| D | 7246 | 6811 | 179 | 179 | 2.47% | 2.63% | 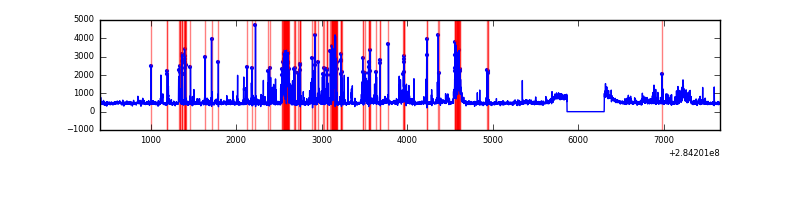 |
Top three noisy pixels from each quadrant. If the there are fewer than three noisy pixels in the level2.evt file, extra rows are filled as -1
| Pixel properties | Quadrant properties | ||||||
|---|---|---|---|---|---|---|---|
| Quadrant | DetID | PixID | Counts | Sigma | Mean | Median | Sigma |
| A | 14 | 237 | 276663 | 1622.54 | 829 | 811 | 170.0 |
| A | 0 | 226 | 7194 | 37.54 | 829 | 811 | 170.0 |
| A | 12 | 194 | 6160 | 31.46 | 829 | 811 | 170.0 |
| B | 7 | 220 | 80796 | 500.41 | 825 | 805 | 159.9 |
| B | 0 | 230 | 40120 | 245.95 | 825 | 805 | 159.9 |
| B | 0 | 229 | 23371 | 141.17 | 825 | 805 | 159.9 |
| C | 3 | 233 | 884184 | 4731.57 | 795 | 801 | 186.7 |
| C | 14 | 238 | 120833 | 642.91 | 795 | 801 | 186.7 |
| C | 13 | 61 | 5635 | 25.89 | 795 | 801 | 186.7 |
| D | 1 | 52 | 644972 | 3312.63 | 803 | 780 | 194.5 |
| D | 10 | 70 | 158837 | 812.78 | 803 | 780 | 194.5 |
| D | 5 | 222 | 151495 | 775.02 | 803 | 780 | 194.5 |
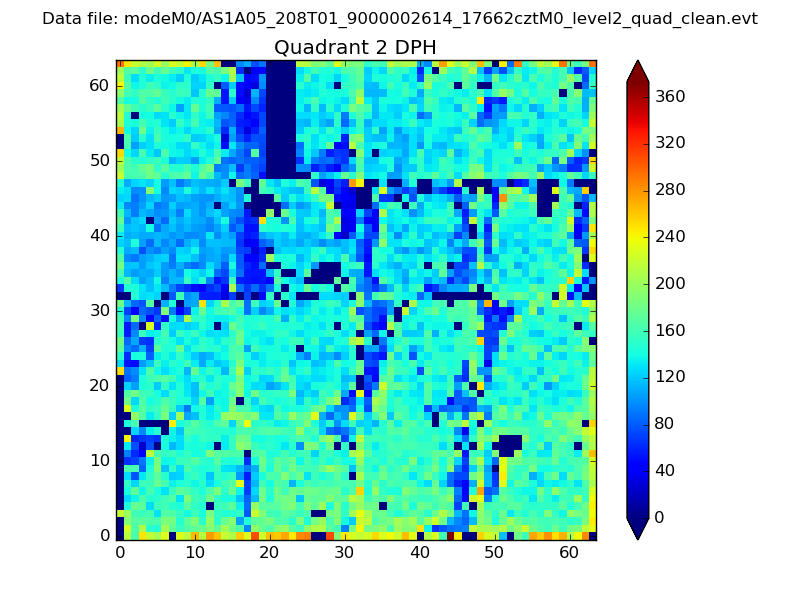
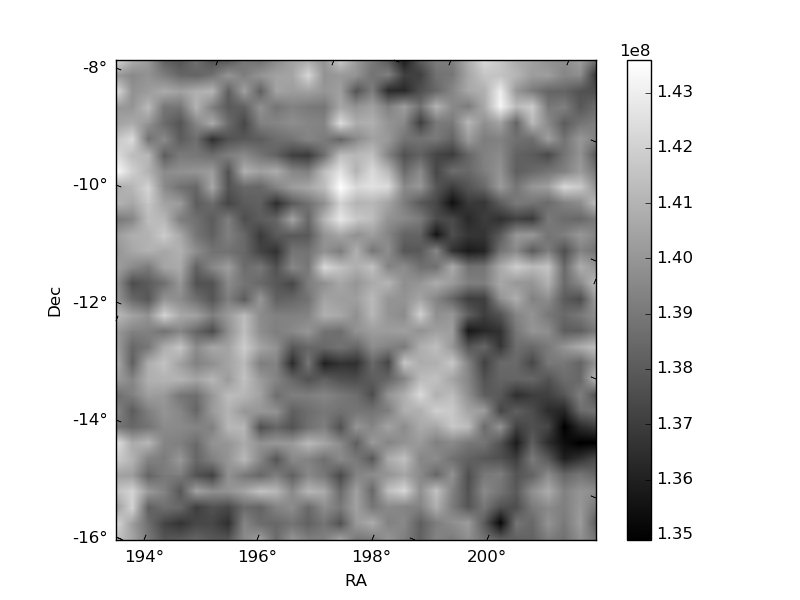
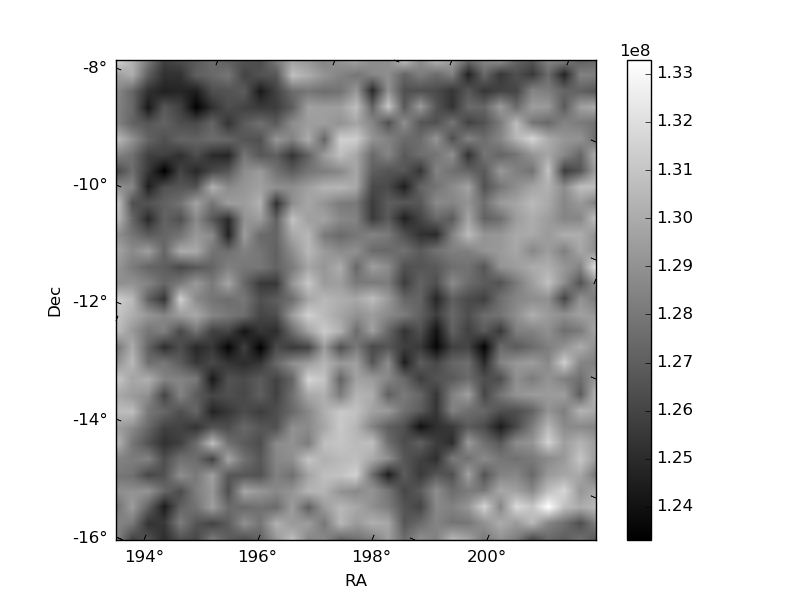
Histogram calculated using DETX and DETY for each event in the final _common_clean file
| Quadrant A | 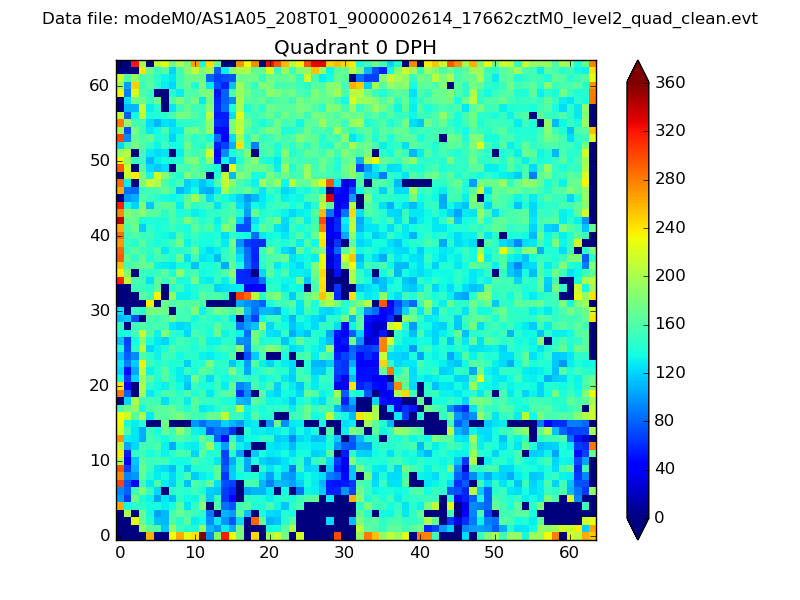 |
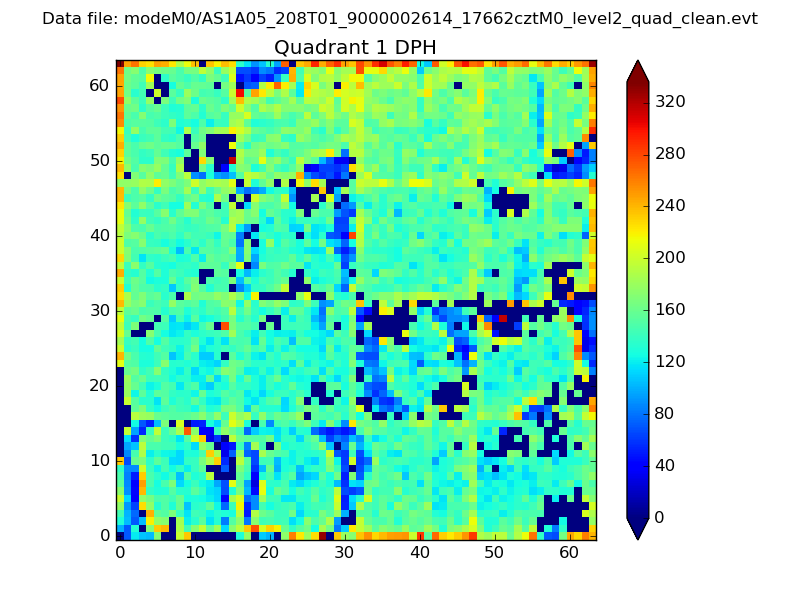 |
Quadrant B |
|---|---|---|---|
| Quadrant D | 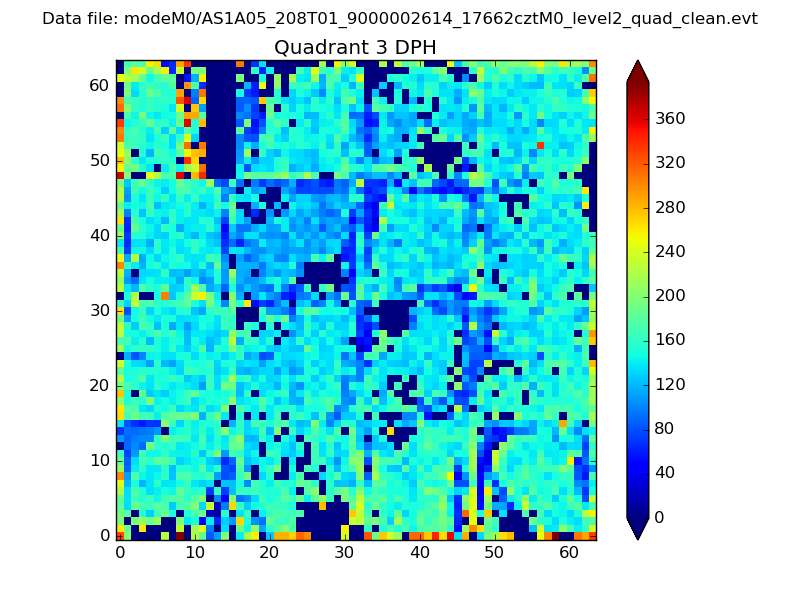 |
 |
Quadrant C |
| Plot type | Count rate plots | Images |
|---|---|---|
| Comparison with Poisson distribution Blue bars denote a histogram of data divided into 1 sec bins. Red curve is a Poisson curve with rate = median count rate of data. |
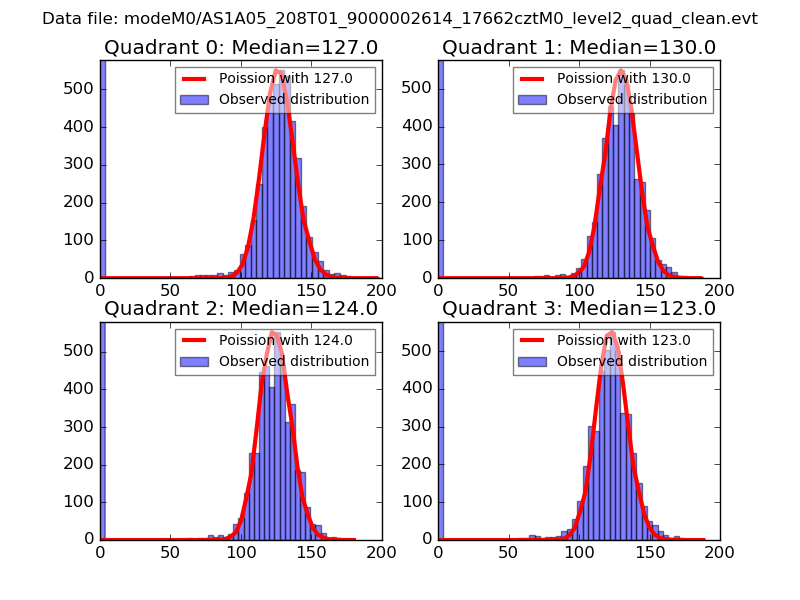 |
 |
| Quadrant-wise count rates Data is divided into 100 sec bins |
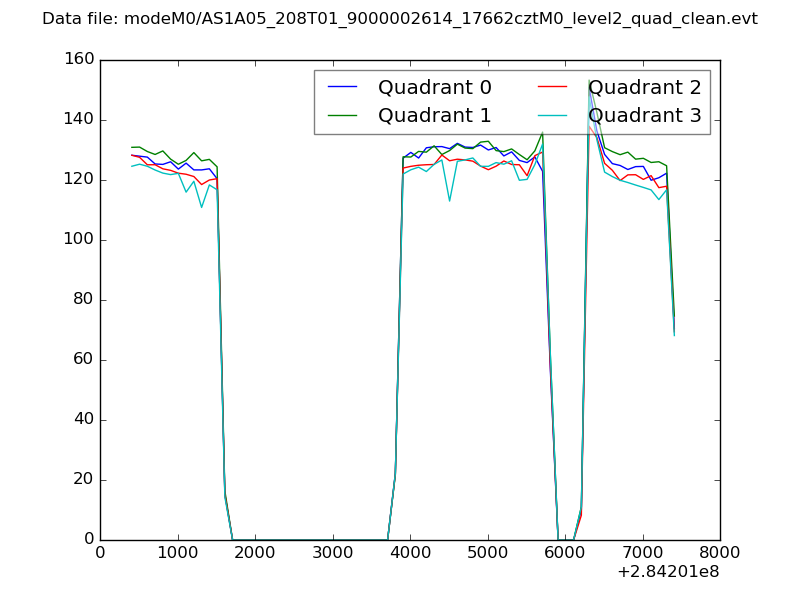 |
|
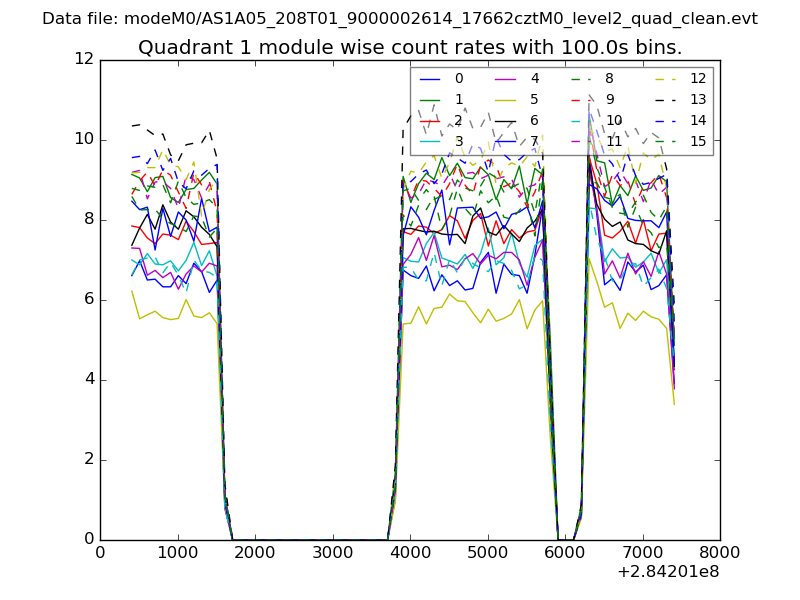
| Module-wise count rates for Quadrant A Data is divided into 100 sec bins |
 |
 |
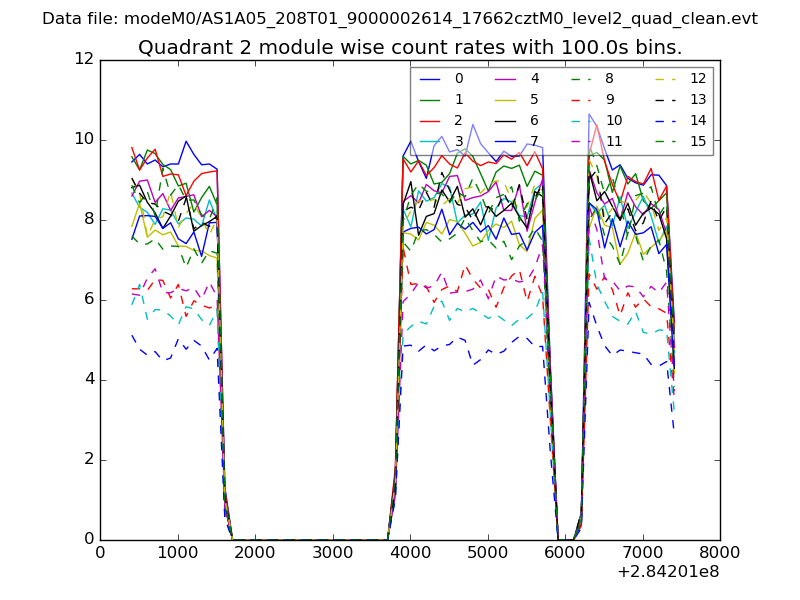
| Module-wise count rates for Quadrant B Data is divided into 100 sec bins |
 |
 |
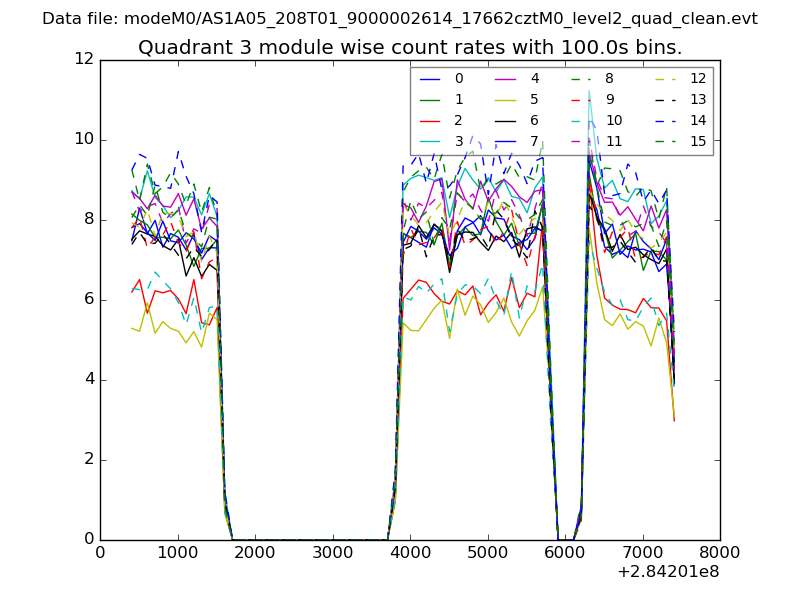
| Module-wise count rates for Quadrant C Data is divided into 100 sec bins |
 |
 |
| Module-wise count rates for Quadrant D Data is divided into 100 sec bins |
 |
 |
| Parameter | Plot |
|---|---|
| CZT HV Monitor | 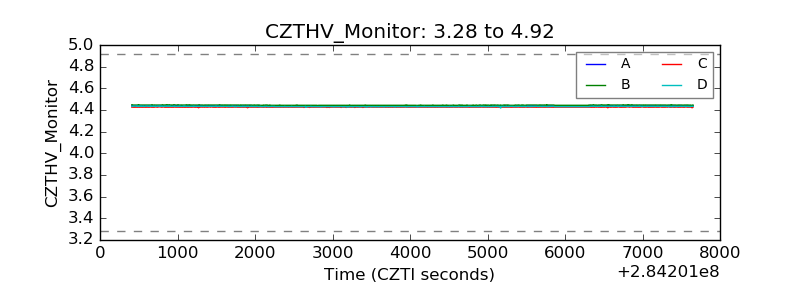 |
| D_VDD | 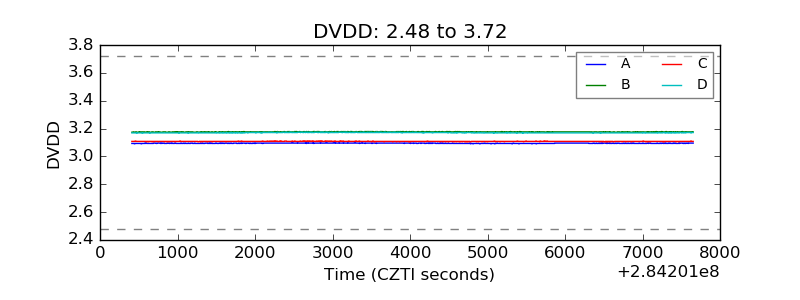 |
| Temperature 1 |  |
| Veto HV Monitor | 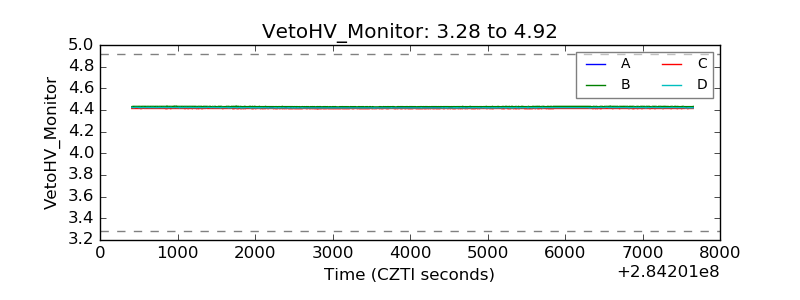 |
| Veto LLD | 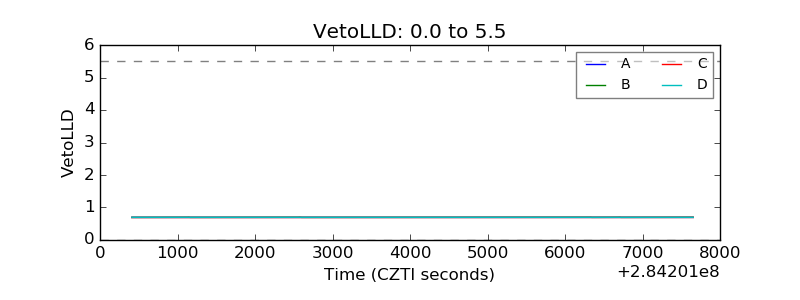 |
| Alpha Counter | 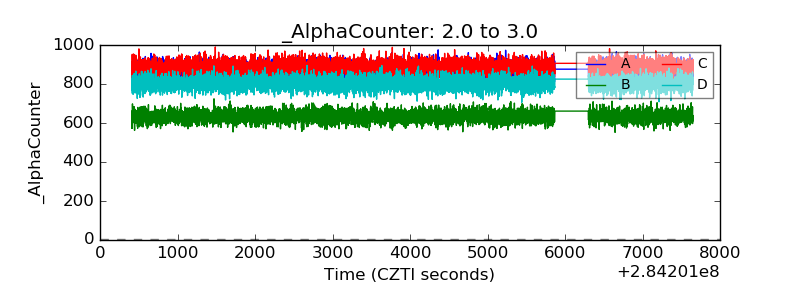 |
| _CPM_Rate | 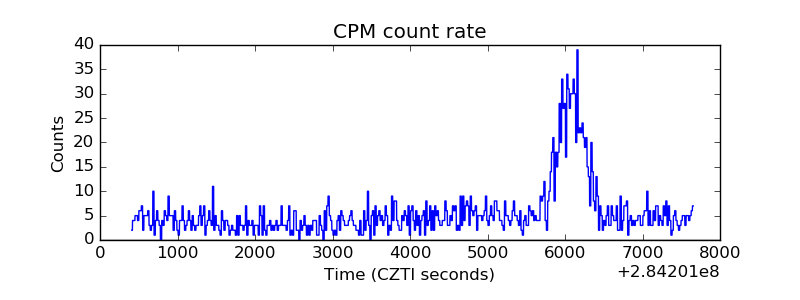 |
| CZT Counter | 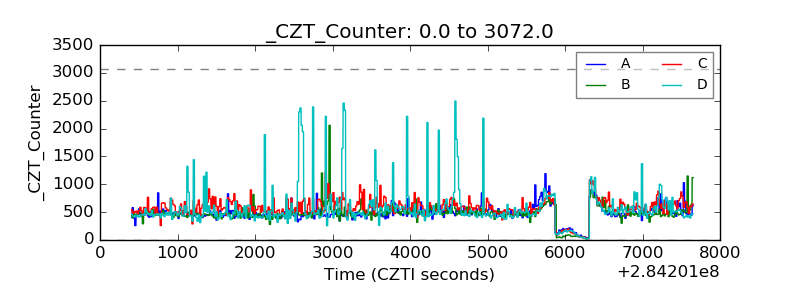 |
| +2.5 Volts monitor |  |
| +5 Volts monitor |  |
| _ROLL_ROT | 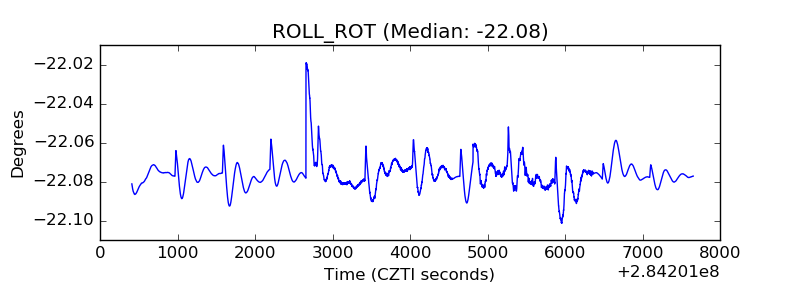 |
| _Roll_DEC | 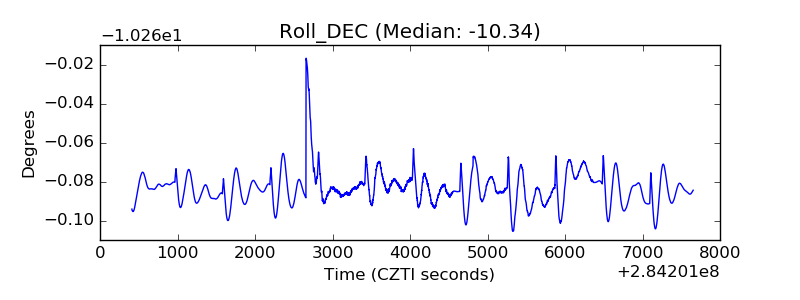 |
| _Roll_RA | 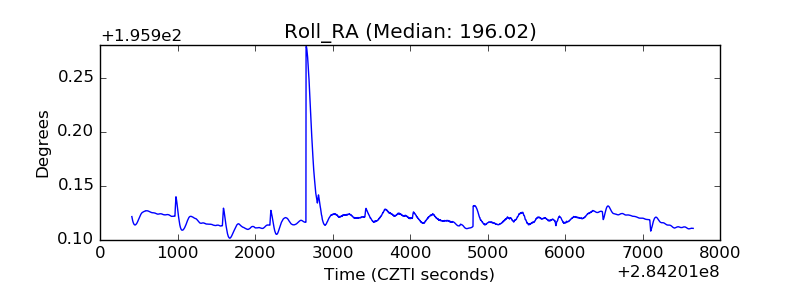 |
| Veto Counter | 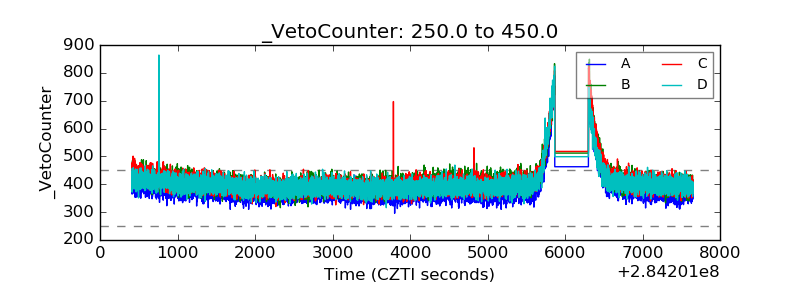 |