| Param | Original file | Final file |
|---|---|---|
| Filename | modeM0/AS1A05_208T01_9000002614_17663cztM0_level2.evt | modeM0/AS1A05_208T01_9000002614_17663cztM0_level2_quad_clean.evt |
| Size (bytes) | 568,831,680 | 90,480,960 |
| Size | 542.5 MB | 86.3 MB |
| Events in quadrant A | 3,879,804 | 561,303 |
| Events in quadrant B | 3,842,596 | 572,636 |
| Events in quadrant C | 4,571,857 | 545,699 |
| Events in quadrant D | 4,426,261 | 540,180 |
| Mode M9 | |||
|---|---|---|---|
| Quadrant | BADHDUFLAG | Total packets | Discarded packets |
| A | 0 | 2 | 0 |
| B | 0 | 2 | 0 |
| C | 0 | 2 | 0 |
| D | 0 | 2 | 0 |
| Mode M0 | |||
|---|---|---|---|
| Quadrant | BADHDUFLAG | Total packets | Discarded packets |
| A | 0 | 16245 | 1 |
| B | 0 | 16056 | 1 |
| C | 0 | 18637 | 1 |
| D | 0 | 18021 | 1 |
| Mode SS | |||
|---|---|---|---|
| Quadrant | BADHDUFLAG | Total packets | Discarded packets |
| A | 0 | 150 | 0 |
| B | 0 | 150 | 0 |
| C | 0 | 150 | 0 |
| D | 0 | 150 | 0 |
| Quadrant | Total seconds | Saturated seconds | Saturation percentage |
|---|---|---|---|
| A | 7475 | 182 | 2.434783% |
| B | 7475 | 189 | 2.528428% |
| C | 7475 | 239 | 3.197324% |
| D | 7475 | 208 | 2.782609% |
Noise dominated data is calculated using 1-second bins in cleaned event files. If a bin has >2000 counts, and if more than 50% of those come from <1% of pixels, then it is considered to be noise-dominated and hence unusable.
| Quadrant | # 1 sec bins | Bins with >0 counts | Bins with >2000 counts | High rate bins dominated by noise | Noise dominated (total time) | Noise dominated (detector-on time) | Marked lightcurve |
|---|---|---|---|---|---|---|---|
| A | 7665 | 7476 | 0 | 0 | 0.00% | 0.00% | 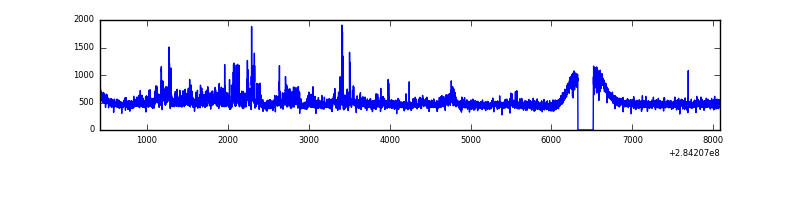 |
| B | 7665 | 7476 | 8 | 8 | 0.10% | 0.11% | 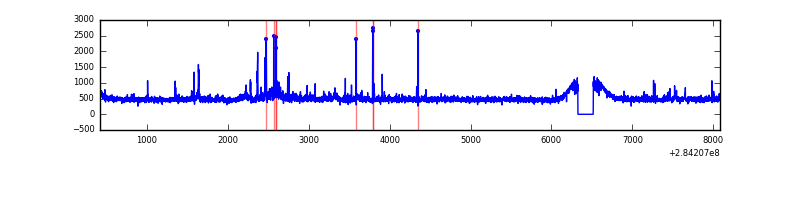 |
| C | 7665 | 7476 | 1 | 1 | 0.01% | 0.01% | 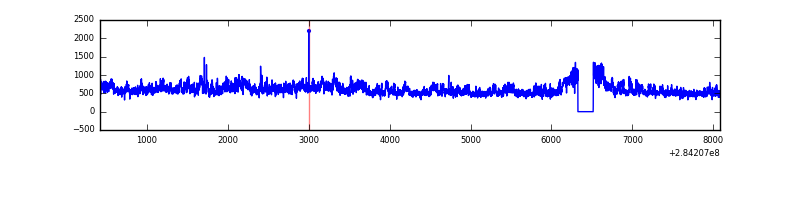 |
| D | 7665 | 7476 | 39 | 39 | 0.51% | 0.52% | 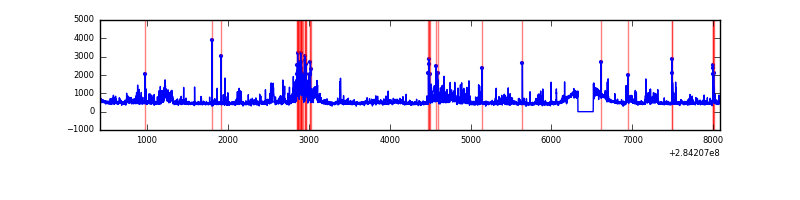 |
Top three noisy pixels from each quadrant. If the there are fewer than three noisy pixels in the level2.evt file, extra rows are filled as -1
| Pixel properties | Quadrant properties | ||||||
|---|---|---|---|---|---|---|---|
| Quadrant | DetID | PixID | Counts | Sigma | Mean | Median | Sigma |
| A | 14 | 237 | 335741 | 1775.92 | 921 | 897 | 188.5 |
| A | 0 | 226 | 8038 | 37.87 | 921 | 897 | 188.5 |
| A | 3 | 137 | 6825 | 31.44 | 921 | 897 | 188.5 |
| B | 0 | 229 | 61048 | 334.55 | 916 | 892 | 179.8 |
| B | 15 | 35 | 50460 | 275.67 | 916 | 892 | 179.8 |
| B | 7 | 220 | 45080 | 245.75 | 916 | 892 | 179.8 |
| C | 3 | 233 | 999546 | 4786.18 | 881 | 886 | 208.7 |
| C | 14 | 238 | 133351 | 634.85 | 881 | 886 | 208.7 |
| C | 13 | 61 | 6257 | 25.74 | 881 | 886 | 208.7 |
| D | 5 | 222 | 421465 | 1896.64 | 901 | 875 | 221.8 |
| D | 1 | 52 | 287792 | 1293.84 | 901 | 875 | 221.8 |
| D | 10 | 70 | 79894 | 356.33 | 901 | 875 | 221.8 |
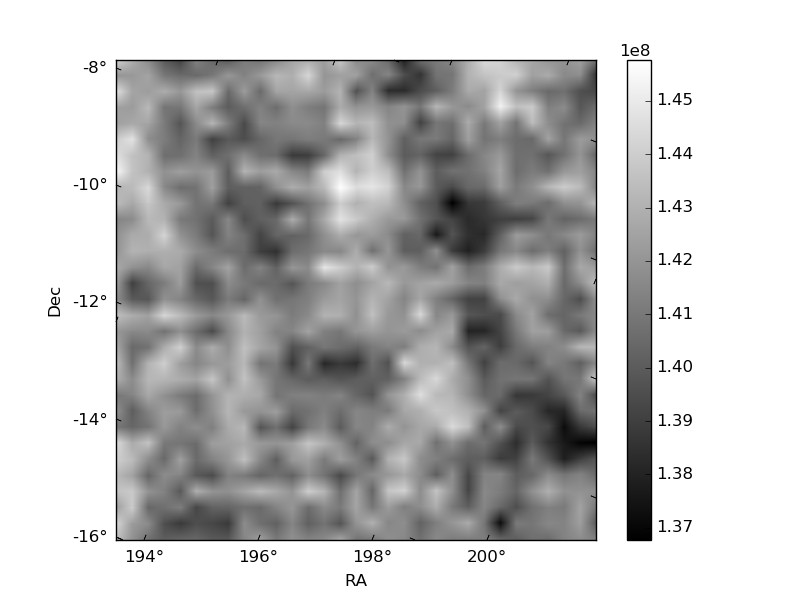
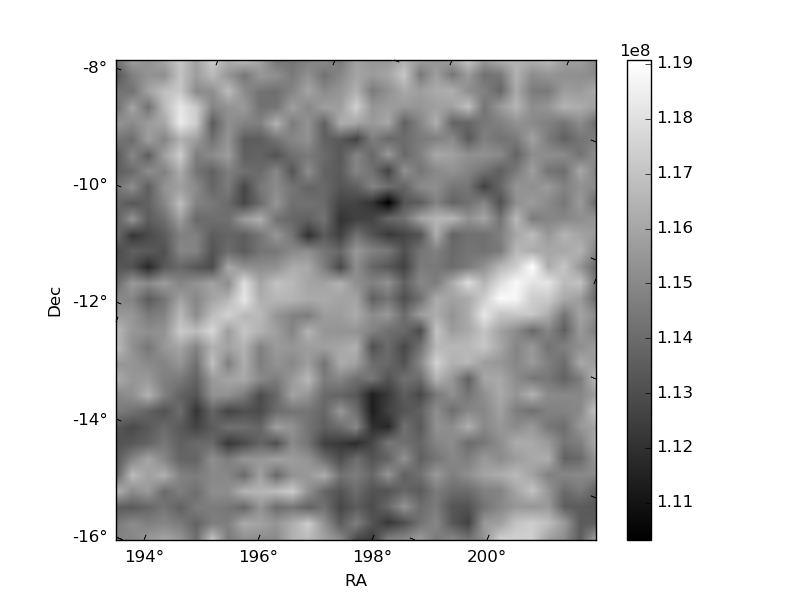
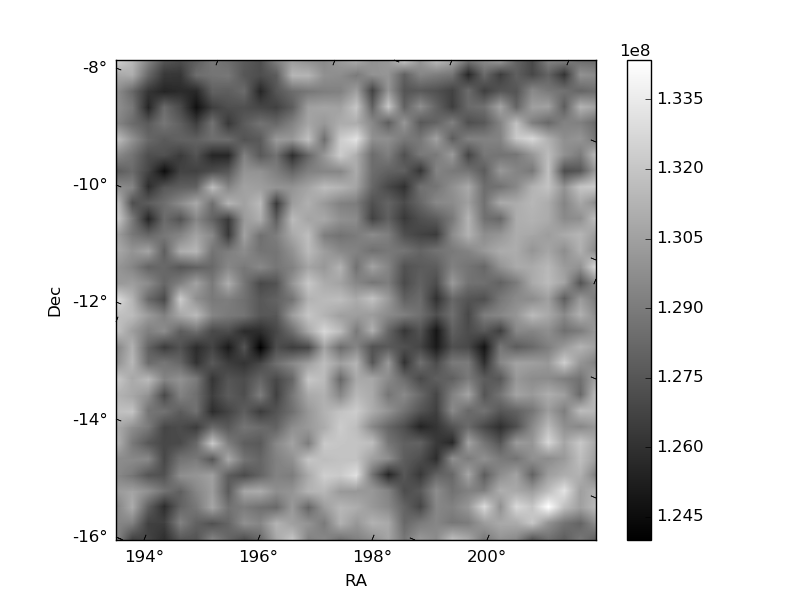
Histogram calculated using DETX and DETY for each event in the final _common_clean file
| Quadrant A | 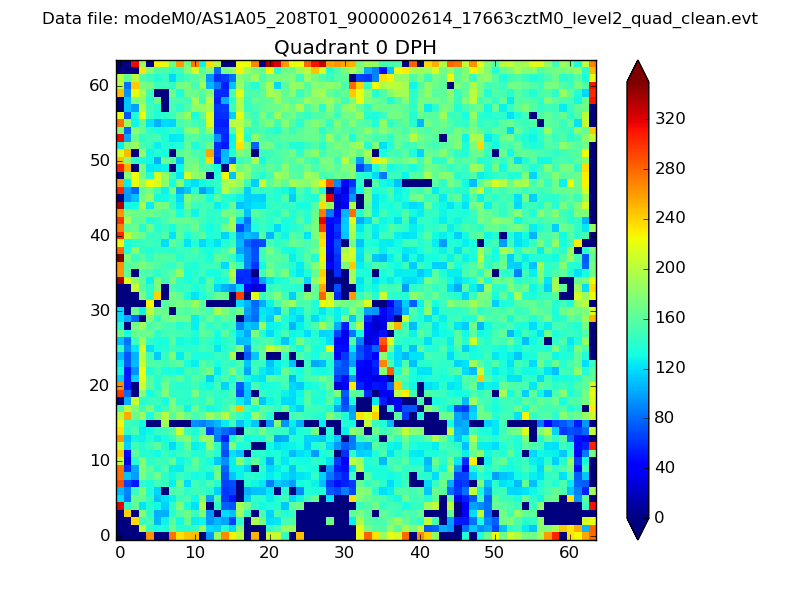 |
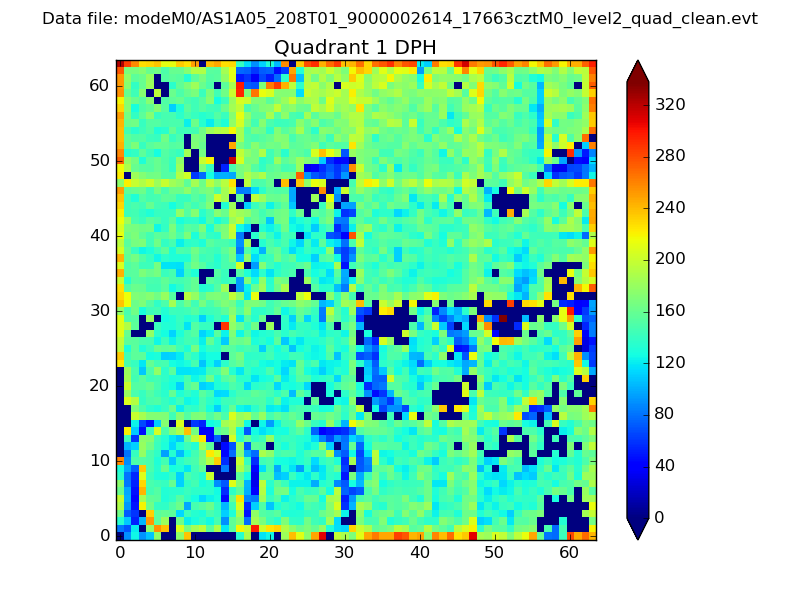 |
Quadrant B |
|---|---|---|---|
| Quadrant D | 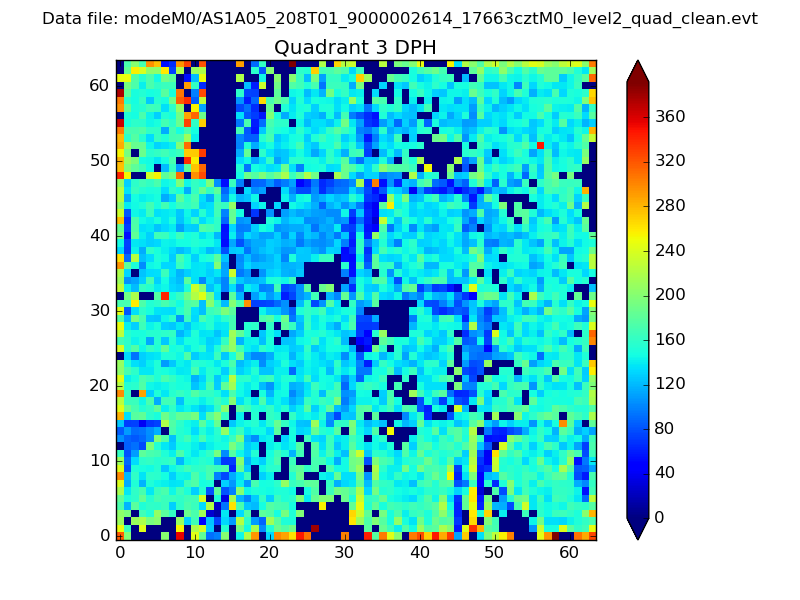 |
 |
Quadrant C |
| Plot type | Count rate plots | Images |
|---|---|---|
| Comparison with Poisson distribution Blue bars denote a histogram of data divided into 1 sec bins. Red curve is a Poisson curve with rate = median count rate of data. |
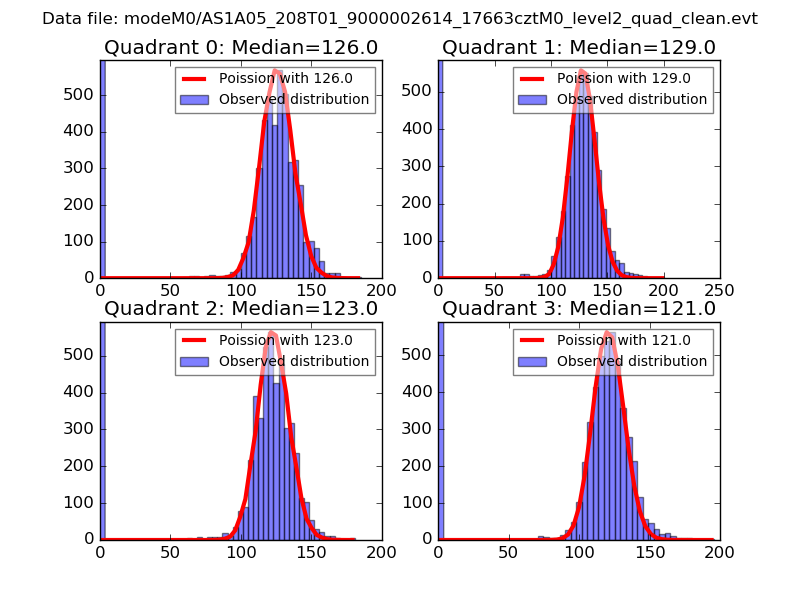 |
 |
| Quadrant-wise count rates Data is divided into 100 sec bins |
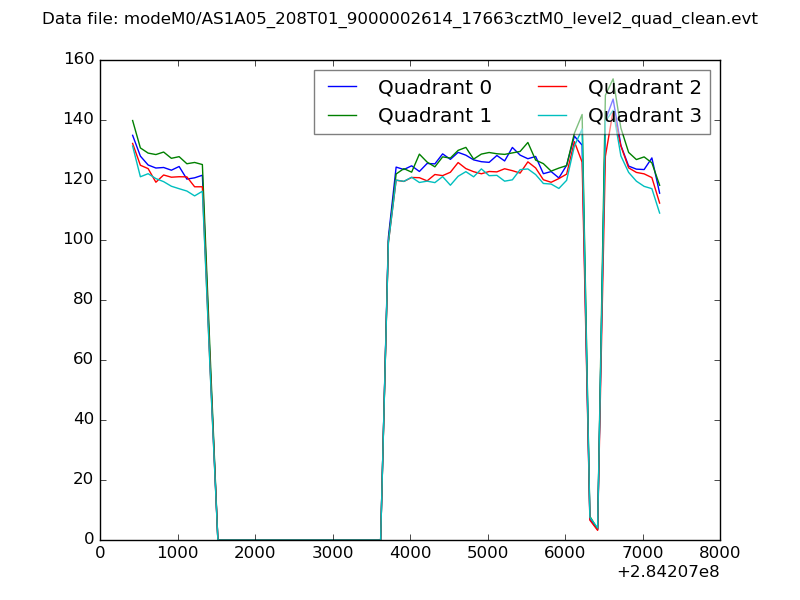 |
|
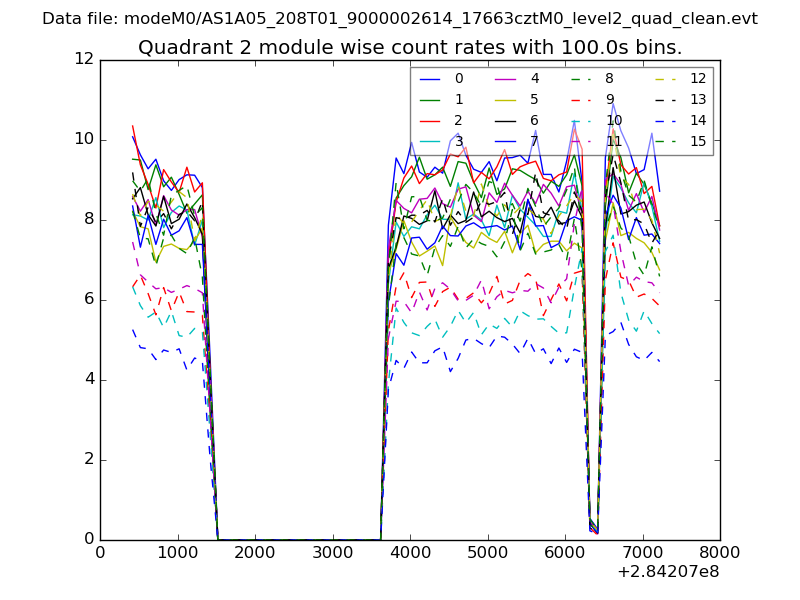
| Module-wise count rates for Quadrant A Data is divided into 100 sec bins |
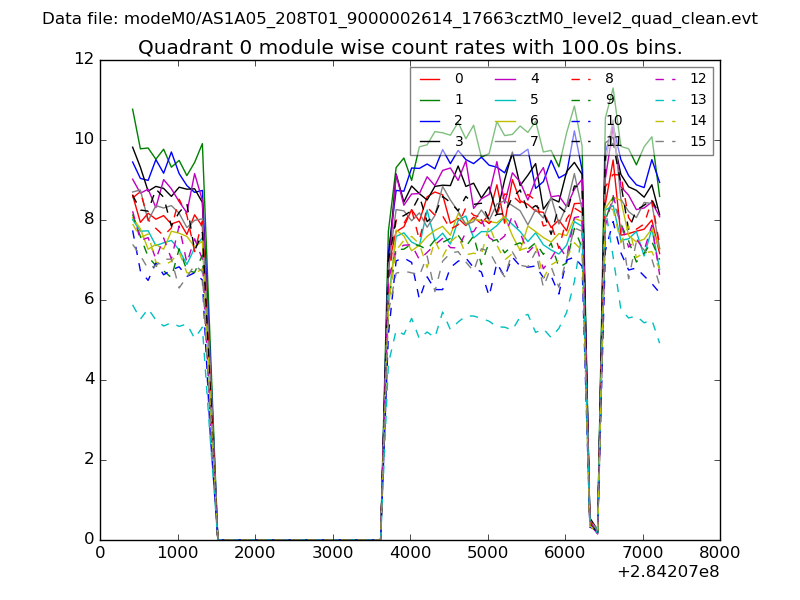 |
 |
| Module-wise count rates for Quadrant B Data is divided into 100 sec bins |
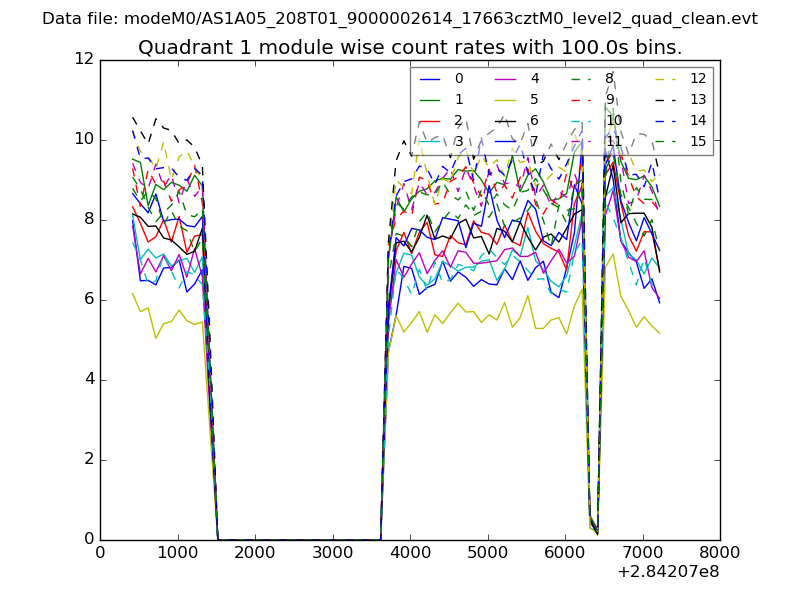 |
 |
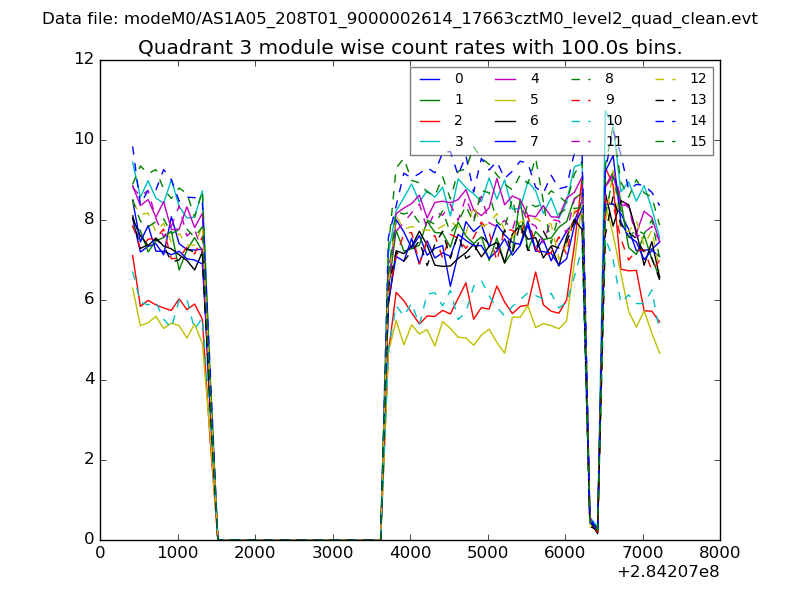
| Module-wise count rates for Quadrant C Data is divided into 100 sec bins |
 |
 |
| Module-wise count rates for Quadrant D Data is divided into 100 sec bins |
 |
 |
| Parameter | Plot |
|---|---|
| CZT HV Monitor | 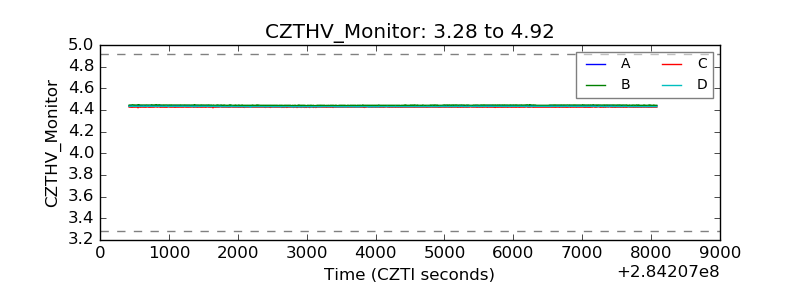 |
| D_VDD | 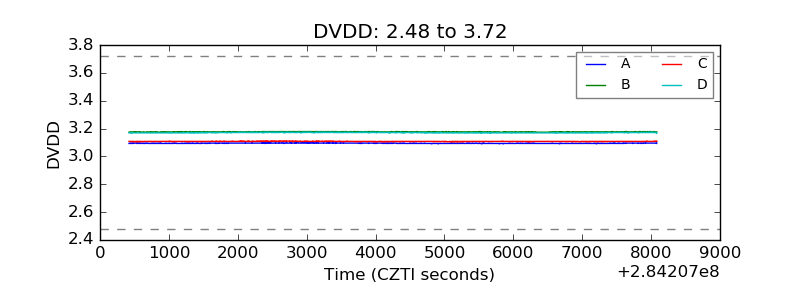 |
| Temperature 1 | 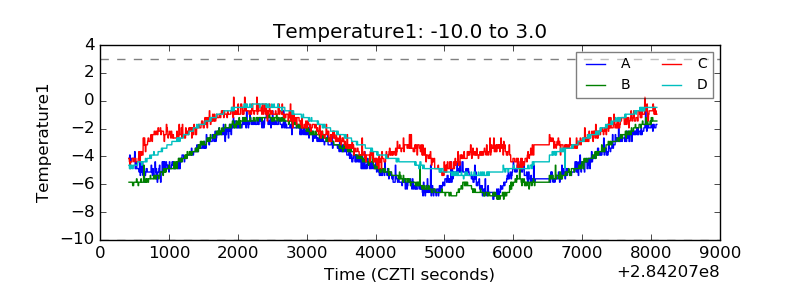 |
| Veto HV Monitor | 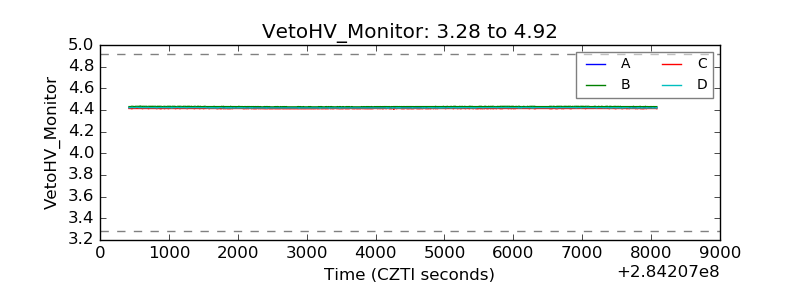 |
| Veto LLD | 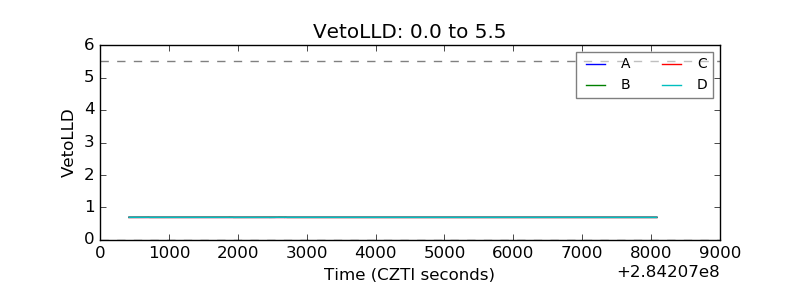 |
| Alpha Counter | 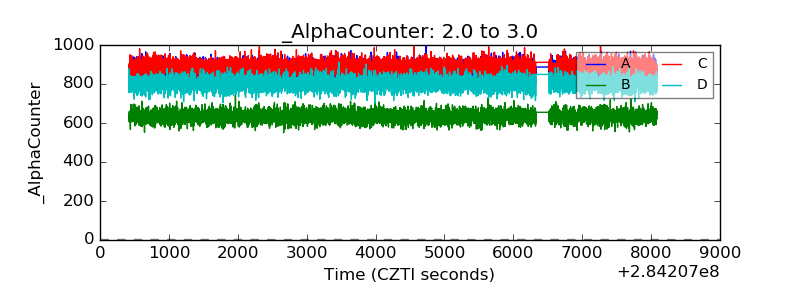 |
| _CPM_Rate | 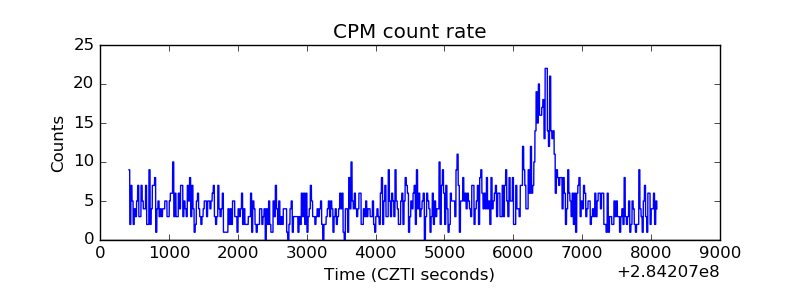 |
| CZT Counter | 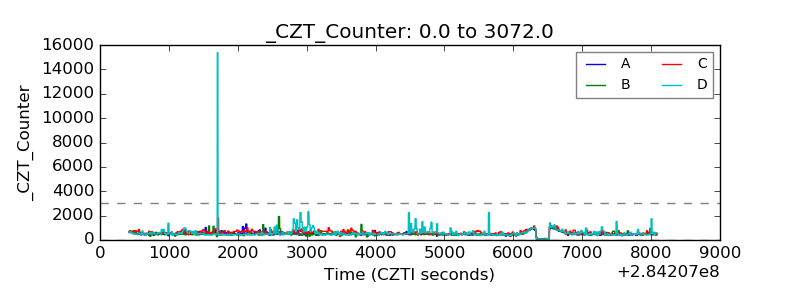 |
| +2.5 Volts monitor |  |
| +5 Volts monitor |  |
| _ROLL_ROT | 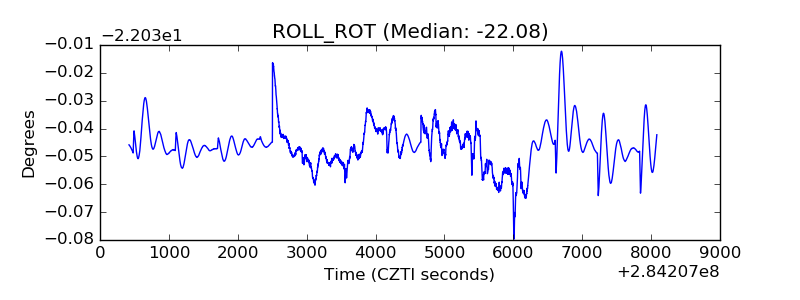 |
| _Roll_DEC | 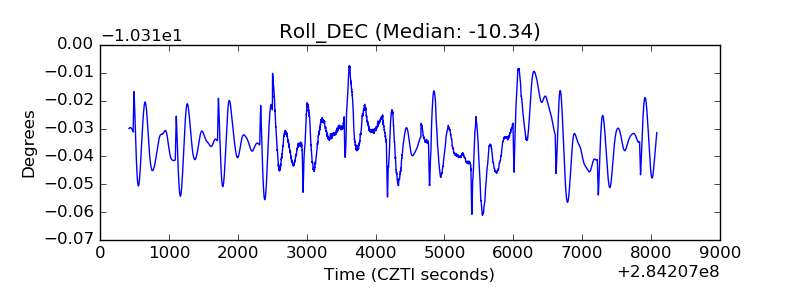 |
| _Roll_RA | 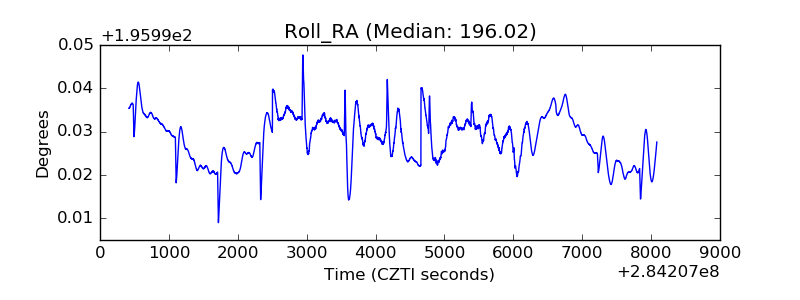 |
| Veto Counter | 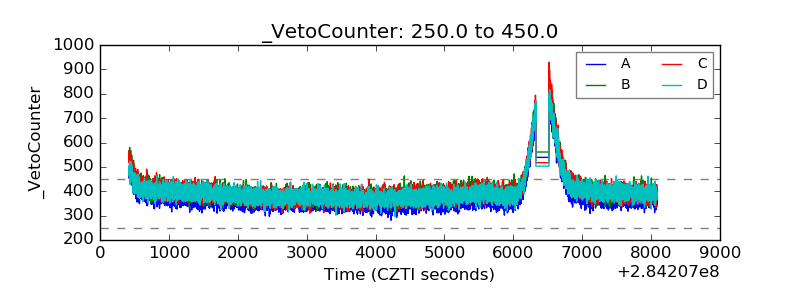 |