| Param | Original file | Final file |
|---|---|---|
| Filename | modeM0/AS1A05_208T01_9000002614_17668cztM0_level2.evt | modeM0/AS1A05_208T01_9000002614_17668cztM0_level2_quad_clean.evt |
| Size (bytes) | 1,599,353,280 | 291,297,600 |
| Size | 1.5 GB | 277.8 MB |
| Events in quadrant A | 10,909,126 | 1,823,067 |
| Events in quadrant B | 11,794,152 | 1,844,760 |
| Events in quadrant C | 12,020,672 | 1,779,742 |
| Events in quadrant D | 12,123,148 | 1,757,068 |
| Mode M9 | |||
|---|---|---|---|
| Quadrant | BADHDUFLAG | Total packets | Discarded packets |
| A | 0 | 29 | 0 |
| B | 0 | 29 | 0 |
| C | 0 | 29 | 0 |
| D | 0 | 29 | 0 |
| Mode M0 | |||
|---|---|---|---|
| Quadrant | BADHDUFLAG | Total packets | Discarded packets |
| A | 0 | 48151 | 4 |
| B | 0 | 50362 | 4 |
| C | 0 | 50042 | 4 |
| D | 0 | 52245 | 4 |
| Mode SS | |||
|---|---|---|---|
| Quadrant | BADHDUFLAG | Total packets | Discarded packets |
| A | 0 | 480 | 0 |
| B | 0 | 480 | 0 |
| C | 0 | 480 | 0 |
| D | 0 | 480 | 0 |
| Quadrant | Total seconds | Saturated seconds | Saturation percentage |
|---|---|---|---|
| A | 23505 | 187 | 0.795575% |
| B | 23505 | 307 | 1.306105% |
| C | 23505 | 303 | 1.289087% |
| D | 23506 | 416 | 1.769761% |
Noise dominated data is calculated using 1-second bins in cleaned event files. If a bin has >2000 counts, and if more than 50% of those come from <1% of pixels, then it is considered to be noise-dominated and hence unusable.
| Quadrant | # 1 sec bins | Bins with >0 counts | Bins with >2000 counts | High rate bins dominated by noise | Noise dominated (total time) | Noise dominated (detector-on time) | Marked lightcurve |
|---|---|---|---|---|---|---|---|
| A | 26526 | 23509 | 0 | 0 | 0.00% | 0.00% | 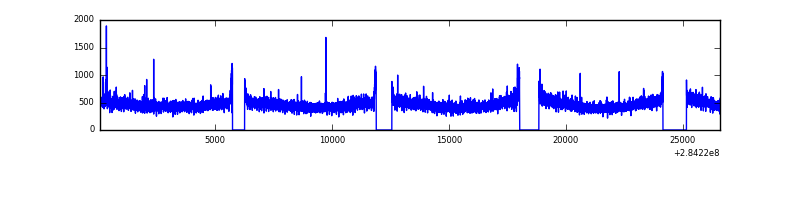 |
| B | 26526 | 23508 | 48 | 48 | 0.18% | 0.20% | 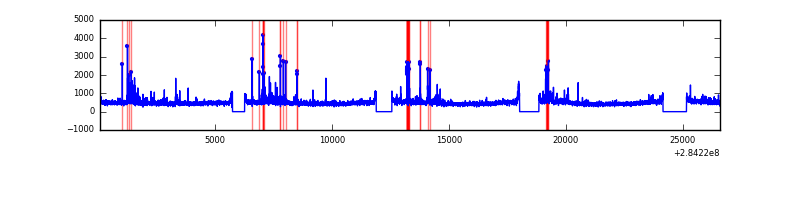 |
| C | 26526 | 23510 | 2 | 2 | 0.01% | 0.01% | 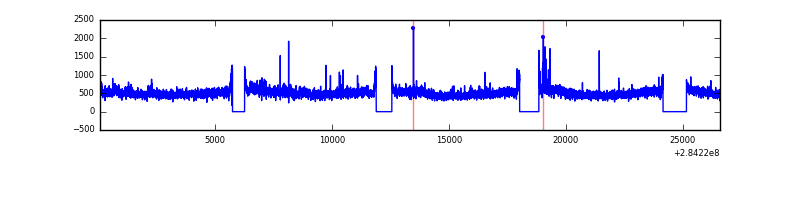 |
| D | 26527 | 23510 | 240 | 240 | 0.90% | 1.02% | 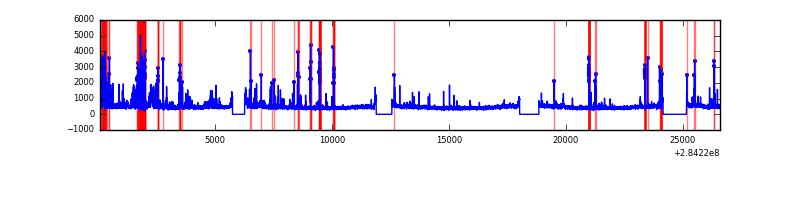 |
Top three noisy pixels from each quadrant. If the there are fewer than three noisy pixels in the level2.evt file, extra rows are filled as -1
| Pixel properties | Quadrant properties | ||||||
|---|---|---|---|---|---|---|---|
| Quadrant | DetID | PixID | Counts | Sigma | Mean | Median | Sigma |
| A | 14 | 237 | 68983 | 116.51 | 2817 | 2754 | 568.5 |
| A | 0 | 226 | 24767 | 38.72 | 2817 | 2754 | 568.5 |
| A | 3 | 137 | 21125 | 32.32 | 2817 | 2754 | 568.5 |
| B | 7 | 220 | 275586 | 505.89 | 2811 | 2735 | 539.3 |
| B | 4 | 216 | 182658 | 333.59 | 2811 | 2735 | 539.3 |
| B | 0 | 189 | 78896 | 141.21 | 2811 | 2735 | 539.3 |
| C | 3 | 233 | 972859 | 1515.57 | 2713 | 2728 | 640.1 |
| C | 14 | 238 | 414094 | 642.65 | 2713 | 2728 | 640.1 |
| C | 5 | 218 | 58630 | 87.33 | 2713 | 2728 | 640.1 |
| D | 1 | 52 | 624812 | 933.18 | 2737 | 2664 | 666.7 |
| D | 13 | 189 | 467034 | 696.53 | 2737 | 2664 | 666.7 |
| D | 7 | 238 | 236816 | 351.21 | 2737 | 2664 | 666.7 |
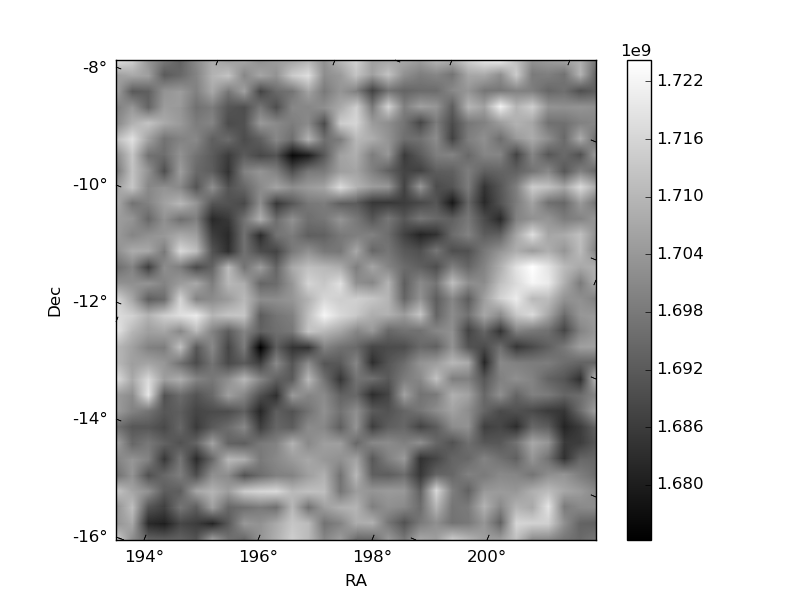
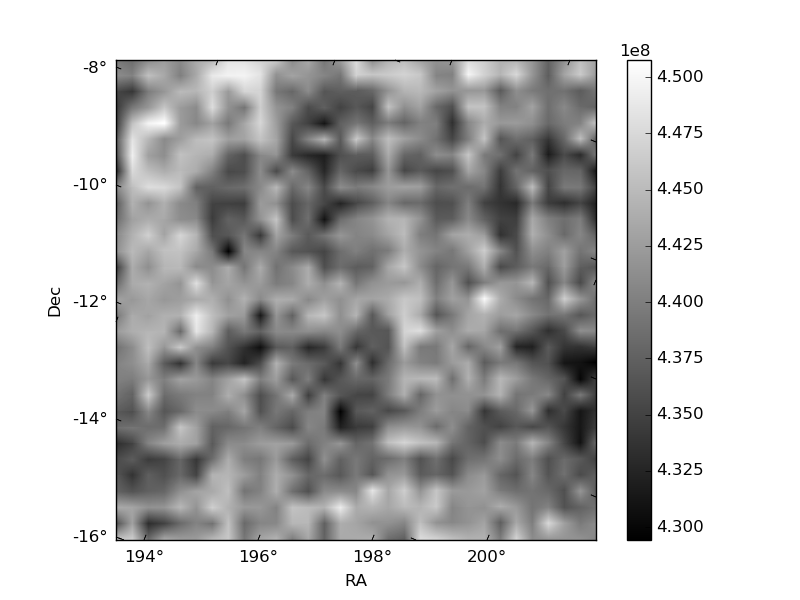
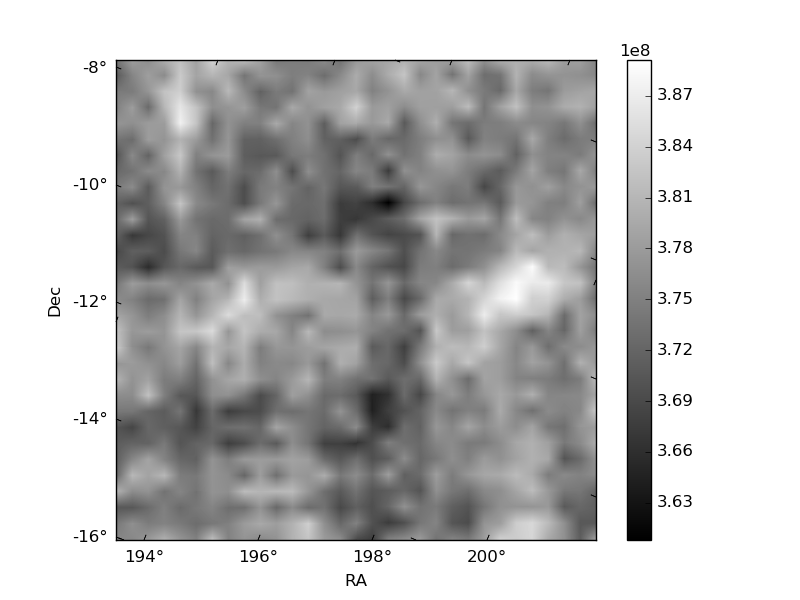
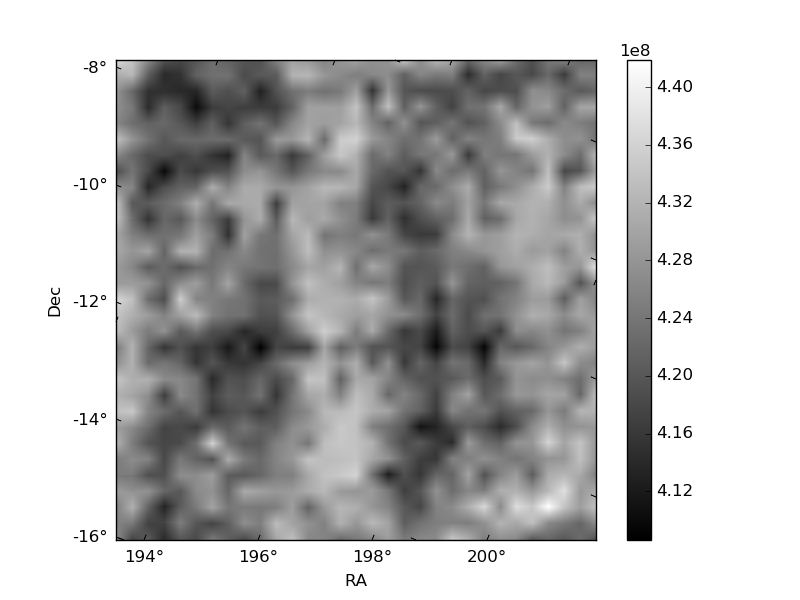
Histogram calculated using DETX and DETY for each event in the final _common_clean file
| Quadrant A | 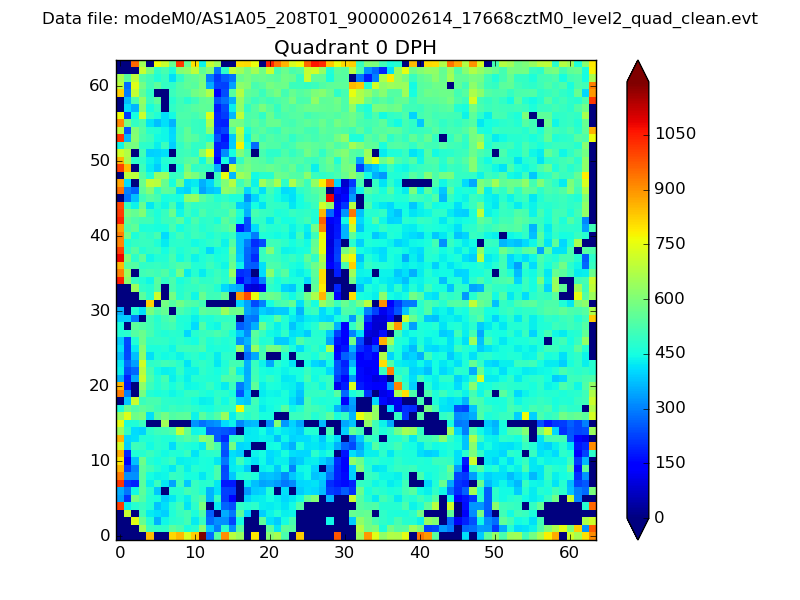 |
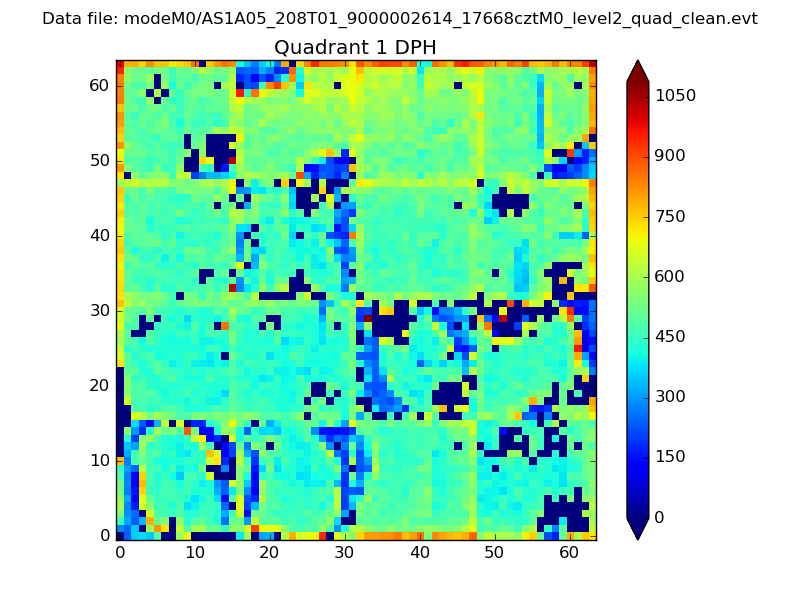 |
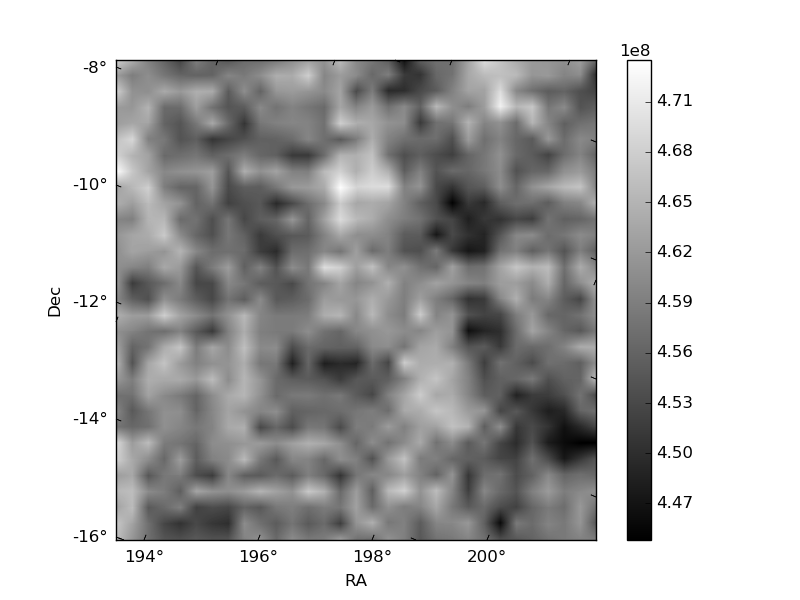
Quadrant B |
|---|---|---|---|
| Quadrant D | 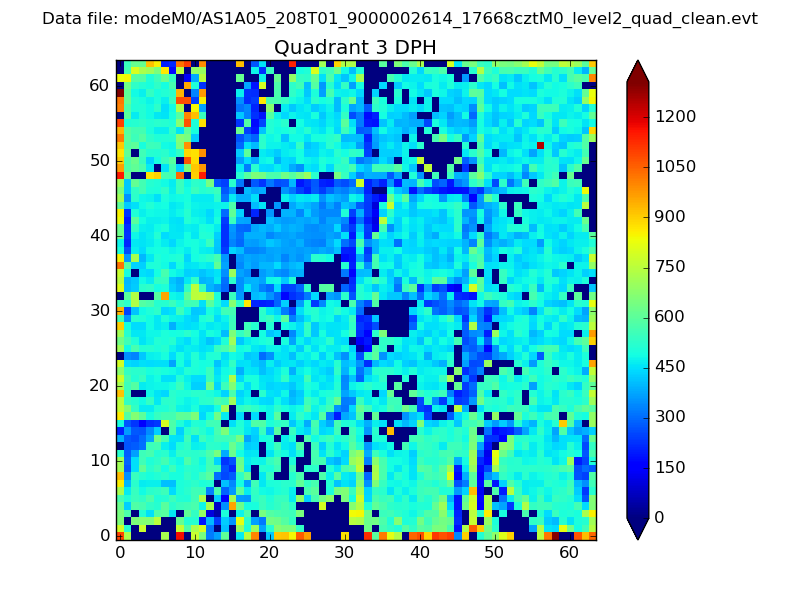 |
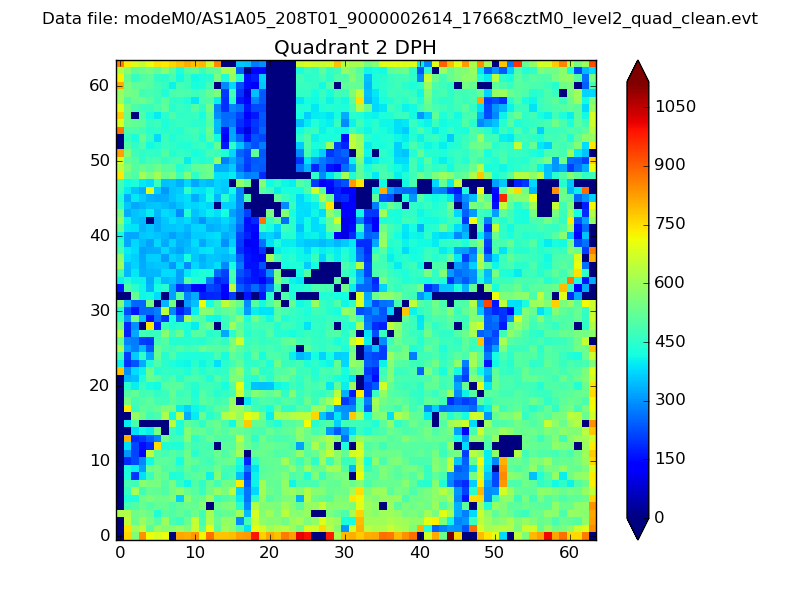 |
Quadrant C |
| Plot type | Count rate plots | Images |
|---|---|---|
| Comparison with Poisson distribution Blue bars denote a histogram of data divided into 1 sec bins. Red curve is a Poisson curve with rate = median count rate of data. |
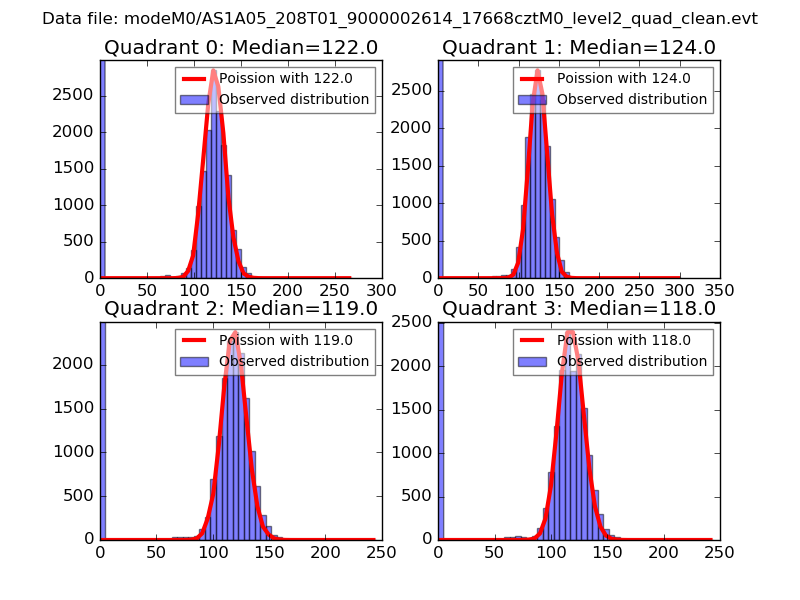 |
 |
| Quadrant-wise count rates Data is divided into 100 sec bins |
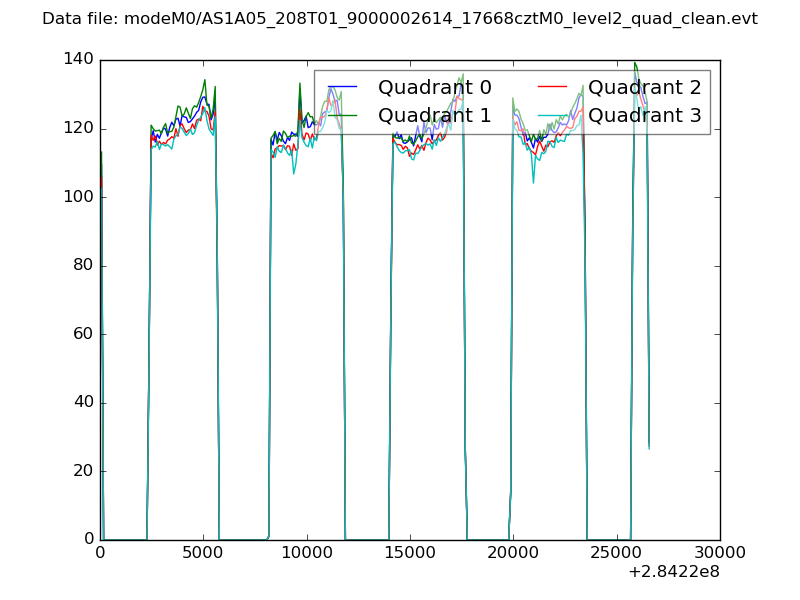 |
|
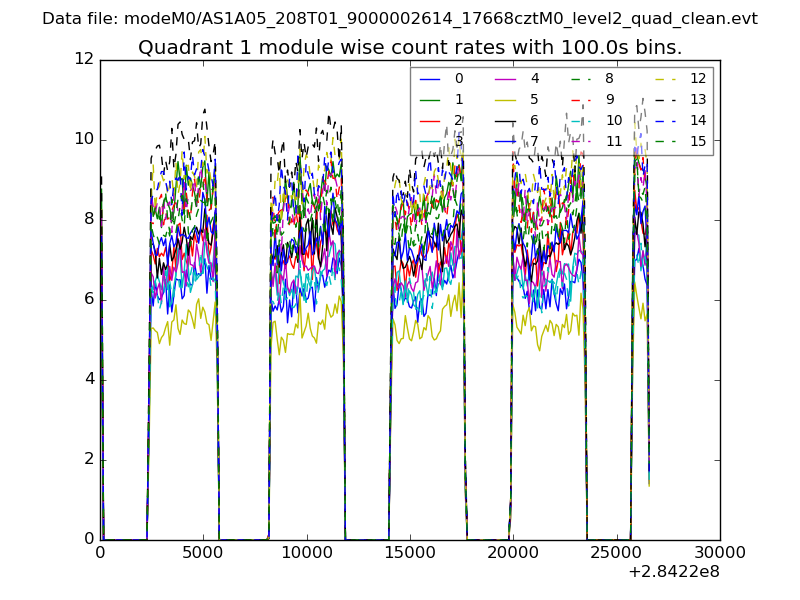
| Module-wise count rates for Quadrant A Data is divided into 100 sec bins |
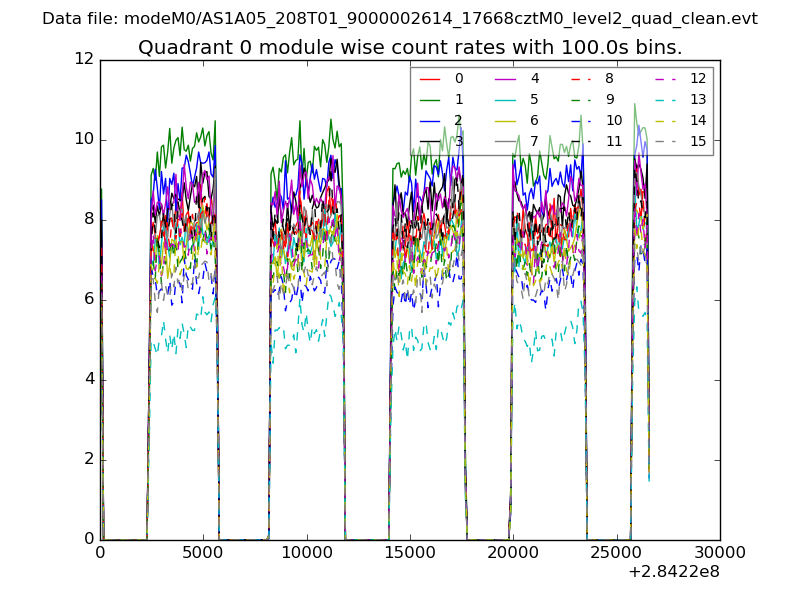 |
 |
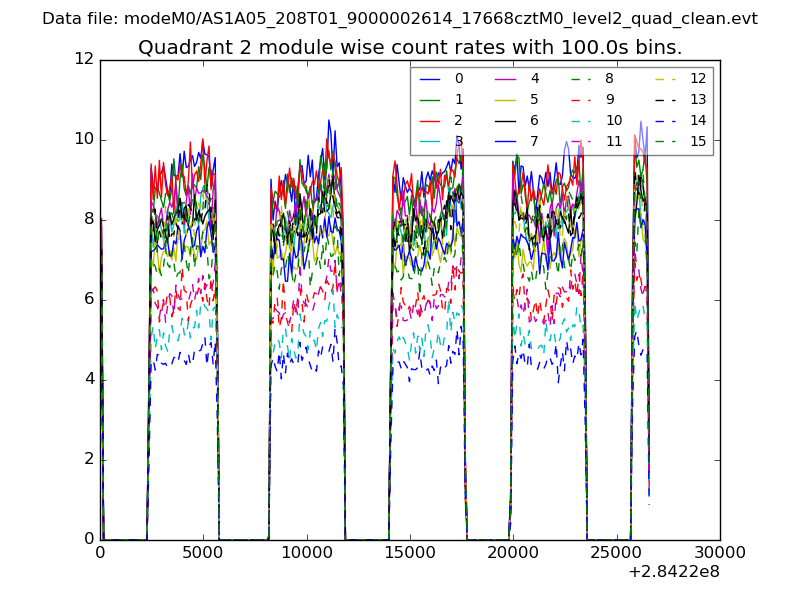
| Module-wise count rates for Quadrant B Data is divided into 100 sec bins |
 |
 |
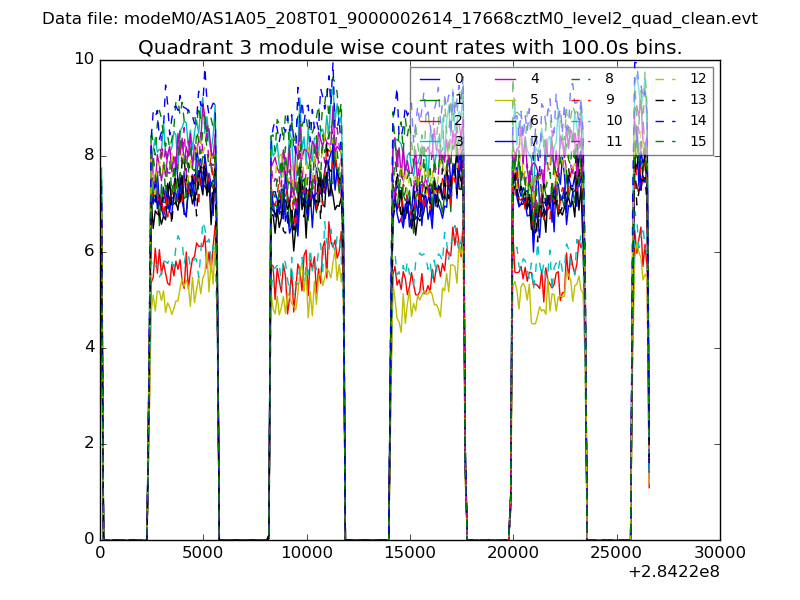
| Module-wise count rates for Quadrant C Data is divided into 100 sec bins |
 |
 |
| Module-wise count rates for Quadrant D Data is divided into 100 sec bins |
 |
 |
| Parameter | Plot |
|---|---|
| CZT HV Monitor | 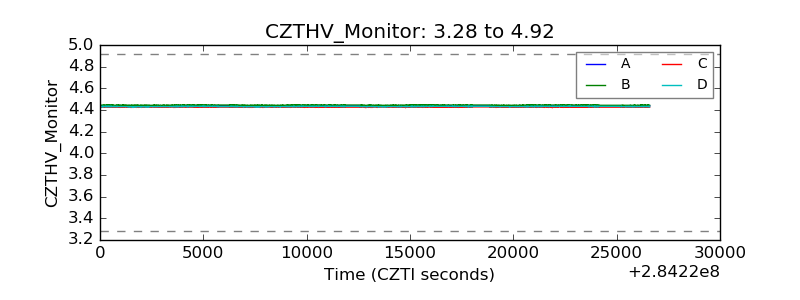 |
| D_VDD |  |
| Temperature 1 | 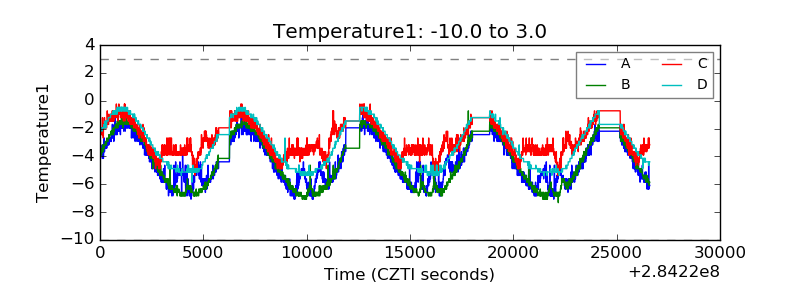 |
| Veto HV Monitor | 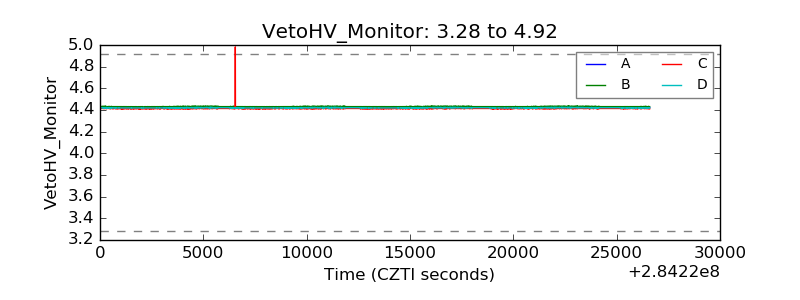 |
| Veto LLD | 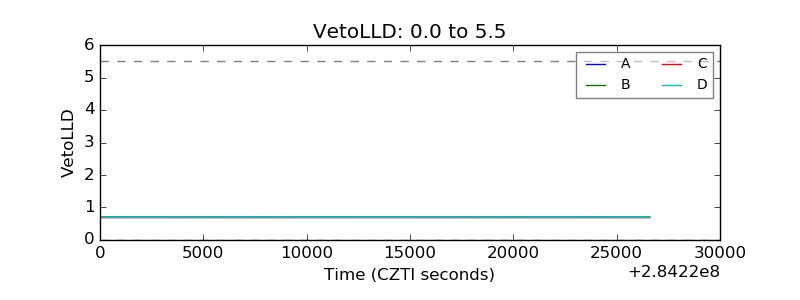 |
| Alpha Counter | 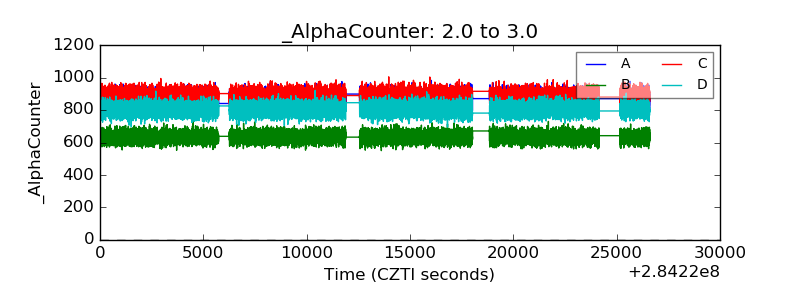 |
| _CPM_Rate | 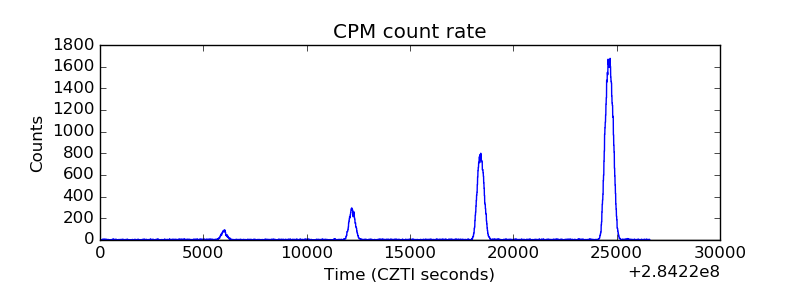 |
| CZT Counter | 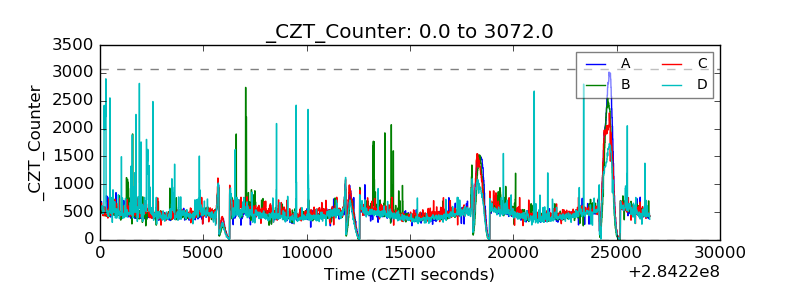 |
| +2.5 Volts monitor |  |
| +5 Volts monitor |  |
| _ROLL_ROT | 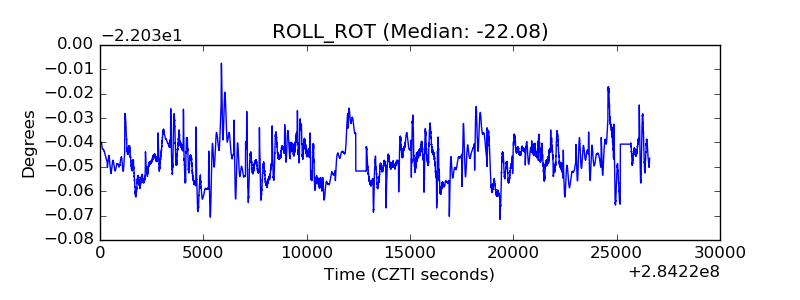 |
| _Roll_DEC |  |
| _Roll_RA | 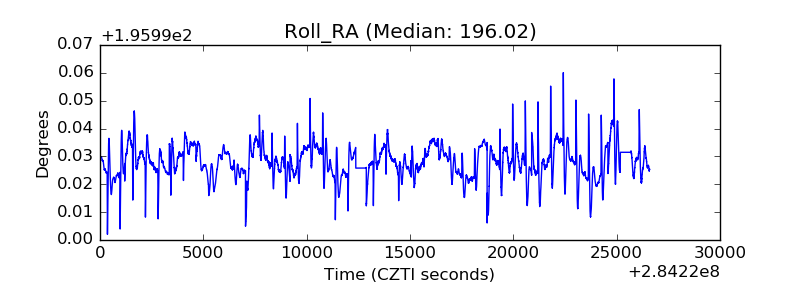 |
| Veto Counter | 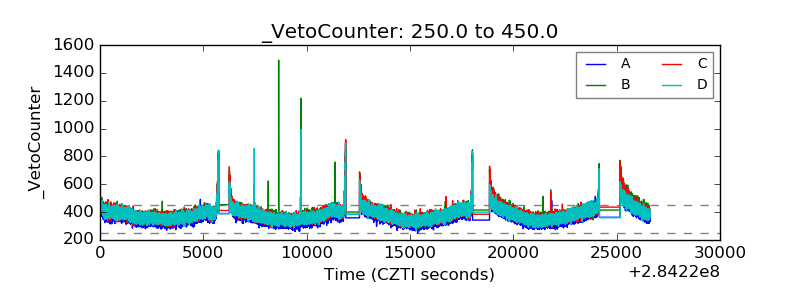 |