| Param | Original file | Final file |
|---|---|---|
| Filename | modeM0/AS1A05_208T01_9000002614_17671cztM0_level2.evt | modeM0/AS1A05_208T01_9000002614_17671cztM0_level2_quad_clean.evt |
| Size (bytes) | 458,075,520 | 103,210,560 |
| Size | 436.9 MB | 98.4 MB |
| Events in quadrant A | 3,163,159 | 677,943 |
| Events in quadrant B | 3,304,711 | 701,997 |
| Events in quadrant C | 3,437,034 | 662,465 |
| Events in quadrant D | 3,537,672 | 641,285 |
| Mode M9 | |||
|---|---|---|---|
| Quadrant | BADHDUFLAG | Total packets | Discarded packets |
| A | 0 | 16 | 0 |
| B | 0 | 17 | 0 |
| C | 0 | 17 | 0 |
| D | 0 | 17 | 0 |
| Mode M0 | |||
|---|---|---|---|
| Quadrant | BADHDUFLAG | Total packets | Discarded packets |
| A | 0 | 13474 | 2 |
| B | 0 | 13965 | 3 |
| C | 0 | 14211 | 2 |
| D | 0 | 14780 | 2 |
| Mode SS | |||
|---|---|---|---|
| Quadrant | BADHDUFLAG | Total packets | Discarded packets |
| A | 0 | 128 | 0 |
| B | 0 | 128 | 0 |
| C | 0 | 128 | 0 |
| D | 0 | 128 | 0 |
| Quadrant | Total seconds | Saturated seconds | Saturation percentage |
|---|---|---|---|
| A | 6338 | 34 | 0.536447% |
| B | 6337 | 81 | 1.278207% |
| C | 6337 | 66 | 1.041502% |
| D | 6337 | 113 | 1.783178% |
Noise dominated data is calculated using 1-second bins in cleaned event files. If a bin has >2000 counts, and if more than 50% of those come from <1% of pixels, then it is considered to be noise-dominated and hence unusable.
| Quadrant | # 1 sec bins | Bins with >0 counts | Bins with >2000 counts | High rate bins dominated by noise | Noise dominated (total time) | Noise dominated (detector-on time) | Marked lightcurve |
|---|---|---|---|---|---|---|---|
| A | 7563 | 6339 | 0 | 0 | 0.00% | 0.00% | 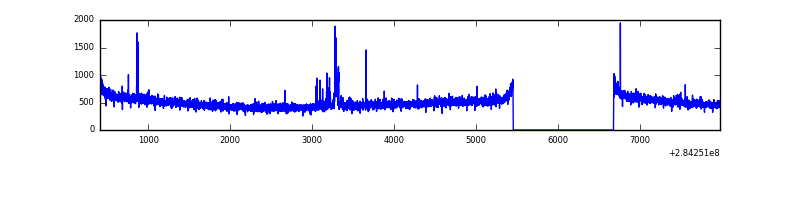 |
| B | 7562 | 6338 | 7 | 7 | 0.09% | 0.11% | 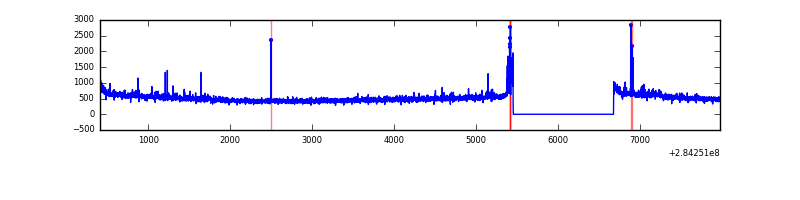 |
| C | 7562 | 6338 | 0 | 0 | 0.00% | 0.00% | 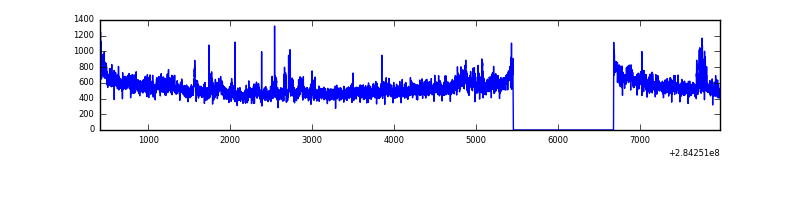 |
| D | 7562 | 6338 | 46 | 46 | 0.61% | 0.73% | 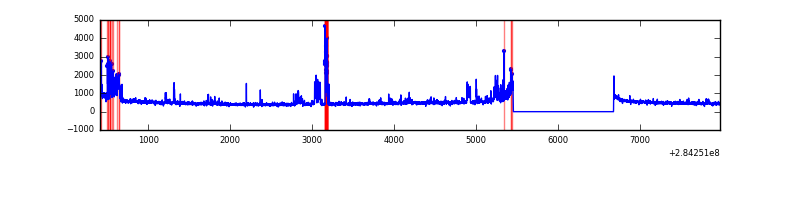 |
Top three noisy pixels from each quadrant. If the there are fewer than three noisy pixels in the level2.evt file, extra rows are filled as -1
| Pixel properties | Quadrant properties | ||||||
|---|---|---|---|---|---|---|---|
| Quadrant | DetID | PixID | Counts | Sigma | Mean | Median | Sigma |
| A | 8 | 205 | 49297 | 295.36 | 807 | 792 | 164.2 |
| A | 4 | 2 | 9355 | 52.14 | 807 | 792 | 164.2 |
| A | 0 | 226 | 7123 | 38.55 | 807 | 792 | 164.2 |
| B | 10 | 245 | 69139 | 445.43 | 812 | 796 | 153.4 |
| B | 0 | 189 | 28750 | 182.19 | 812 | 796 | 153.4 |
| B | 12 | 111 | 18053 | 112.47 | 812 | 796 | 153.4 |
| C | 3 | 233 | 238886 | 1312.48 | 777 | 783 | 181.4 |
| C | 14 | 238 | 121988 | 668.11 | 777 | 783 | 181.4 |
| C | 9 | 54 | 27933 | 149.66 | 777 | 783 | 181.4 |
| D | 5 | 222 | 432781 | 2310.88 | 771 | 751 | 187.0 |
| D | 7 | 238 | 133719 | 711.23 | 771 | 751 | 187.0 |
| D | 2 | 234 | 26573 | 138.12 | 771 | 751 | 187.0 |
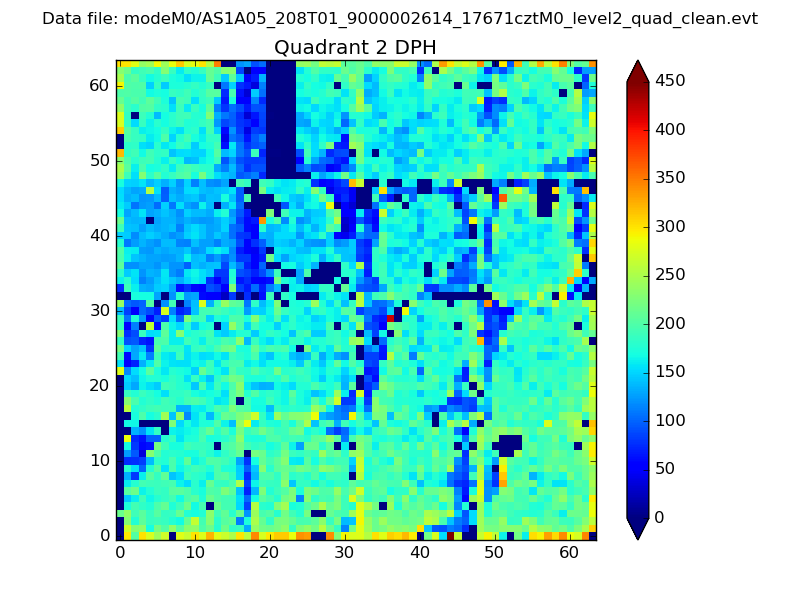
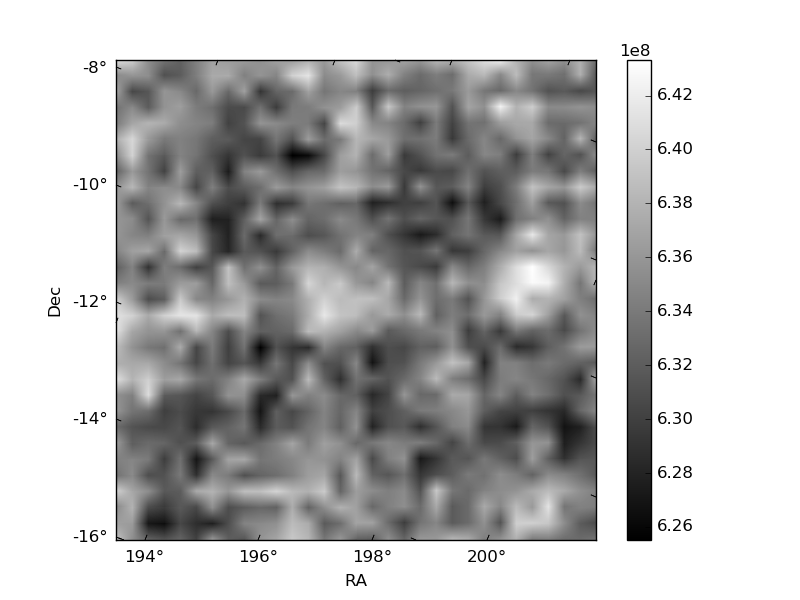
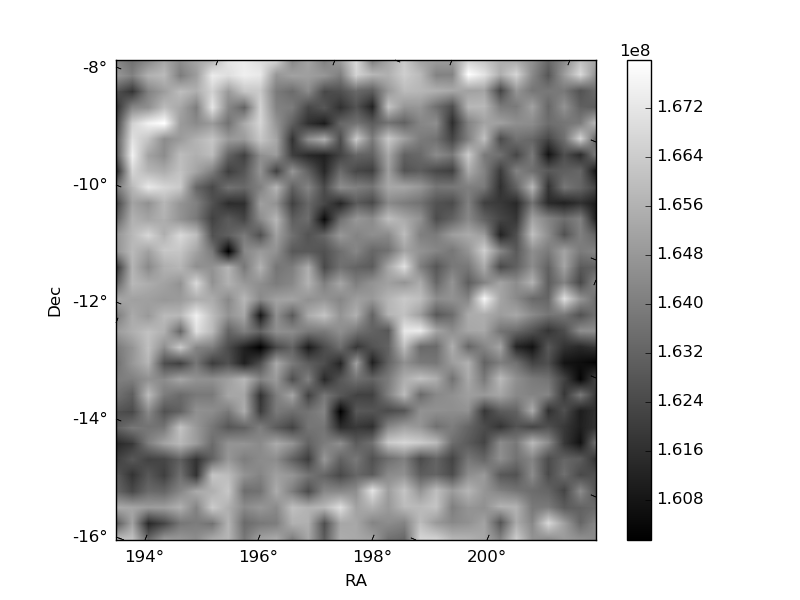
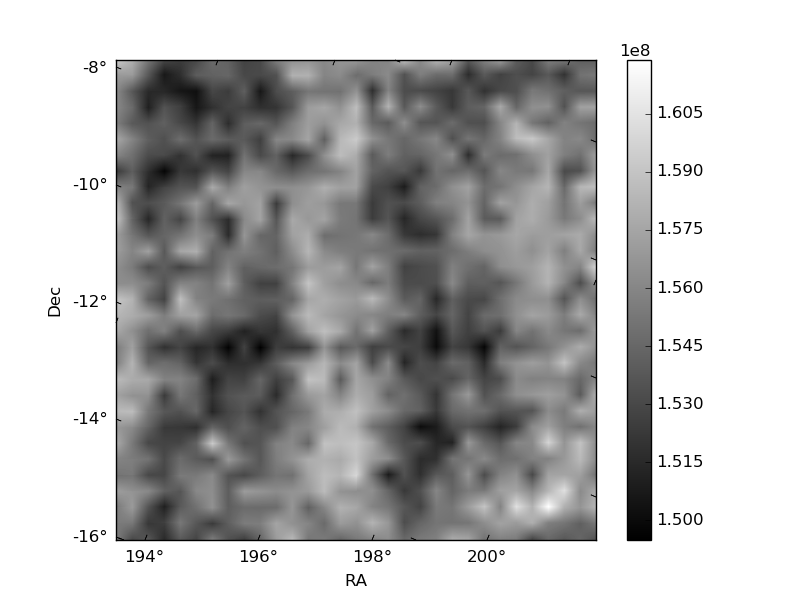
Histogram calculated using DETX and DETY for each event in the final _common_clean file
| Quadrant A | 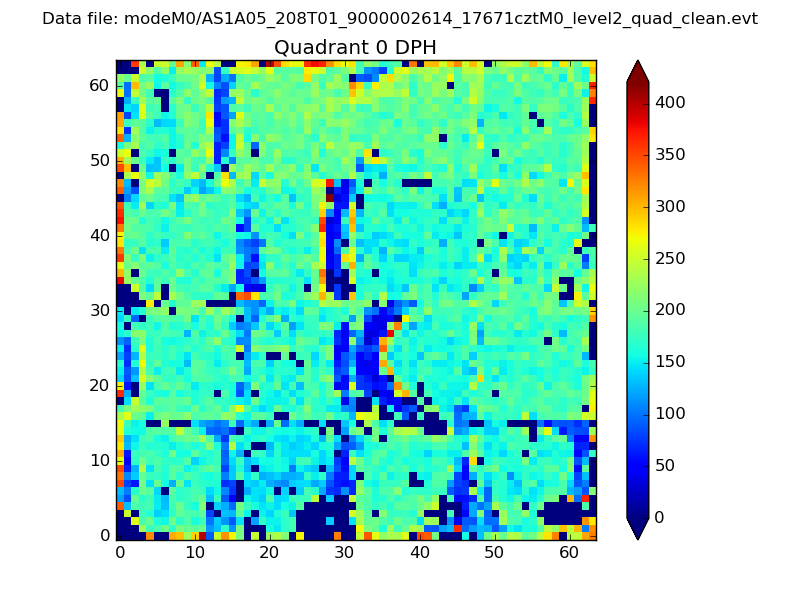 |
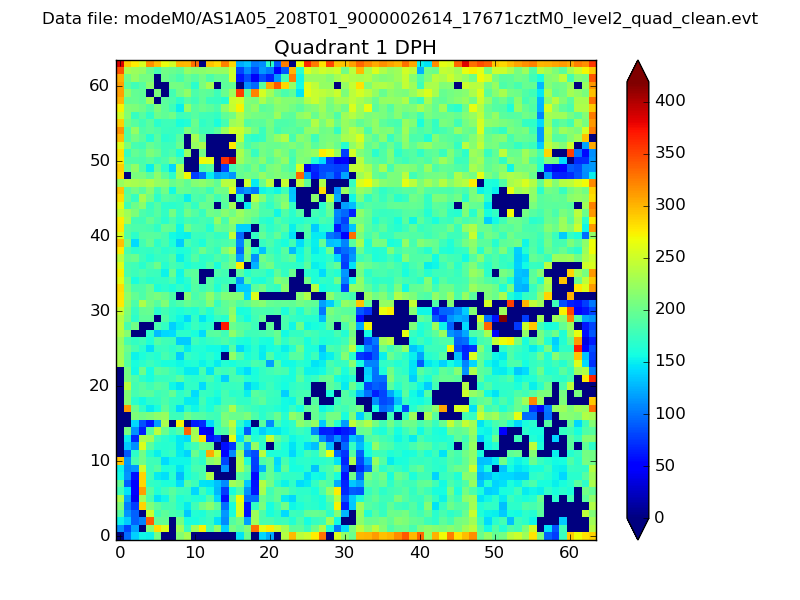 |
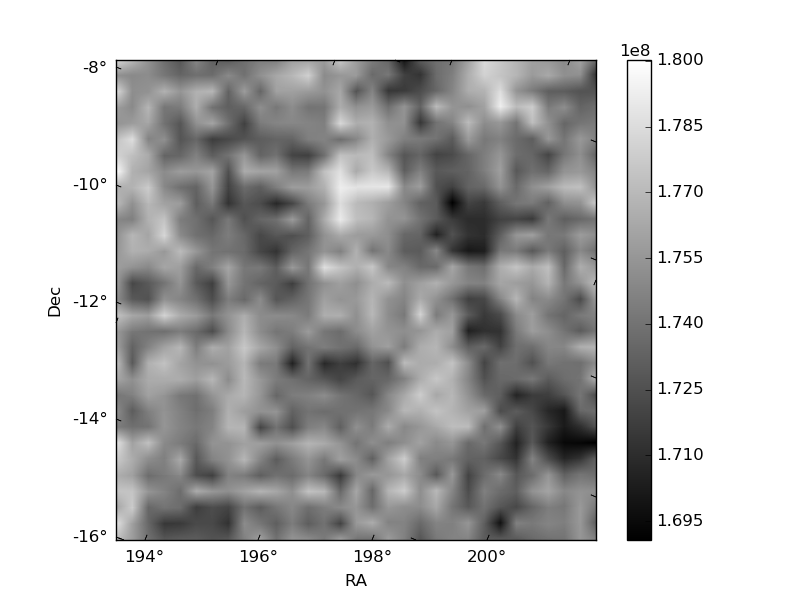
Quadrant B |
|---|---|---|---|
| Quadrant D | 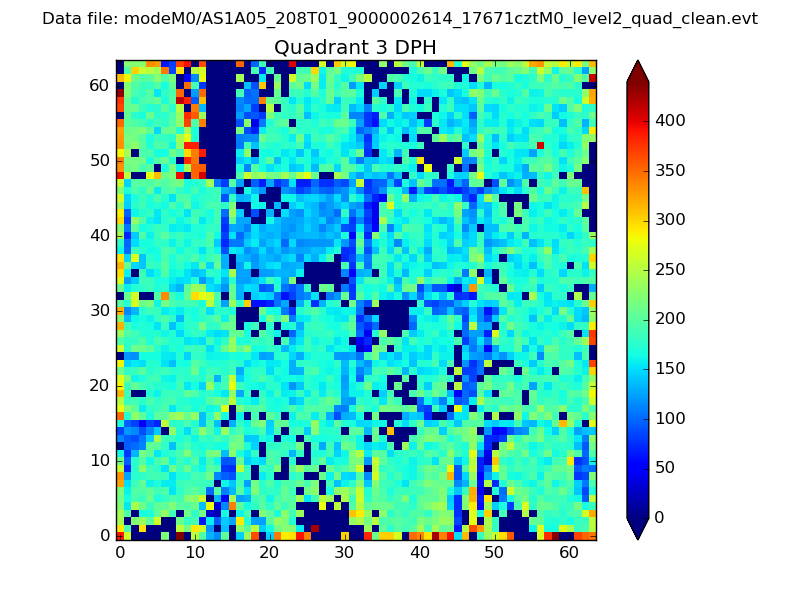 |
 |
Quadrant C |
| Plot type | Count rate plots | Images |
|---|---|---|
| Comparison with Poisson distribution Blue bars denote a histogram of data divided into 1 sec bins. Red curve is a Poisson curve with rate = median count rate of data. |
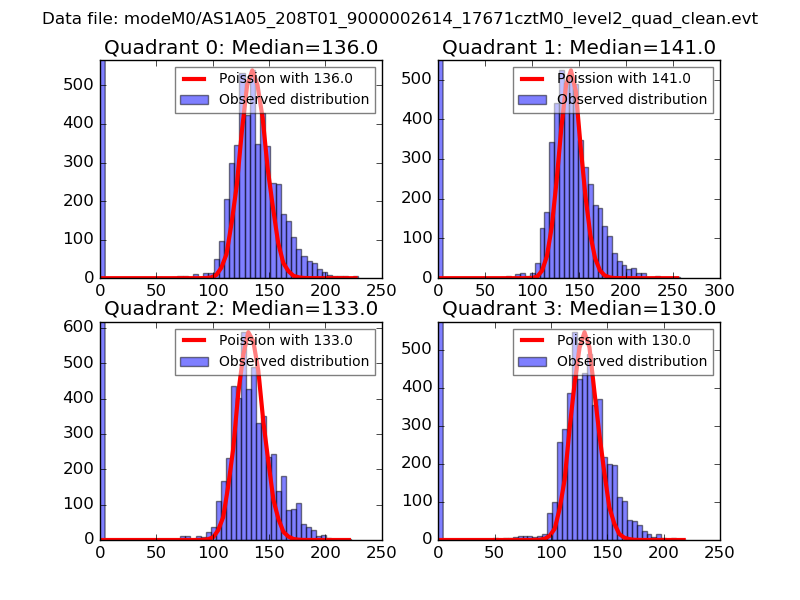 |
 |
| Quadrant-wise count rates Data is divided into 100 sec bins |
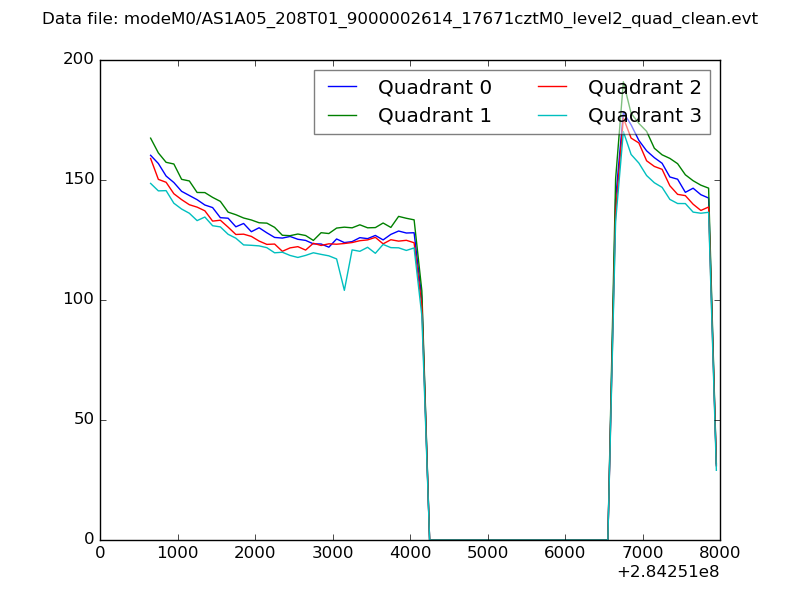 |
|
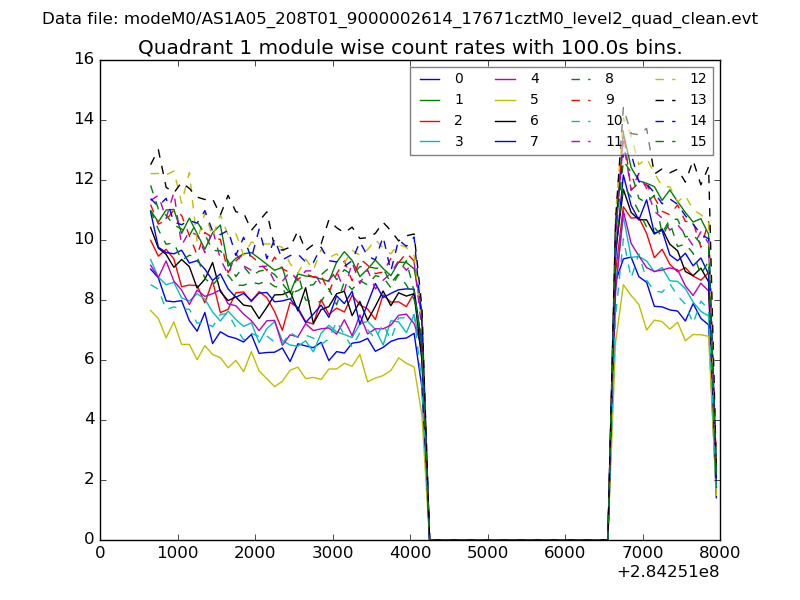
| Module-wise count rates for Quadrant A Data is divided into 100 sec bins |
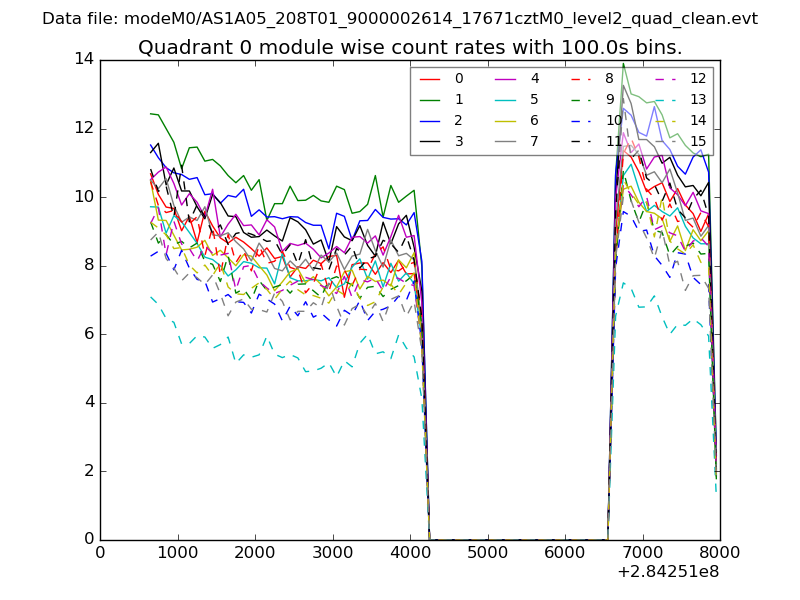 |
 |
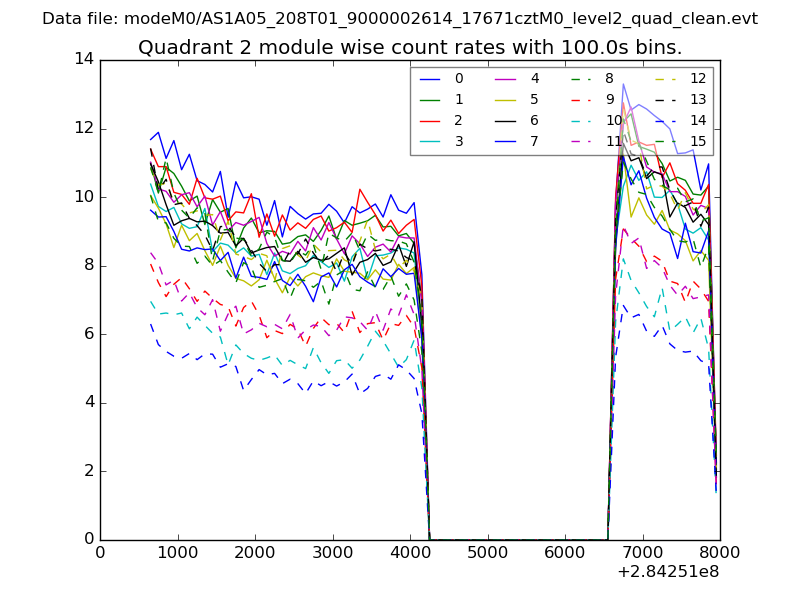
| Module-wise count rates for Quadrant B Data is divided into 100 sec bins |
 |
 |
| Module-wise count rates for Quadrant C Data is divided into 100 sec bins |
 |
 |
| Module-wise count rates for Quadrant D Data is divided into 100 sec bins |
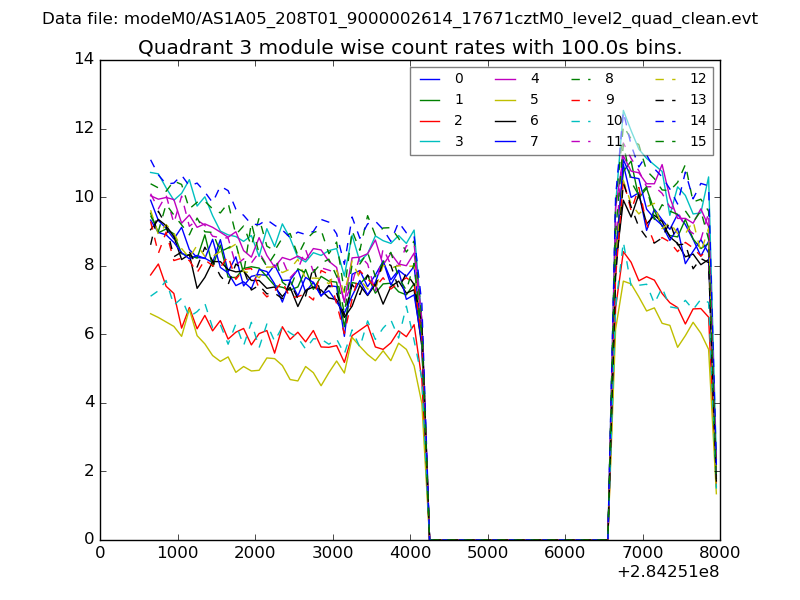 |
 |
| Parameter | Plot |
|---|---|
| CZT HV Monitor | 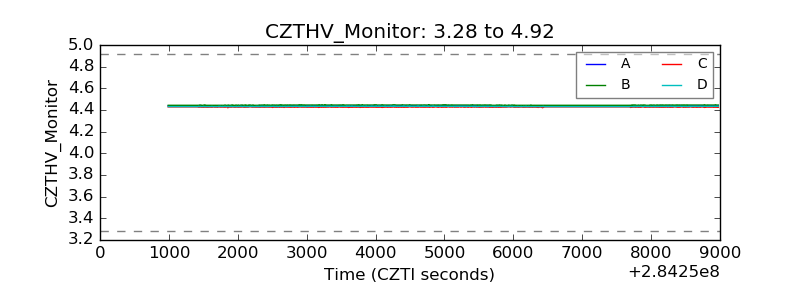 |
| D_VDD | 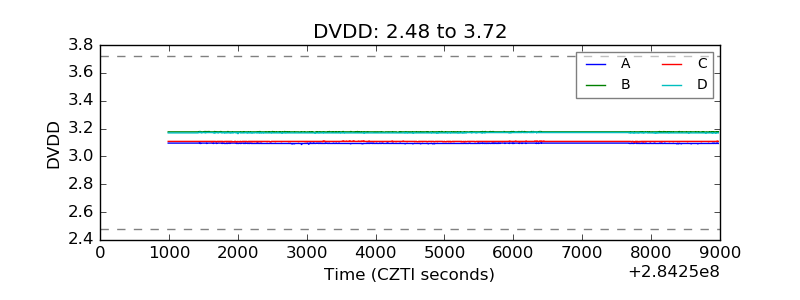 |
| Temperature 1 | 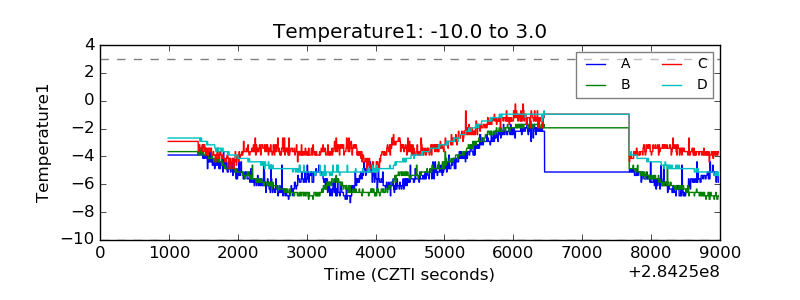 |
| Veto HV Monitor |  |
| Veto LLD | 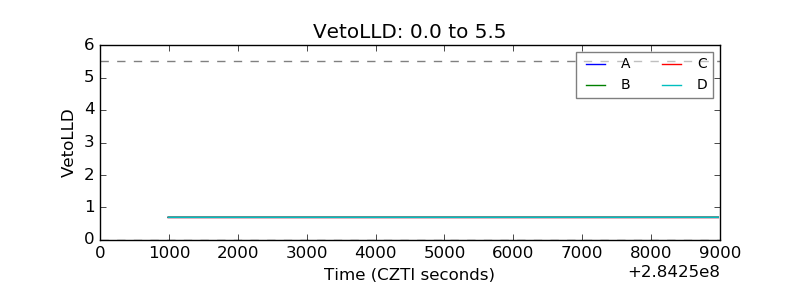 |
| Alpha Counter | 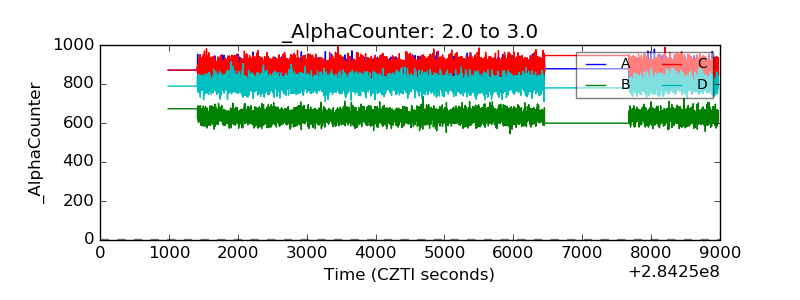 |
| _CPM_Rate | 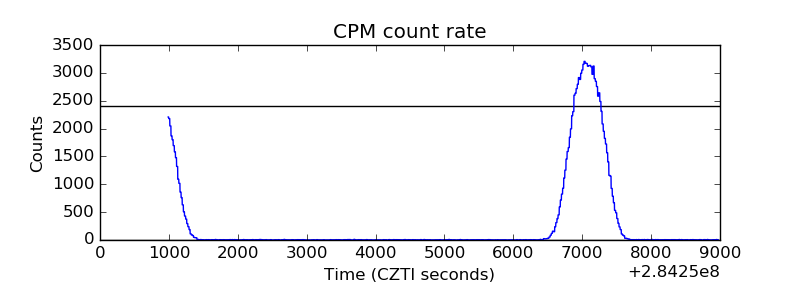 |
| CZT Counter | 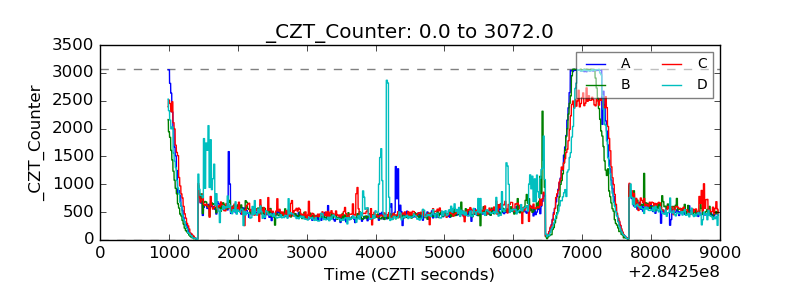 |
| +2.5 Volts monitor |  |
| +5 Volts monitor |  |
| _ROLL_ROT | 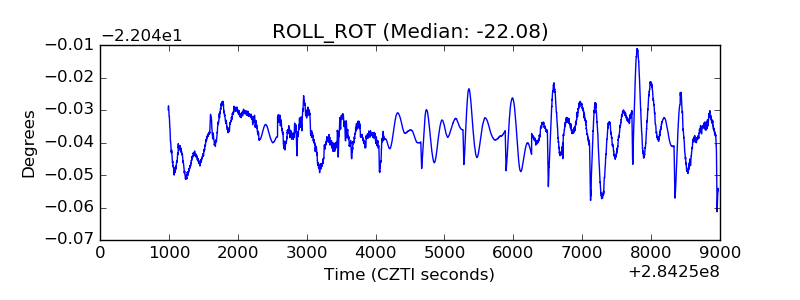 |
| _Roll_DEC | 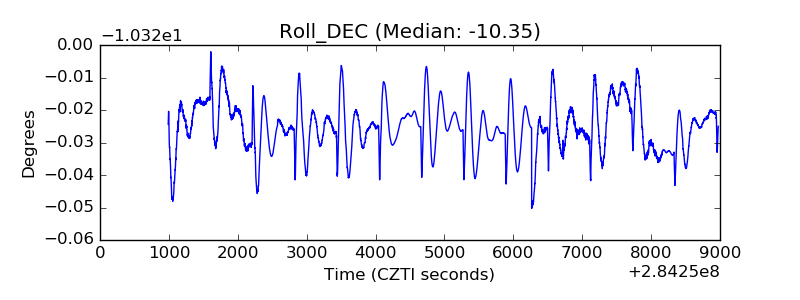 |
| _Roll_RA | 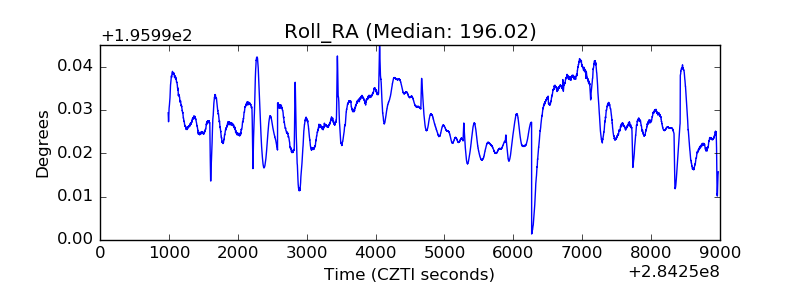 |
| Veto Counter | 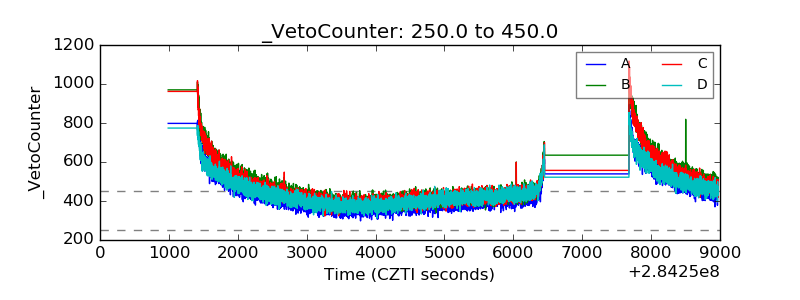 |