| Param | Original file | Final file |
|---|---|---|
| Filename | modeM0/AS1A05_208T01_9000002614_17672cztM0_level2.evt | modeM0/AS1A05_208T01_9000002614_17672cztM0_level2_quad_clean.evt |
| Size (bytes) | 486,829,440 | 111,421,440 |
| Size | 464.3 MB | 106.3 MB |
| Events in quadrant A | 3,364,572 | 738,587 |
| Events in quadrant B | 3,505,858 | 762,563 |
| Events in quadrant C | 4,023,162 | 718,275 |
| Events in quadrant D | 3,402,633 | 695,501 |
| Mode M9 | |||
|---|---|---|---|
| Quadrant | BADHDUFLAG | Total packets | Discarded packets |
| A | 0 | 19 | 0 |
| B | 0 | 20 | 0 |
| C | 0 | 20 | 0 |
| D | 0 | 20 | 0 |
| Mode M0 | |||
|---|---|---|---|
| Quadrant | BADHDUFLAG | Total packets | Discarded packets |
| A | 0 | 14078 | 2 |
| B | 0 | 14601 | 2 |
| C | 0 | 16581 | 2 |
| D | 0 | 14480 | 3 |
| Mode SS | |||
|---|---|---|---|
| Quadrant | BADHDUFLAG | Total packets | Discarded packets |
| A | 0 | 134 | 0 |
| B | 0 | 134 | 0 |
| C | 0 | 134 | 0 |
| D | 0 | 134 | 0 |
| Quadrant | Total seconds | Saturated seconds | Saturation percentage |
|---|---|---|---|
| A | 6593 | 28 | 0.424693% |
| B | 6593 | 70 | 1.061732% |
| C | 6593 | 90 | 1.365084% |
| D | 6592 | 46 | 0.697816% |
Noise dominated data is calculated using 1-second bins in cleaned event files. If a bin has >2000 counts, and if more than 50% of those come from <1% of pixels, then it is considered to be noise-dominated and hence unusable.
| Quadrant | # 1 sec bins | Bins with >0 counts | Bins with >2000 counts | High rate bins dominated by noise | Noise dominated (total time) | Noise dominated (detector-on time) | Marked lightcurve |
|---|---|---|---|---|---|---|---|
| A | 7903 | 6594 | 0 | 0 | 0.00% | 0.00% | 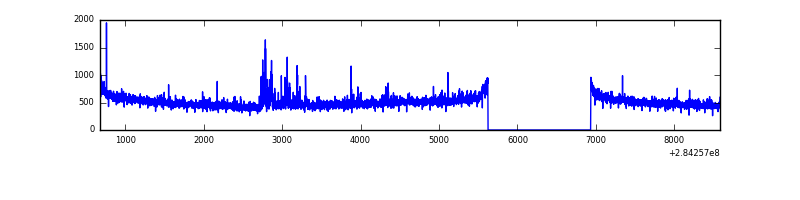 |
| B | 7903 | 6594 | 16 | 16 | 0.20% | 0.24% | 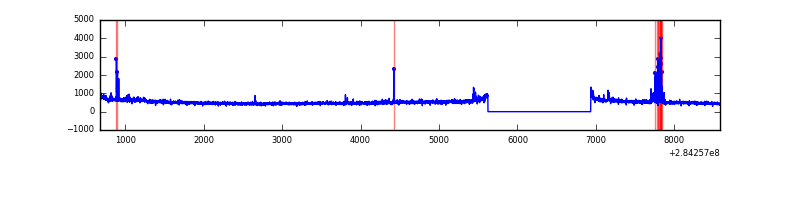 |
| C | 7903 | 6594 | 1 | 1 | 0.01% | 0.02% | 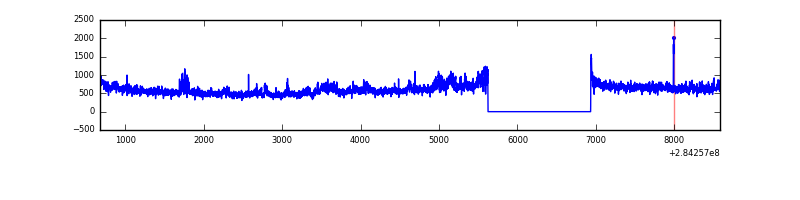 |
| D | 7902 | 6593 | 28 | 28 | 0.35% | 0.42% |  |
Top three noisy pixels from each quadrant. If the there are fewer than three noisy pixels in the level2.evt file, extra rows are filled as -1
| Pixel properties | Quadrant properties | ||||||
|---|---|---|---|---|---|---|---|
| Quadrant | DetID | PixID | Counts | Sigma | Mean | Median | Sigma |
| A | 8 | 205 | 94053 | 547.6 | 847 | 832 | 170.2 |
| A | 0 | 226 | 7413 | 38.66 | 847 | 832 | 170.2 |
| A | 15 | 174 | 7303 | 38.01 | 847 | 832 | 170.2 |
| B | 10 | 245 | 111724 | 691.54 | 856 | 836 | 160.3 |
| B | 12 | 111 | 18660 | 111.16 | 856 | 836 | 160.3 |
| B | 0 | 189 | 16997 | 100.79 | 856 | 836 | 160.3 |
| C | 3 | 233 | 637702 | 3342.74 | 817 | 826 | 190.5 |
| C | 14 | 238 | 127640 | 665.6 | 817 | 826 | 190.5 |
| C | 5 | 218 | 38644 | 198.49 | 817 | 826 | 190.5 |
| D | 5 | 222 | 224596 | 1140.98 | 815 | 797 | 196.1 |
| D | 1 | 52 | 58373 | 293.54 | 815 | 797 | 196.1 |
| D | 2 | 234 | 25618 | 126.54 | 815 | 797 | 196.1 |
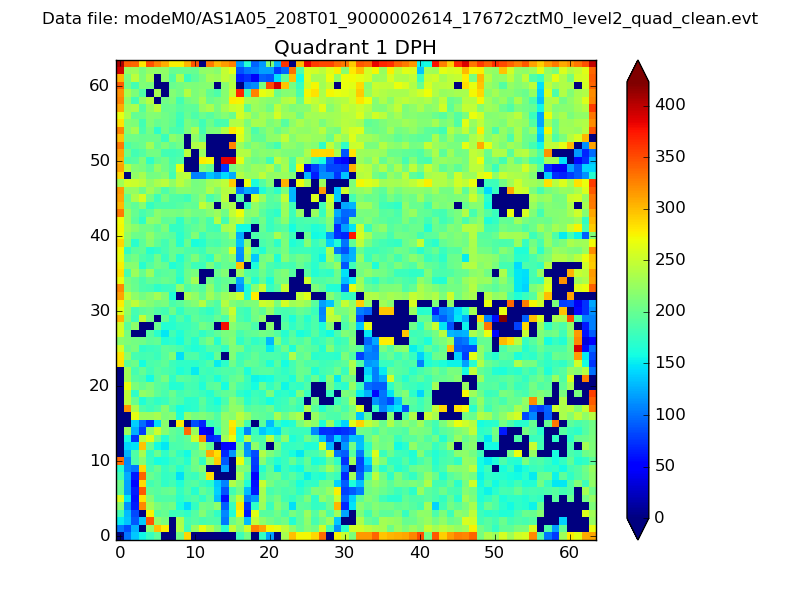
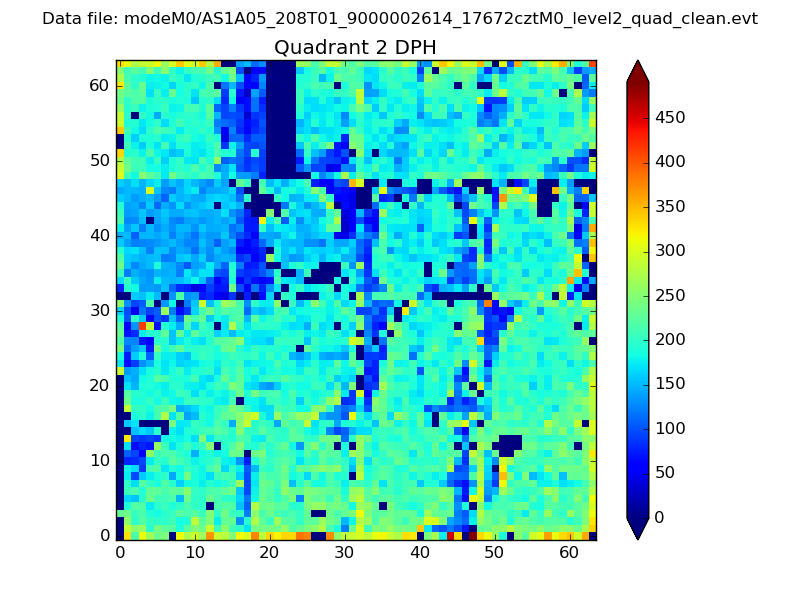
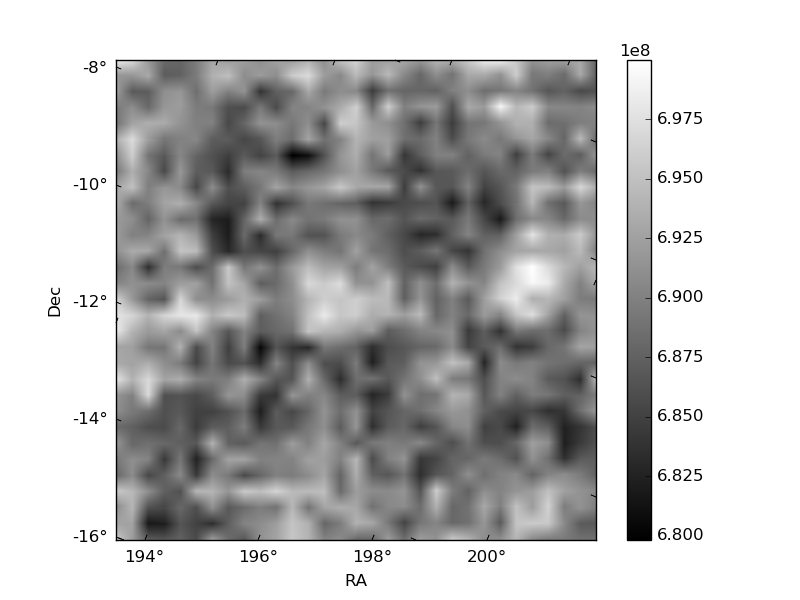
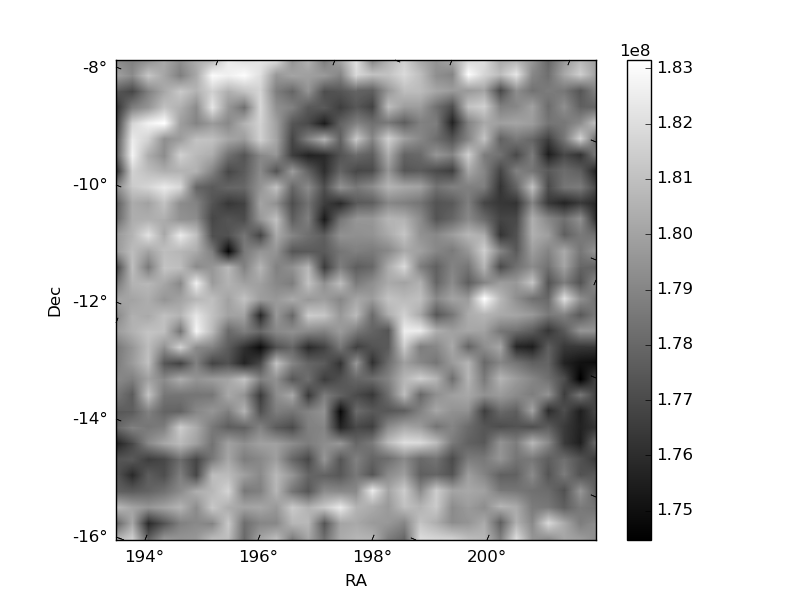
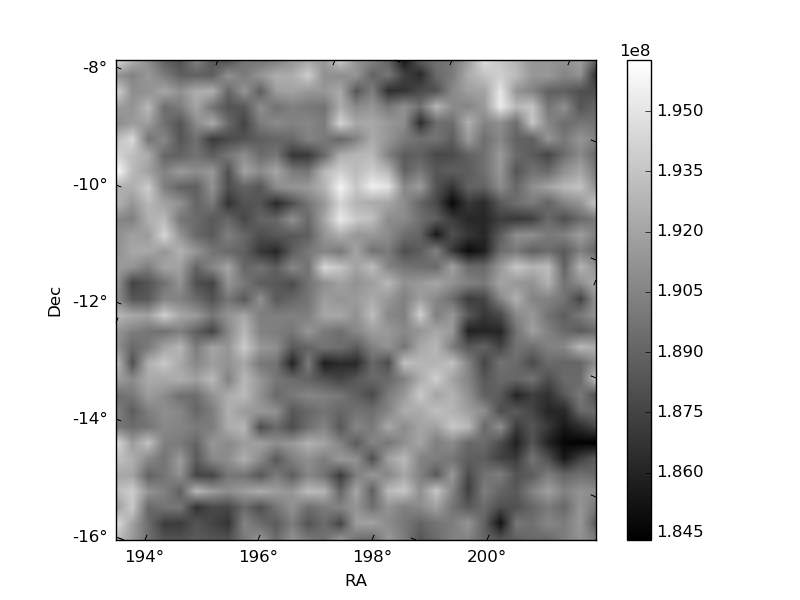
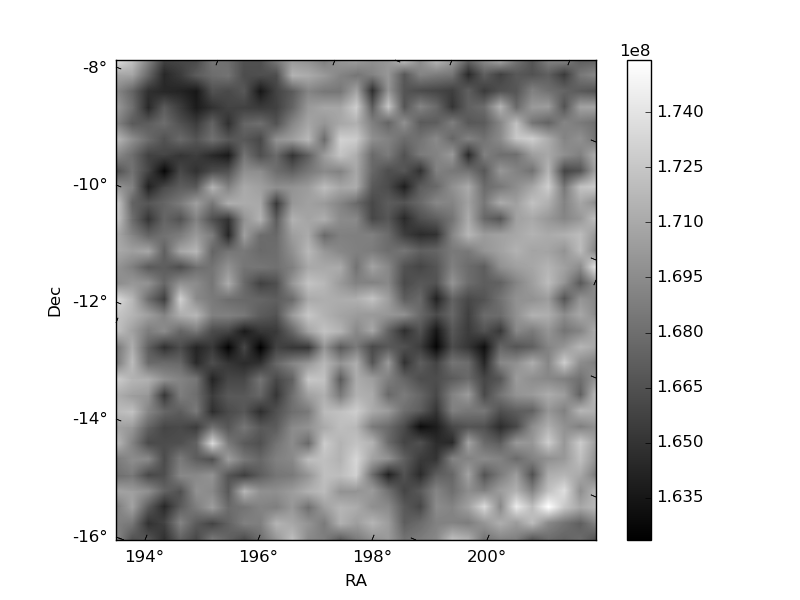
Histogram calculated using DETX and DETY for each event in the final _common_clean file
| Quadrant A | 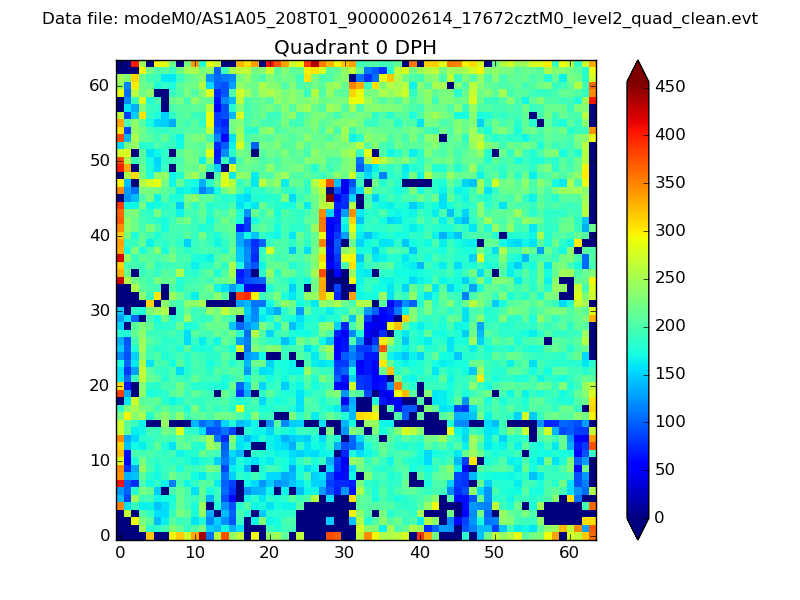 |
 |
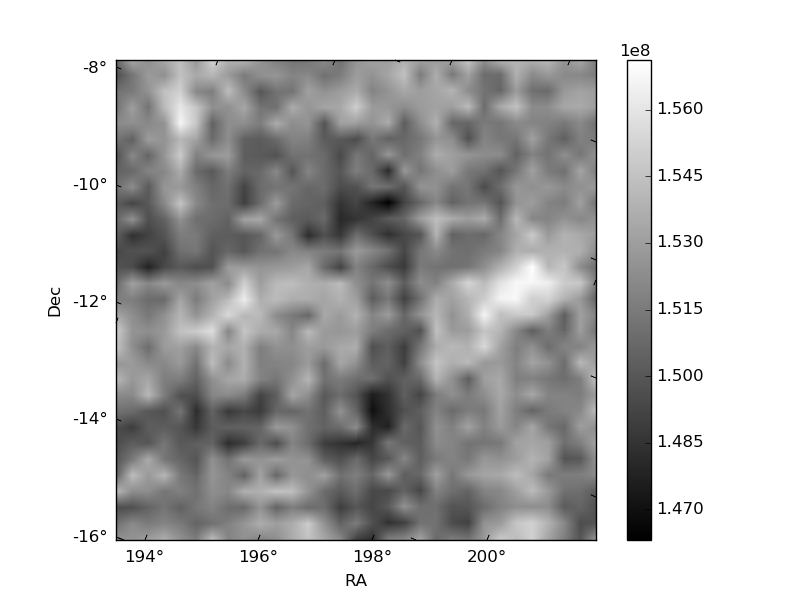
Quadrant B |
|---|---|---|---|
| Quadrant D | 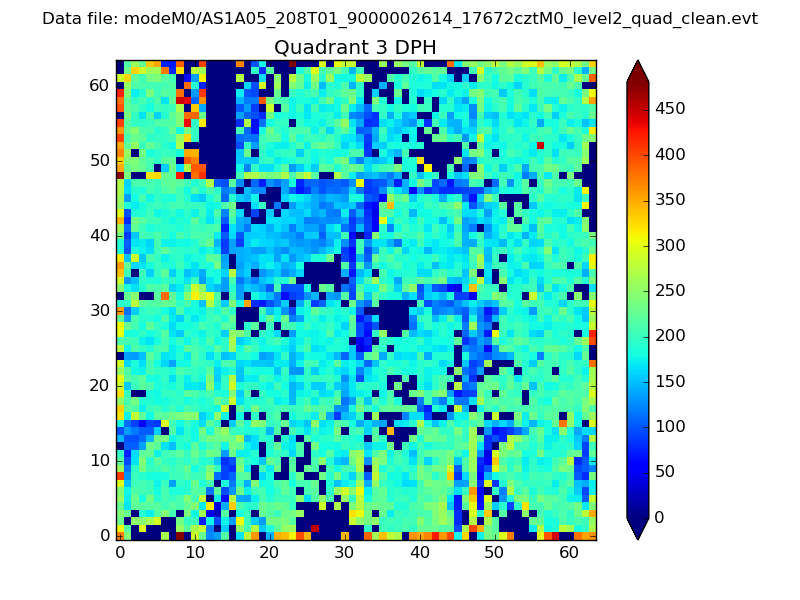 |
 |
Quadrant C |
| Plot type | Count rate plots | Images |
|---|---|---|
| Comparison with Poisson distribution Blue bars denote a histogram of data divided into 1 sec bins. Red curve is a Poisson curve with rate = median count rate of data. |
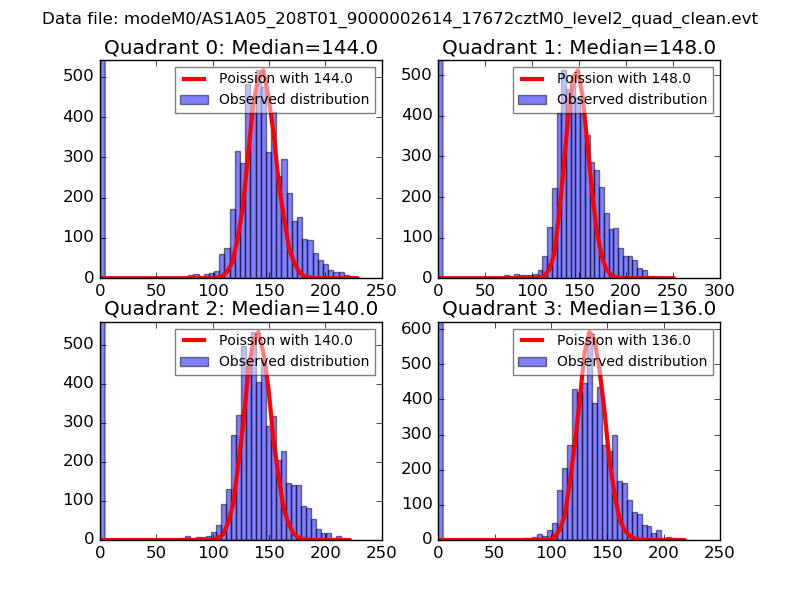 |
 |
| Quadrant-wise count rates Data is divided into 100 sec bins |
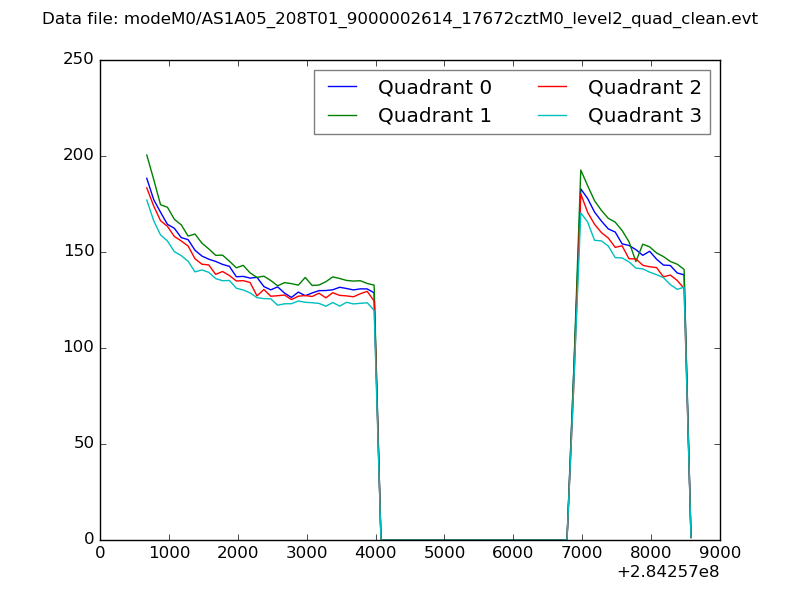 |
|
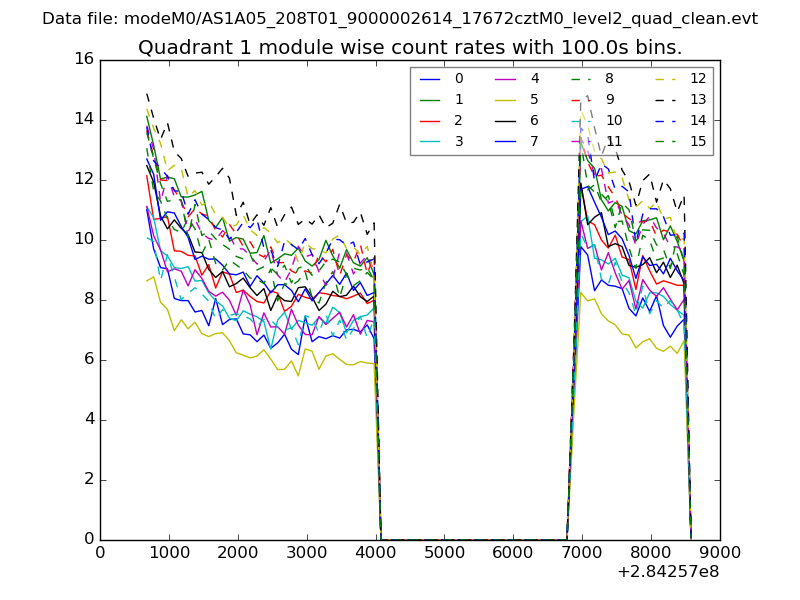
| Module-wise count rates for Quadrant A Data is divided into 100 sec bins |
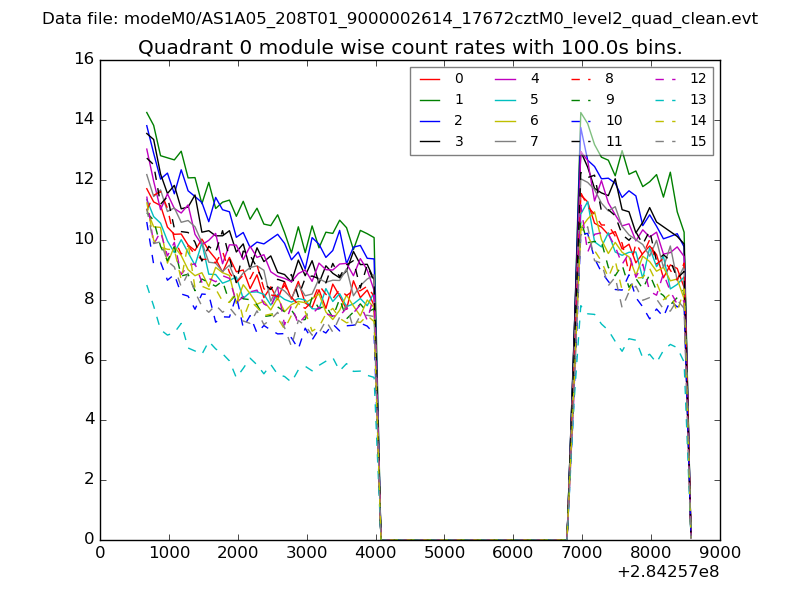 |
 |
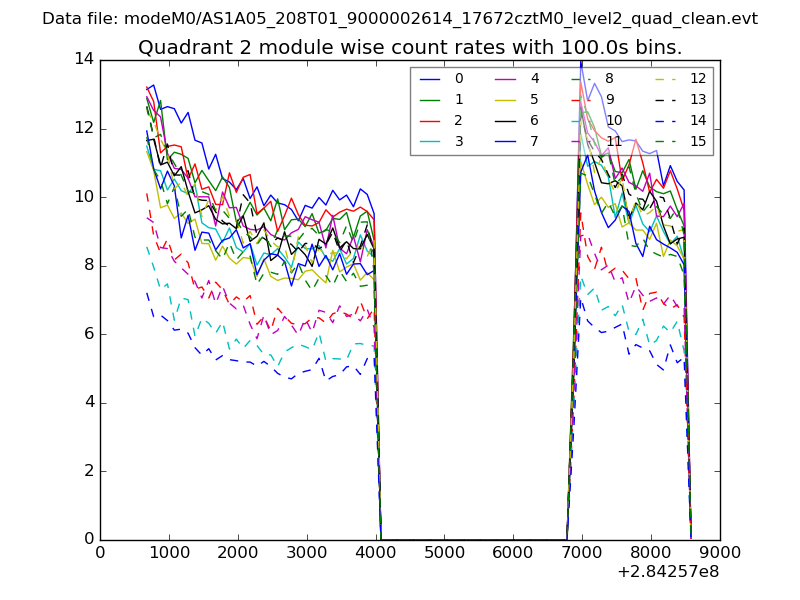
| Module-wise count rates for Quadrant B Data is divided into 100 sec bins |
 |
 |
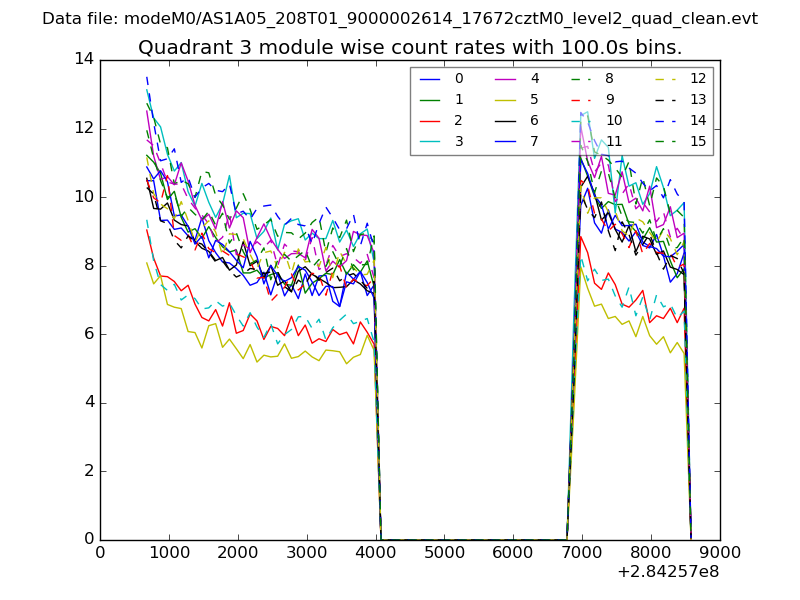
| Module-wise count rates for Quadrant C Data is divided into 100 sec bins |
 |
 |
| Module-wise count rates for Quadrant D Data is divided into 100 sec bins |
 |
 |
| Parameter | Plot |
|---|---|
| CZT HV Monitor | 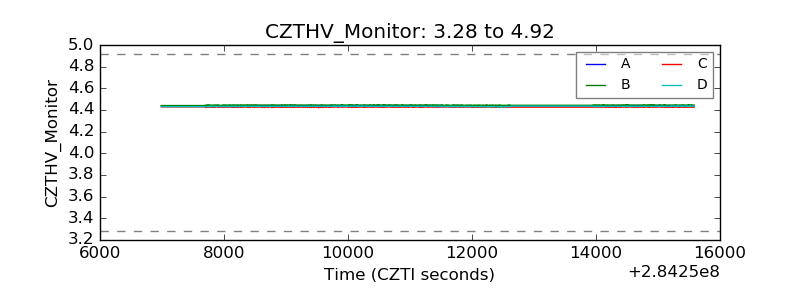 |
| D_VDD |  |
| Temperature 1 | 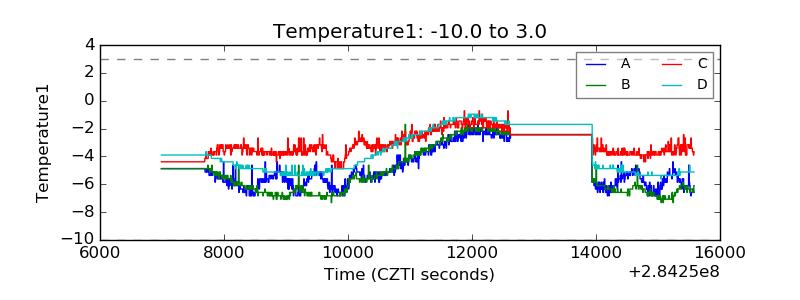 |
| Veto HV Monitor |  |
| Veto LLD | 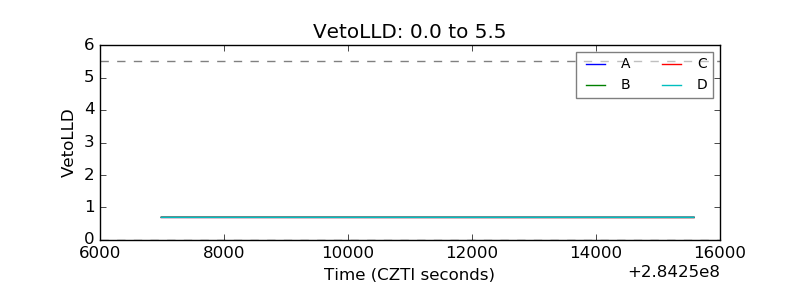 |
| Alpha Counter | 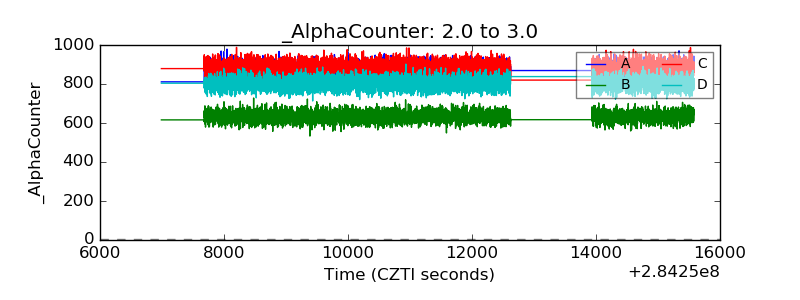 |
| _CPM_Rate | 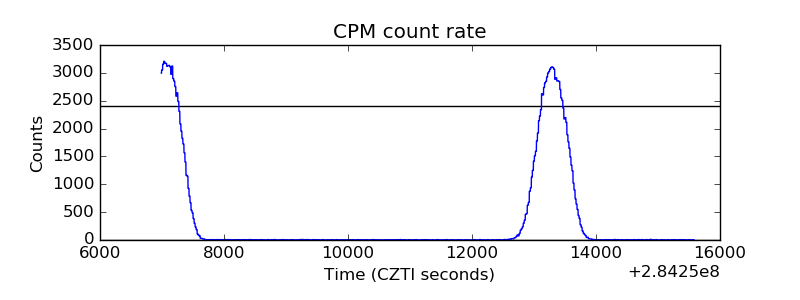 |
| CZT Counter | 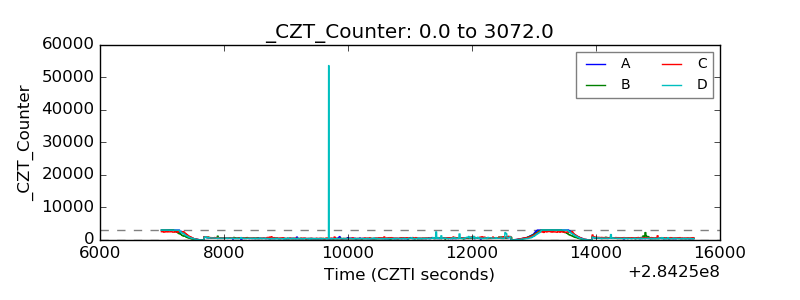 |
| +2.5 Volts monitor |  |
| +5 Volts monitor |  |
| _ROLL_ROT | 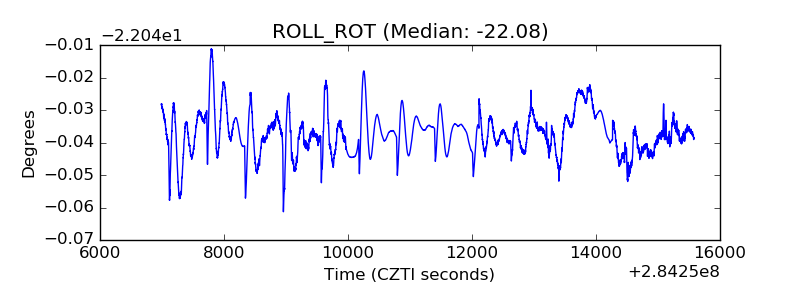 |
| _Roll_DEC | 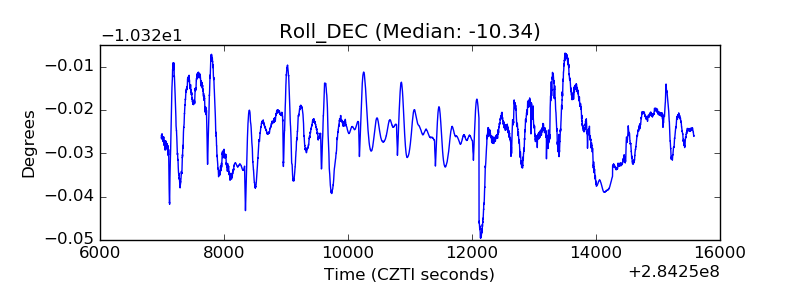 |
| _Roll_RA |  |
| Veto Counter | 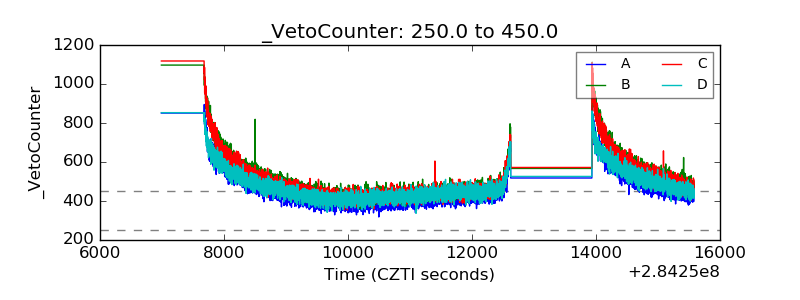 |