| Param | Original file | Final file |
|---|---|---|
| Filename | modeM0/AS1A05_208T01_9000002614_17675cztM0_level2.evt | modeM0/AS1A05_208T01_9000002614_17675cztM0_level2_quad_clean.evt |
| Size (bytes) | 474,039,360 | 94,086,720 |
| Size | 452.1 MB | 89.7 MB |
| Events in quadrant A | 3,358,130 | 599,960 |
| Events in quadrant B | 3,550,608 | 616,180 |
| Events in quadrant C | 3,785,117 | 589,466 |
| Events in quadrant D | 3,208,181 | 577,532 |
| Mode M9 | |||
|---|---|---|---|
| Quadrant | BADHDUFLAG | Total packets | Discarded packets |
| A | 0 | 15 | 0 |
| B | 0 | 16 | 0 |
| C | 0 | 16 | 0 |
| D | 0 | 16 | 0 |
| Mode M0 | |||
|---|---|---|---|
| Quadrant | BADHDUFLAG | Total packets | Discarded packets |
| A | 0 | 13976 | 2 |
| B | 0 | 14751 | 2 |
| C | 0 | 15381 | 2 |
| D | 0 | 13961 | 2 |
| Mode SS | |||
|---|---|---|---|
| Quadrant | BADHDUFLAG | Total packets | Discarded packets |
| A | 0 | 136 | 0 |
| B | 0 | 136 | 0 |
| C | 0 | 136 | 0 |
| D | 0 | 136 | 0 |
| Quadrant | Total seconds | Saturated seconds | Saturation percentage |
|---|---|---|---|
| A | 6686 | 56 | 0.837571% |
| B | 6686 | 131 | 1.959318% |
| C | 6686 | 103 | 1.540532% |
| D | 6686 | 47 | 0.702961% |
Noise dominated data is calculated using 1-second bins in cleaned event files. If a bin has >2000 counts, and if more than 50% of those come from <1% of pixels, then it is considered to be noise-dominated and hence unusable.
| Quadrant | # 1 sec bins | Bins with >0 counts | Bins with >2000 counts | High rate bins dominated by noise | Noise dominated (total time) | Noise dominated (detector-on time) | Marked lightcurve |
|---|---|---|---|---|---|---|---|
| A | 7746 | 6687 | 0 | 0 | 0.00% | 0.00% | 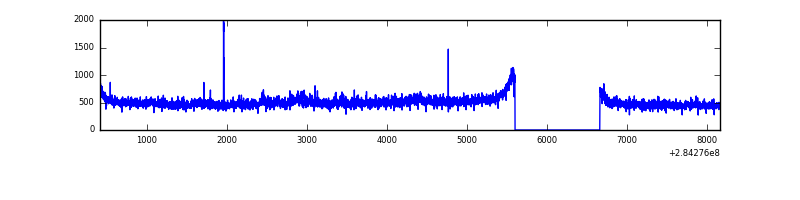 |
| B | 7746 | 6687 | 69 | 69 | 0.89% | 1.03% | 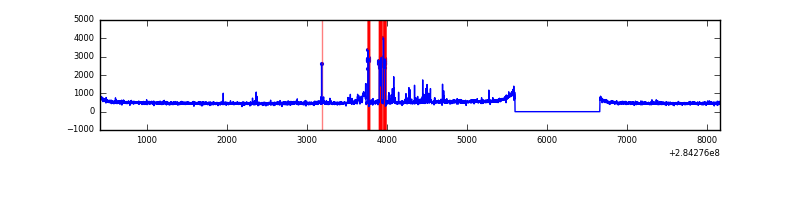 |
| C | 7746 | 6687 | 0 | 0 | 0.00% | 0.00% | 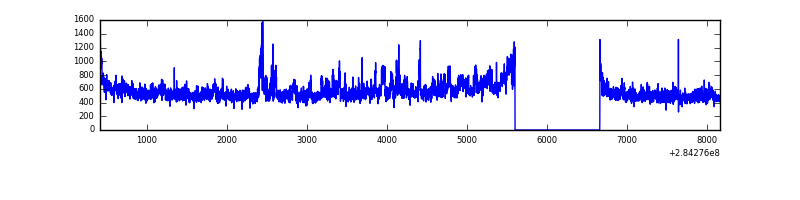 |
| D | 7746 | 6687 | 9 | 9 | 0.12% | 0.13% | 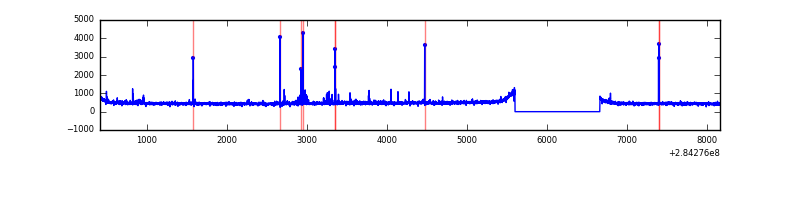 |
Top three noisy pixels from each quadrant. If the there are fewer than three noisy pixels in the level2.evt file, extra rows are filled as -1
| Pixel properties | Quadrant properties | ||||||
|---|---|---|---|---|---|---|---|
| Quadrant | DetID | PixID | Counts | Sigma | Mean | Median | Sigma |
| A | 14 | 237 | 125811 | 736.39 | 838 | 821 | 169.7 |
| A | 4 | 2 | 9439 | 50.77 | 838 | 821 | 169.7 |
| A | 0 | 226 | 7299 | 38.17 | 838 | 821 | 169.7 |
| B | 10 | 245 | 273081 | 1706.5 | 830 | 809 | 159.5 |
| B | 12 | 111 | 18561 | 111.26 | 830 | 809 | 159.5 |
| B | 11 | 111 | 16231 | 96.66 | 830 | 809 | 159.5 |
| C | 3 | 233 | 504780 | 2646.63 | 808 | 813 | 190.4 |
| C | 14 | 238 | 124556 | 649.85 | 808 | 813 | 190.4 |
| C | 13 | 61 | 5697 | 25.65 | 808 | 813 | 190.4 |
| D | 1 | 52 | 63151 | 308.66 | 822 | 800 | 202.0 |
| D | 2 | 234 | 26820 | 128.81 | 822 | 800 | 202.0 |
| D | 10 | 70 | 18432 | 87.28 | 822 | 800 | 202.0 |
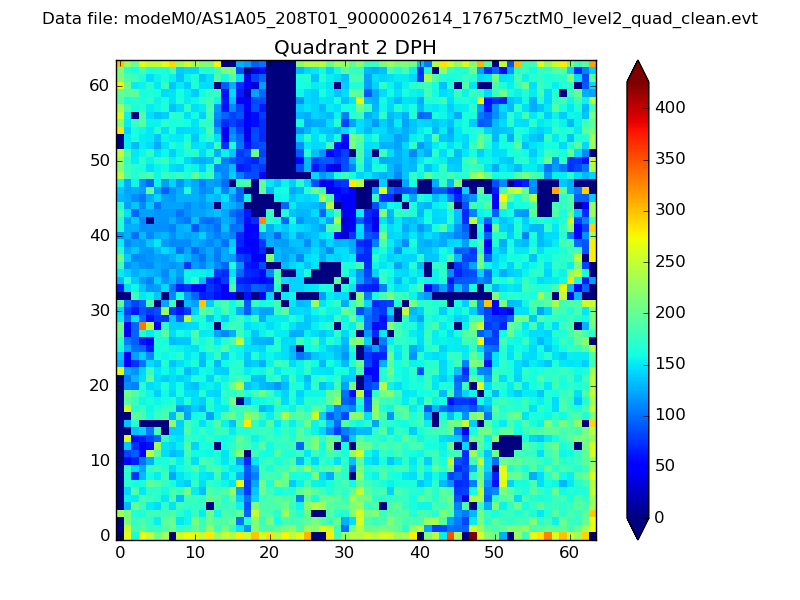
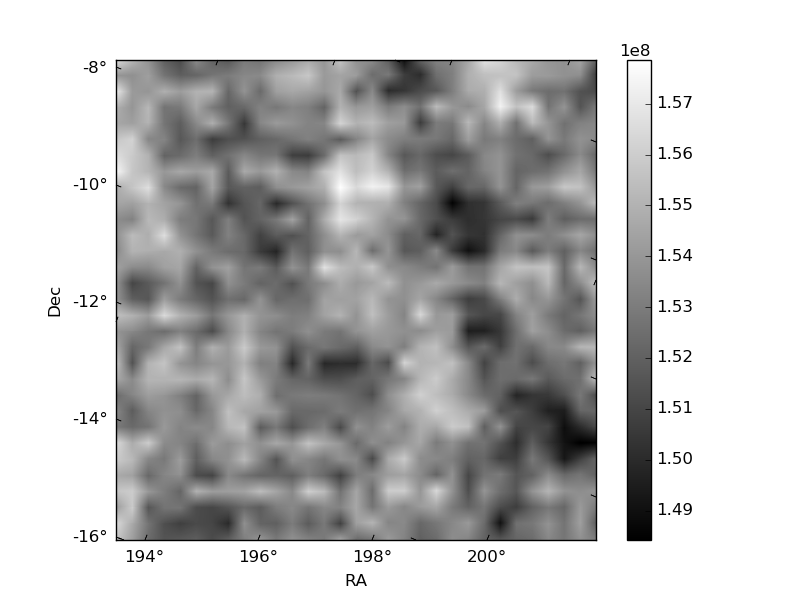
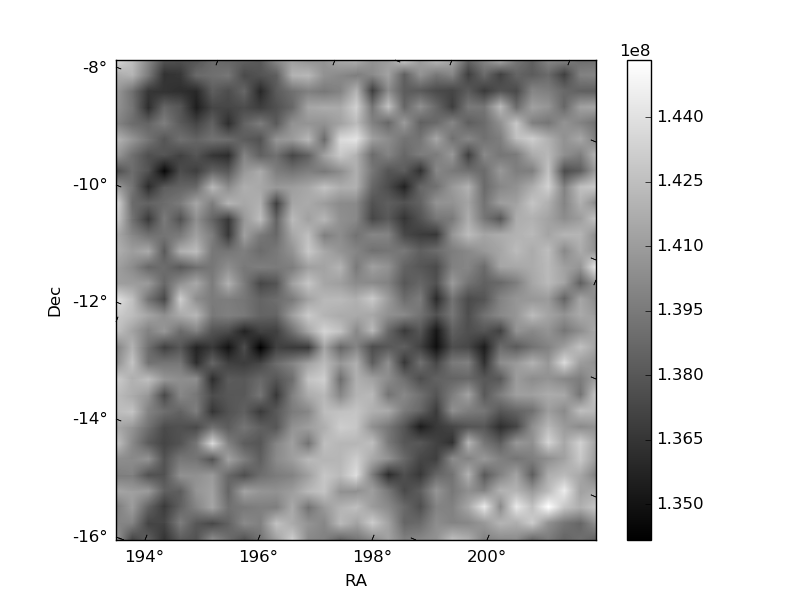
Histogram calculated using DETX and DETY for each event in the final _common_clean file
| Quadrant A | 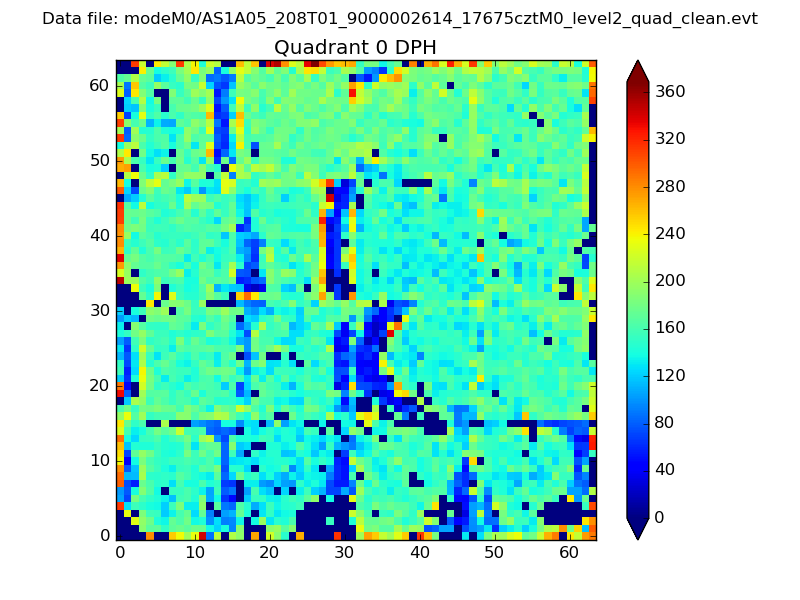 |
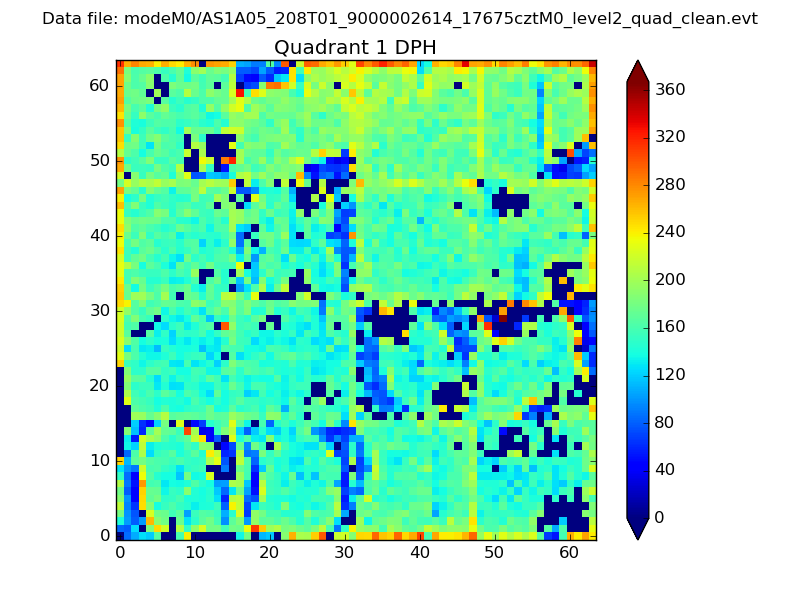 |
Quadrant B |
|---|---|---|---|
| Quadrant D | 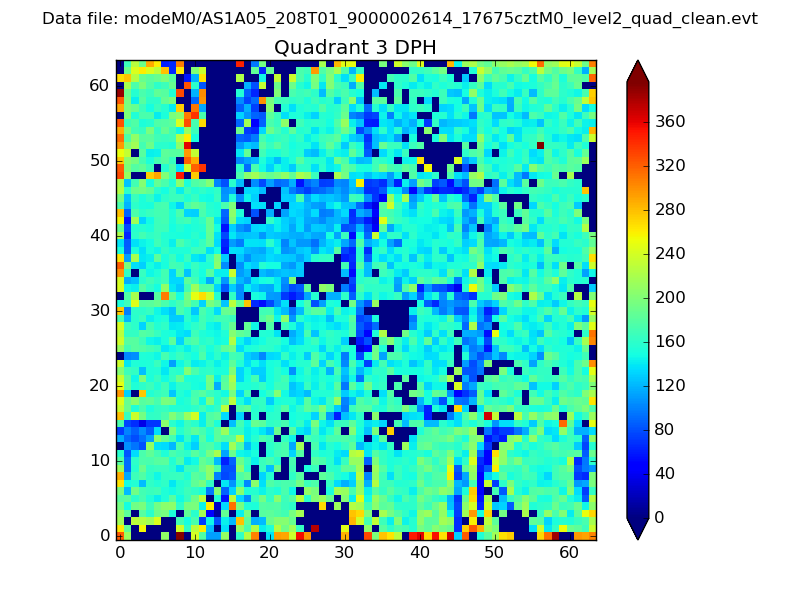 |
 |
Quadrant C |
| Plot type | Count rate plots | Images |
|---|---|---|
| Comparison with Poisson distribution Blue bars denote a histogram of data divided into 1 sec bins. Red curve is a Poisson curve with rate = median count rate of data. |
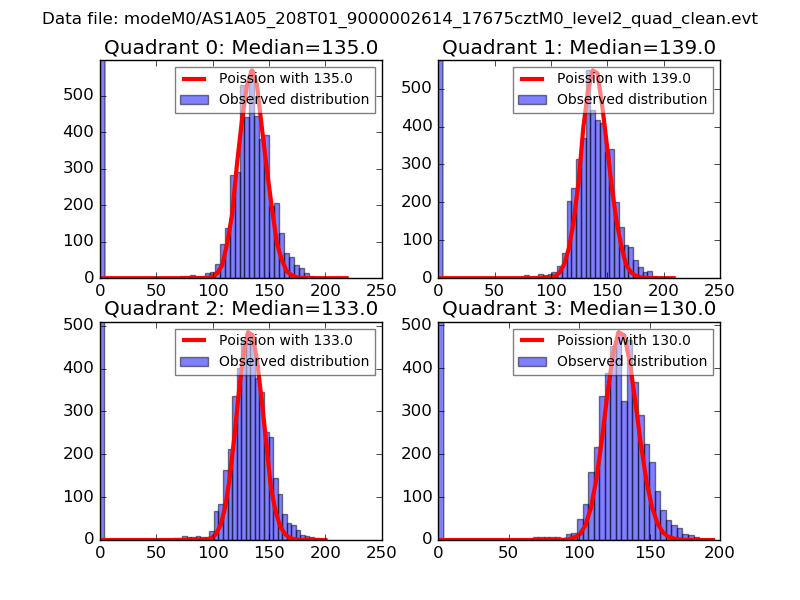 |
 |
| Quadrant-wise count rates Data is divided into 100 sec bins |
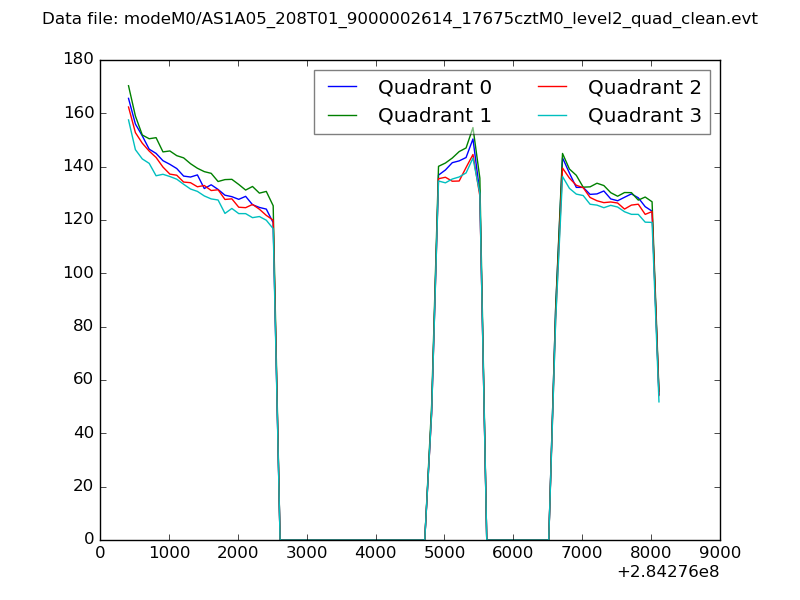 |
|
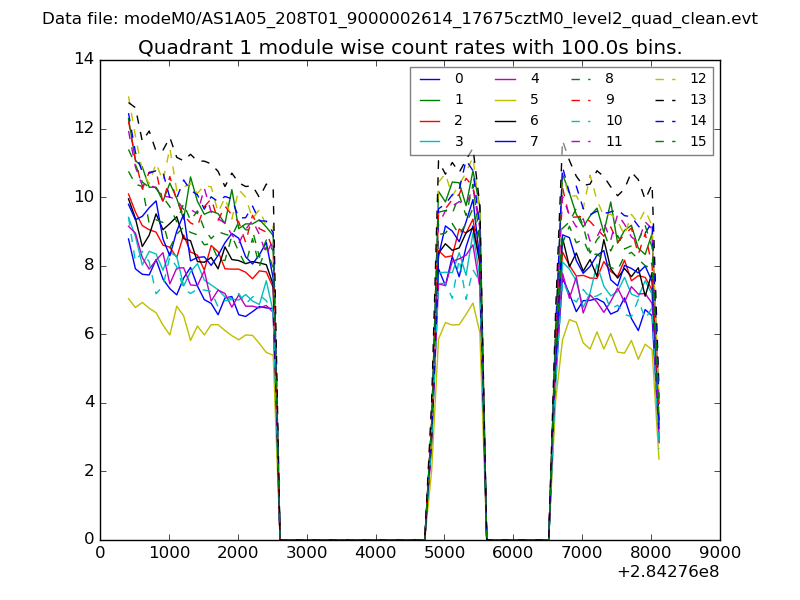
| Module-wise count rates for Quadrant A Data is divided into 100 sec bins |
 |
 |
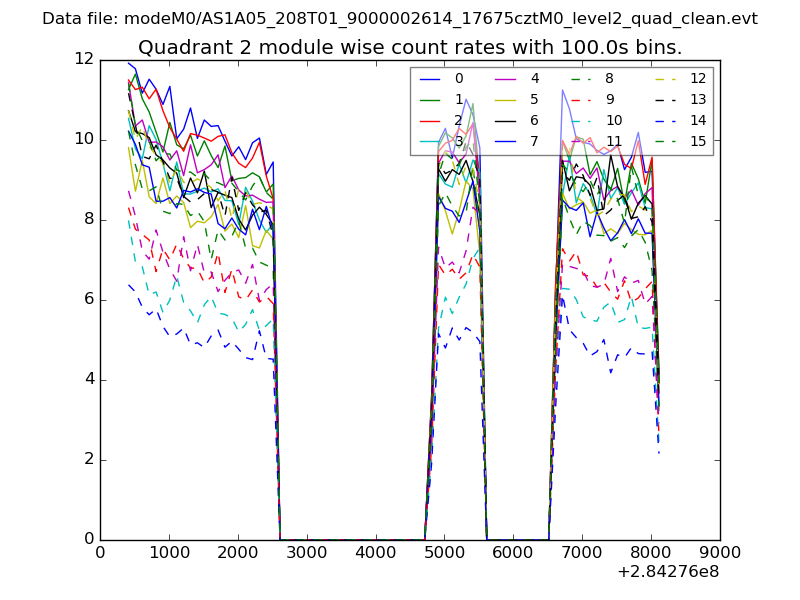
| Module-wise count rates for Quadrant B Data is divided into 100 sec bins |
 |
 |
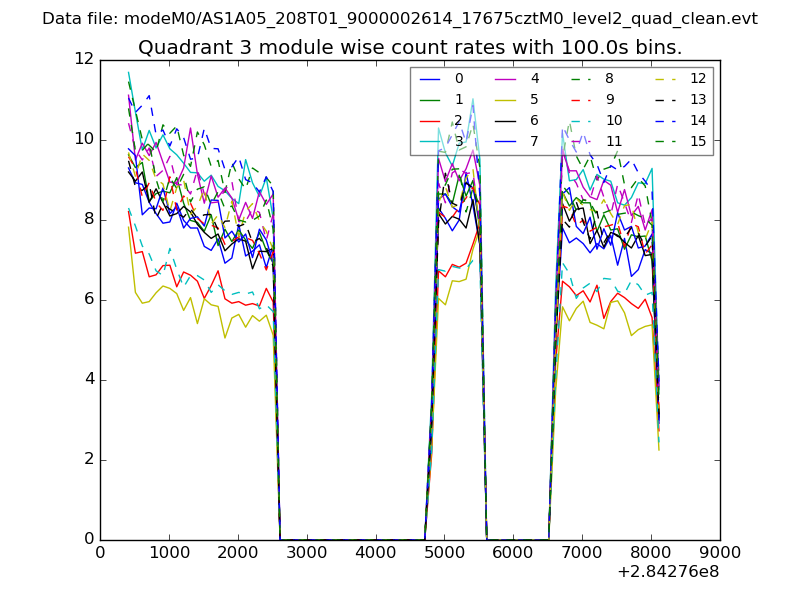
| Module-wise count rates for Quadrant C Data is divided into 100 sec bins |
 |
 |
| Module-wise count rates for Quadrant D Data is divided into 100 sec bins |
 |
 |
| Parameter | Plot |
|---|---|
| CZT HV Monitor | 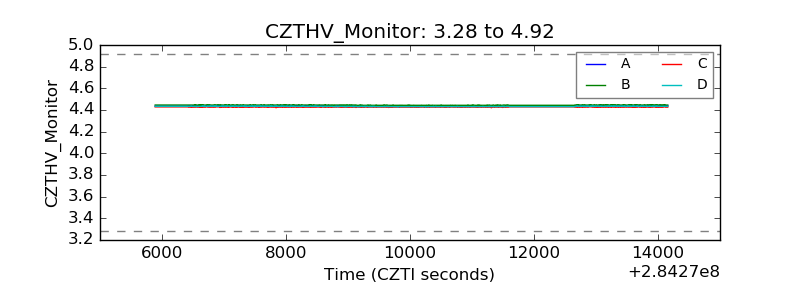 |
| D_VDD | 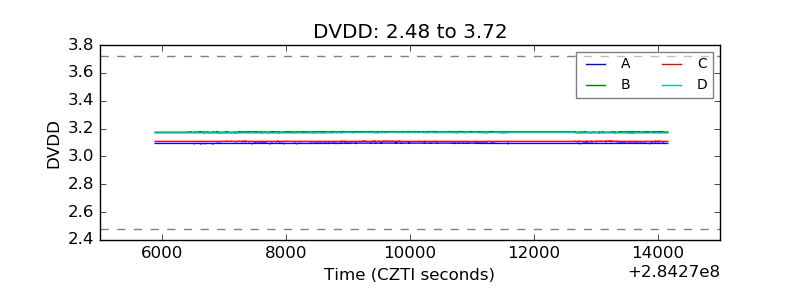 |
| Temperature 1 |  |
| Veto HV Monitor | 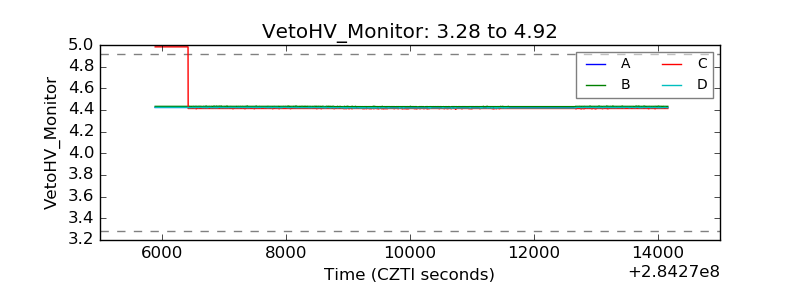 |
| Veto LLD | 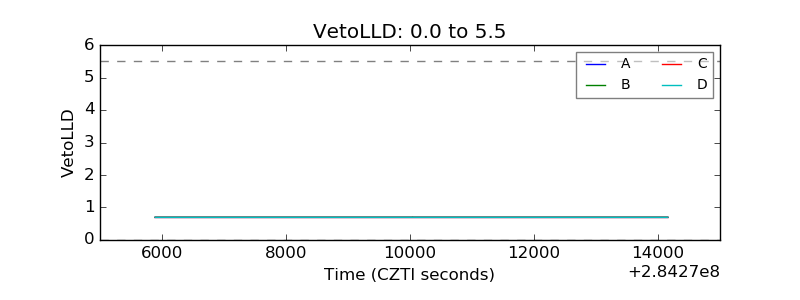 |
| Alpha Counter | 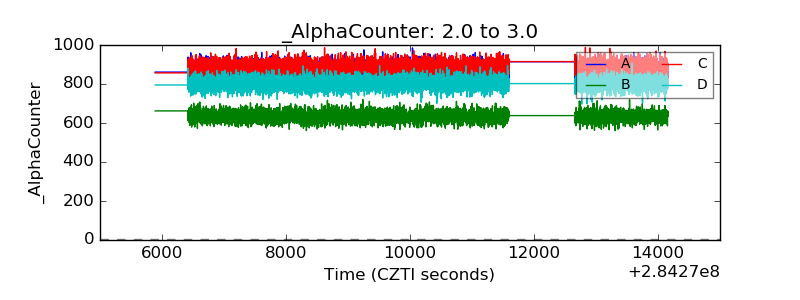 |
| _CPM_Rate | 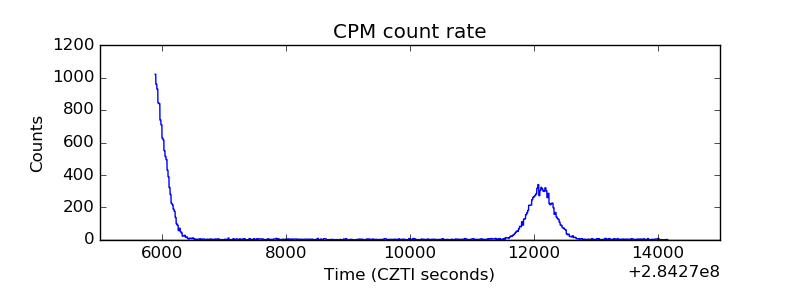 |
| CZT Counter | 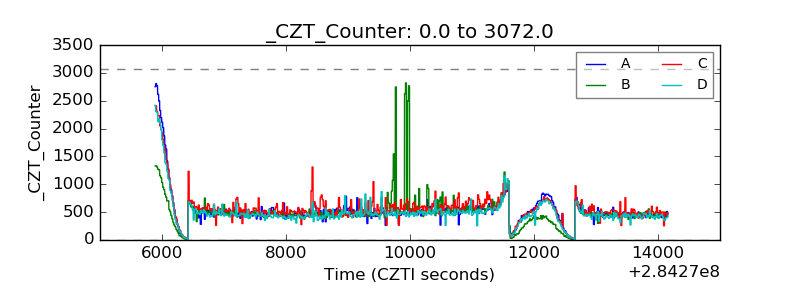 |
| +2.5 Volts monitor |  |
| +5 Volts monitor |  |
| _ROLL_ROT | 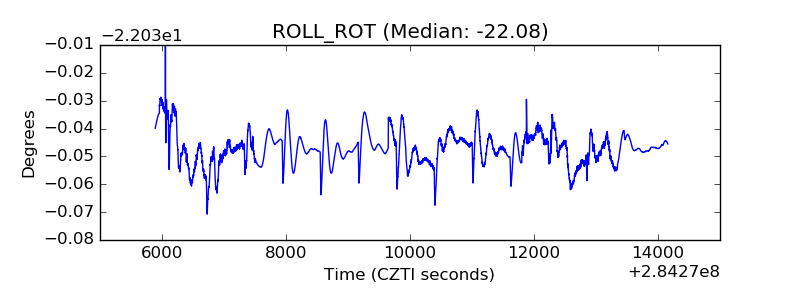 |
| _Roll_DEC | 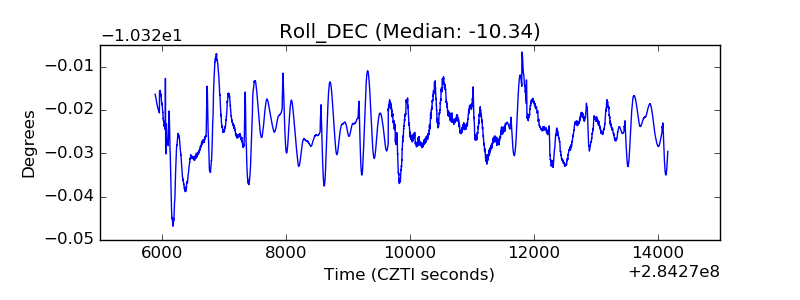 |
| _Roll_RA | 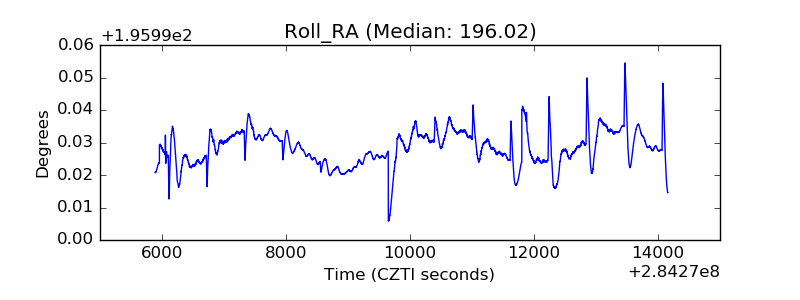 |
| Veto Counter | 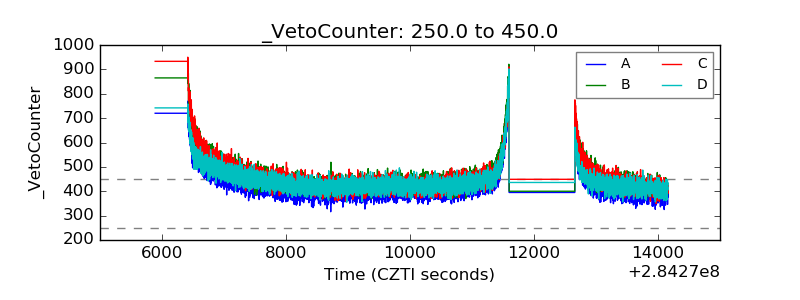 |